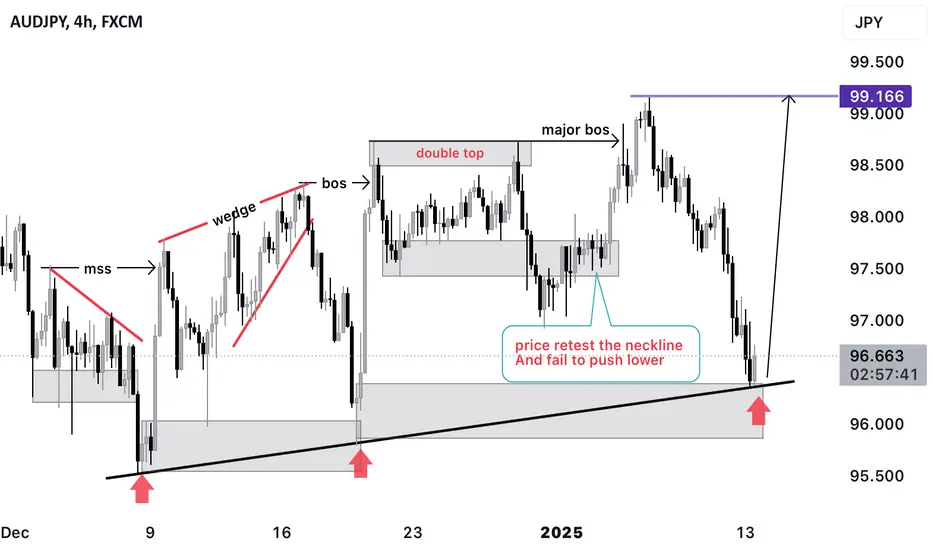
AUDJPY swing Trade Idea This is AUDJPY price action breakdown
Give a support If you support the idea
Double Top or Bottom
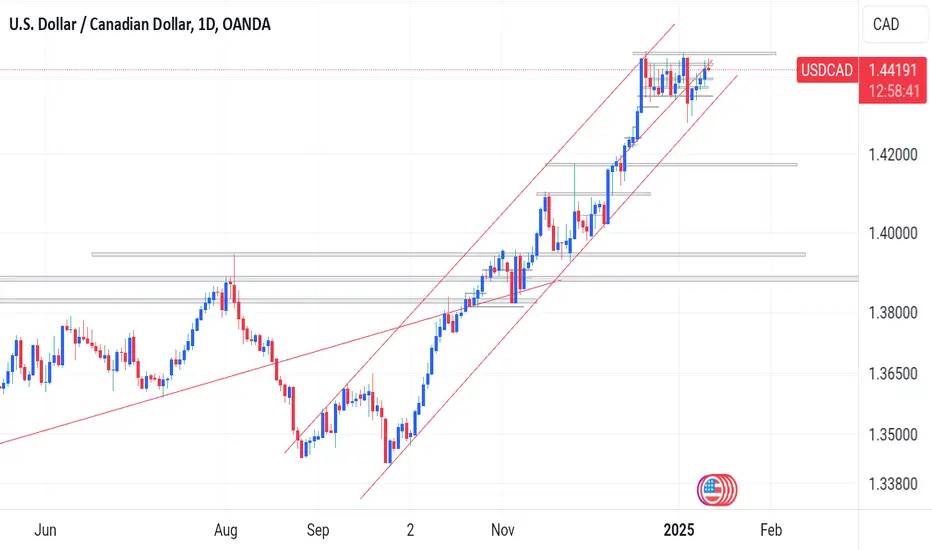
Usdcad bearish entry level🌟 USDCAD Analysis 🌟
I shared this last before it got to the entry.
We've seen a strong uptrend in #usdcad for a while now, but what's next? 📈
✔️ Double high formation
✔️ A nice bearish engulfing pattern breaking out of the trend
Now there is a retest on the trendline, and then it's time to buckle up for a bearish loooong ride! 🔥
Let's see how it plays out and if the bears can take control! 🐻
Note: This base on technical factors
Two very high impact news this week, PPI and CPI
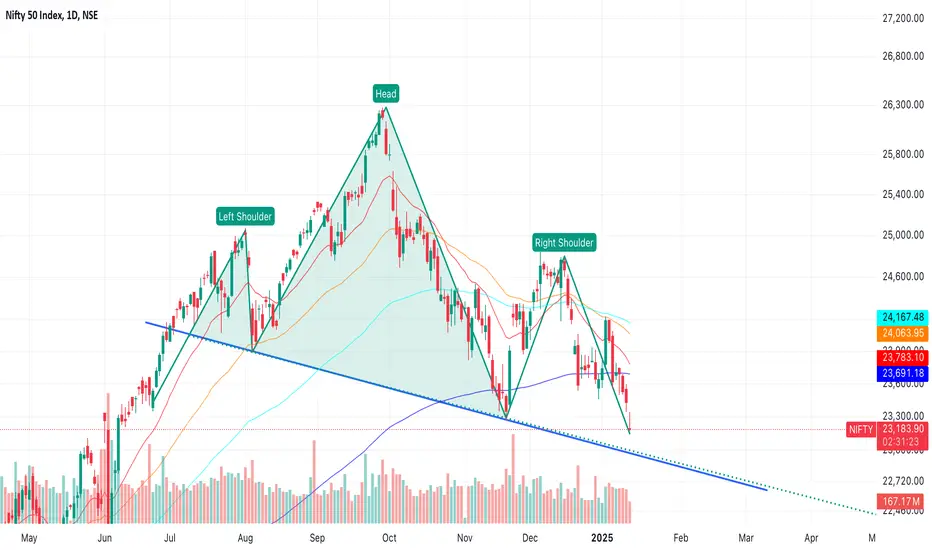
Nifty is close to Bottom!!!In my view Nifty is close to Bottom around 23K or we are headed for a structural bear market with targets of 18K or so.....and I don't believe the second is possible given that we are in good shape as an economy.
My hypothesis - dooms day isn't around:
- at around 23200 there is a double bottom pattern and markets could rebound from here
- In my view there is a head shoulder pattern visible on Nifty and the neck line is around 23K and if this is broken then the downside is all the way down to sub 20K - which is a doom's day scenario and that won't happen
- Like I mentioned before very bullish on RIL and IT sector to ensure we don't go into dooms day!!
Fingers crossed and I think its time to start deploying if you are in cash!!
BTC/USD Analysis: Stuck in a Wedge, Limited Movement ExpectedBitcoin is currently trading within a wedge pattern, struggling to make significant moves either higher or lower. While a small push up is possible, it's unlikely the wedge will break this week. A support level break is not off the table, but the market's direction remains uncertain. Monitoring the price action throughout the week will be key.

Never sell your $Butthole$Butthole/SOL following a familiar pattern on the 3hr chart.
Price action is wrapping up its second >-80% decline as it has found its second bottom.
Will likely rebound to above $120 mil market cap within 10 days or less.

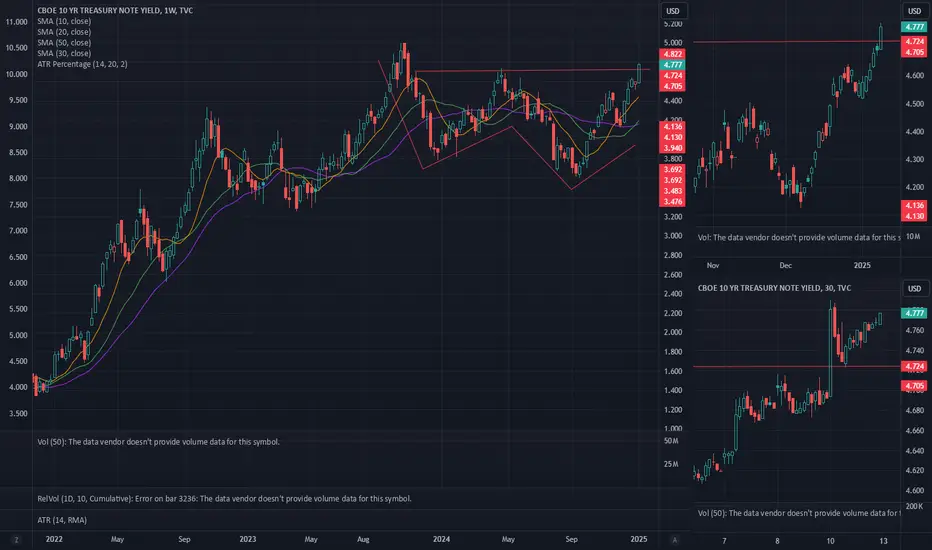
Ten year double bottom breakout?Not what we want to see, hope it fails. It wouldn't be good for equities.
Cameco Corporation (US) Stock Quote | Chart & Forecast SummaryKey Indicators On Trade Set Up In General
1. Push Set Up
2. Range Set up
3. Break & Retest Set Up
Notes On Session
# Cameco Corporation (US) Stock Quote
- Double Formation
* 43.00 USD | Area Of Value
* 52.00 USD | Downtrend Continuation | Subdivision 1
- Triple Formation
* (Neckline) | Entry Bias | Long Support | Subdivision 2
* Head & Shoulders Structure | Reversal | Subdivision 3
* Daily Time Frame | Trend Settings Condition
Active Sessions On Relevant Range & Elemented Probabilities;
European Session(Upwards) - US-Session(Downwards) - Asian Session(Ranging)
Conclusion | Trade Plan Execution & Risk Management On Demand;
Overall Consensus | Sell

WLD analysis: a bullish chance !BINANCE:WLDUSDT
WLD is forming a bullish double bottom pattern.
Which means the price is gonna increase after the break out happens!
be patient and you'll be rewarded!
⚠️ Disclaimer:
This is not financial advice. Always manage your risks and trade responsibly.
👉 Follow me for daily updates,
💬 Comment and like to share your thoughts,
📌 And check the link in my bio for even more resources!
Let’s navigate the markets together—join the journey today! 💹✨

Would a brokerage recommendation be reliable?Of the 44 recommendations that derive the current ABR, 37 are Strong Buy and three are Buy. Strong Buy and Buy respectively account for 84.1% and 6.8% of all recommendations.
The ABR suggests buying Nvidia, but making an investment decision solely on the basis of this information might not be a good idea.
The overpriced stock isn't going to continue to draw more money into the stock, and it may be time for the stock to enter a correction, with the risk of a short-term pullback increasing.

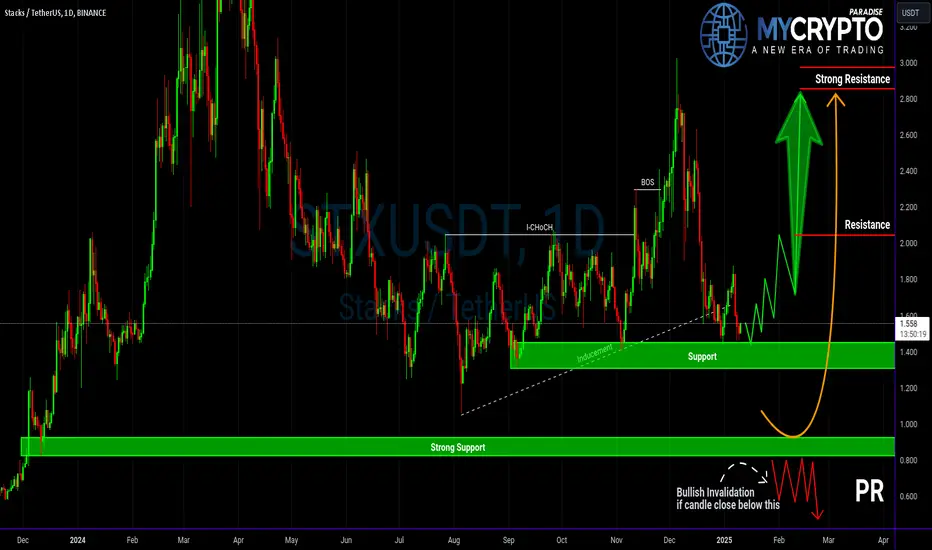
Is STXUSDT Setting Up for a Big Move? Don’t Miss These Key LevelYello, Paradisers! Is STXUSDT quietly building momentum for a major breakout? Let’s dive into the current market structure to see if we’re on the verge of a bullish opportunity — or if caution is the smarter play.
💎STXUSDT is showing bullish I-CHoCH (Internal Change of Character) and BOS (Break of Structure) on higher timeframes — a good sign that buyers are gaining control. The current retracement adds more weight to this setup, making it an attractive opportunity if we see further confirmation on lower timeframes.
💎The double-bottom pattern forming is another bullish signal. However, instead of jumping in early, it’s smarter to wait for a bullish I-CHoCH confirmation on lower timeframes to increase the probability of success.
💎If we get a deeper retracement or sudden panic selling, our focus will shift to the strong support zone below. This is where we expect a bounce, and once again, we’ll be watching for bullish I-CHoCH on lower timeframes to confirm the reversal.
💎If STXUSDT respects that support, we’re in a good position. But...
💎If the price breaks down and closes a candle below the strong support zone, that will invalidate the entire bullish idea. In that case, we step back and wait for better price action to form. No need to rush — the market will always give more opportunities if you stay patient and disciplined.
Play It Smart, Paradisers! At this point, it’s all about waiting for confirmation and avoiding emotional trades. The crypto market loves to punish impatience, but the disciplined traders always win in the end.
MyCryptoParadise
iFeel the success🌴
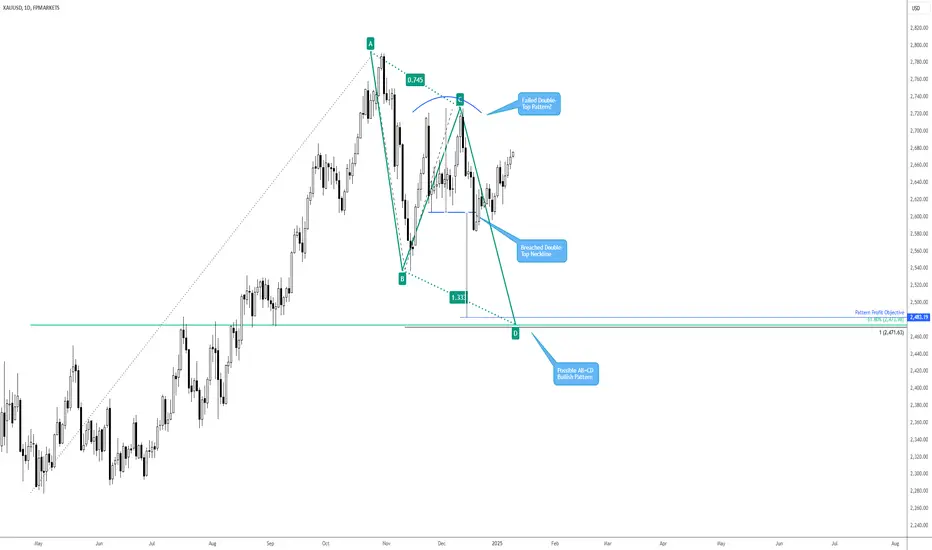
A Lot is Happening on Gold!While the price of Gold (XAU/USD) has been rangebound since December 2024, a possible AB=CD harmonic support zone at US$2,471 continues to call for attention. A 61.8% Fibonacci retracement ratio also complements this support at US$2,473. Investors will also likely take note of the double-top pattern around the December 2024 peak of US$2,726. The pattern’s neckline at US$2,605 has been breached, and its profit objective conveniently resides just above the AB=CD support at US$2,483.
So, two patterns indicate that a push lower could materialise before buyers attempt to step in. However, given Gold’s clear uptrend, a bullish move above the December 2024 peak also remains possible.
Gold Next Expected Move as respecting to Elliott WaveHello Traders!
Gold is Respecting well to Elliott Wave as all we know that its time for corrective moves in gold and on Thursday 09/01/2025 gold took good move in upside direction. its the clue for strong bearish trend as Elliott wave also expecting till 2487 which is very good move for sellers.
Chart Pattern also showing bearish trend as we can see double top and rising wedge in H4 and expecting target of 2571 which is also good move almost 1000 pips.
Support: 2649.300
Resistance: 2695.600
Key Level: 2670
Looking for good selling area to take entry till that i will wait and will not rush in this situation we can see selling area from 2676-2681
Traders if you like my idea then kindly support my idea and follow me for more analysis

It is still being revised and it may happen like this.COINEX:BTCUSDT It is still being revised and it may happen like this.

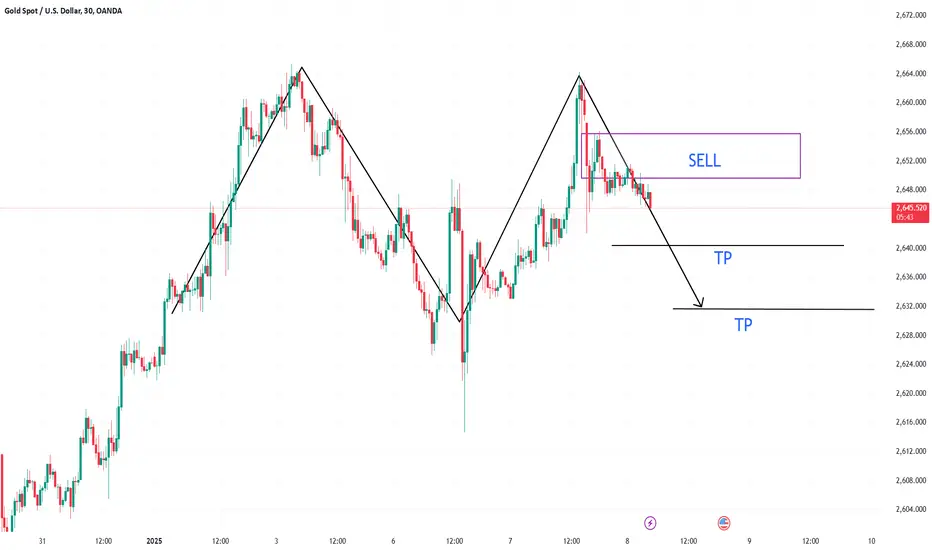
1/8 Gold Trading StrategiesGold is currently forming a double top pattern, which significantly increases the probability of a downside move. Therefore, the recommended trading strategy is to sell with a (TP) target at 2640-2632.
EURCAD: Bearish Outlook Explained 🇪🇺🇨🇦
EURCAD formed 2 bearish patterns on a daily:
first, the price violated a support line of a rising parallel channel,
a neckline of a double top formation was violated then.
It indicates a strong bearish pressure on the market.
The market may reach 1.475 support soon.
❤️Please, support my work with like, thank you!❤️

The upward trend will continue, target: 2670-2680Gold affected by bearish PMI data, initially pulled back to the 2642 level before rebounding sharply to a high of 2656. It has since slightly retreated but remains in a consolidation phase overall.
While gold's short-term bullish momentum has weakened somewhat, it is unlikely to establish a new downtrend in the near term. Recent pullbacks have consistently preserved the bullish structure, and during the rebound attempts yesterday and today, two long lower wicks have formed on the candlestick charts, signaling strong buying support below. Therefore, gold remains poised to break above the recent high of 2665 after this consolidation phase and extend its rally toward the 2670-2680 zone, or potentially even 2690.
Following today’s trading strategy, I entered a long position on gold at 2640 and manually closed it around 2659 to secure profits. Although I missed the opportunity to go long near 2642 after the PMI-driven pullback, I observed the formation of a W-bottom pattern on the 5-minute candlestick chart. This prompted me to re-enter a long position around 2646, and, given gold's current consolidation phase, I promptly closed the position at 2652 to lock in profits.
For upcoming trades, the candlestick chart shows an upward bias, and we will continue to prioritize long positions in short-term trading. However, the key support zone to watch has now shifted higher to the 2645-2635 range.
Bros, have you followed me and made a profit by going long gold? There will still be opportunities to participate in the long gold trade later. If you want to learn more detailed trading ideas and get more trading signals, you can choose to join the channel at the bottom of the article to make trading no longer difficult and make making money a pleasure!

NVDA - A 90% Short fall to the centerline ($100-$104) or lowerDouble top, failed breakout of the high—call it what you will.
Fact is, NVIDIA has taken a brutal hit and is now trading back inside the fork.
Hagopian—what on earth is a HAGOPIAN?
According to the Fork Framework rulebook, if the market fails to reach its next target (the next line, such as the centerline, lower median line parallel, etc.), it reverses and moves further back than where it started.
This is (not so exactly) what happened in December. Instead of reaching the centerline, the market turned, shot beyond the upper median line parallel (U-MLH), and was supposed to break above the November 21st high. It missed that target as well. And this, my friends, is....?
...again, a HAGOPIAN!
Now, it’s heading south again. But this time, we have an over 90% probability of reaching the centerline. Why? Because when the market breaks above the U-MLH and then falls back into the fork, it’s a very bearish signal.
Of course, nothing works 100%. The market could turn around today and push past the high. But statistically, we’re aiming for the centerline—and there’s an over 90% chance we’ll hit it.
When will it happen?
Sorry, my crystal ball is broken.
All I do is follow the Fork/Median Line rulebook and rely on my experience.
As for me, I’m opening a short position in NVIDIA today and may add to it on the way down to the centerline. And I play this game with Options, so no hard price level stop for me.

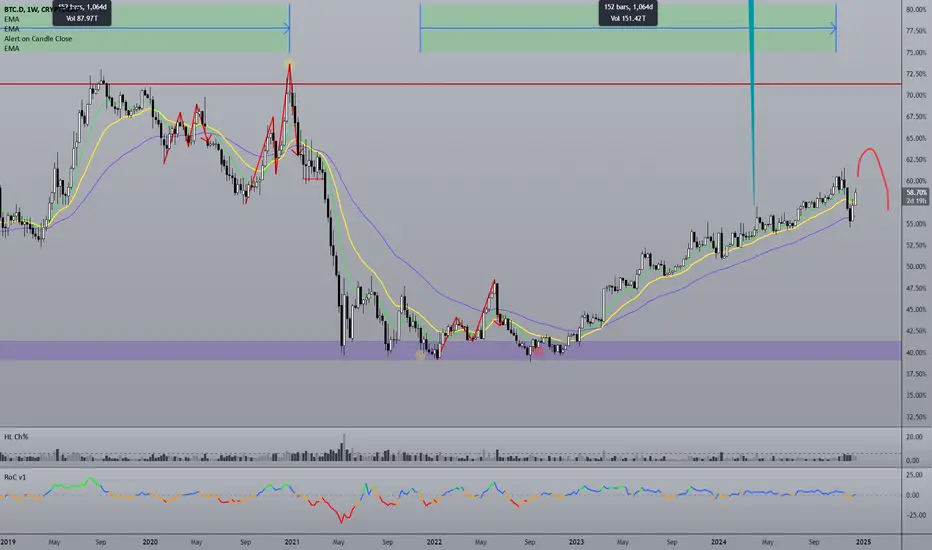
Altseason 2025 scenario.Here’s a bullish scenario for 2025: BTC.D Weekly Chart - a pattern that often precedes an Altcoin season. Prediction: It might occur in January next year.
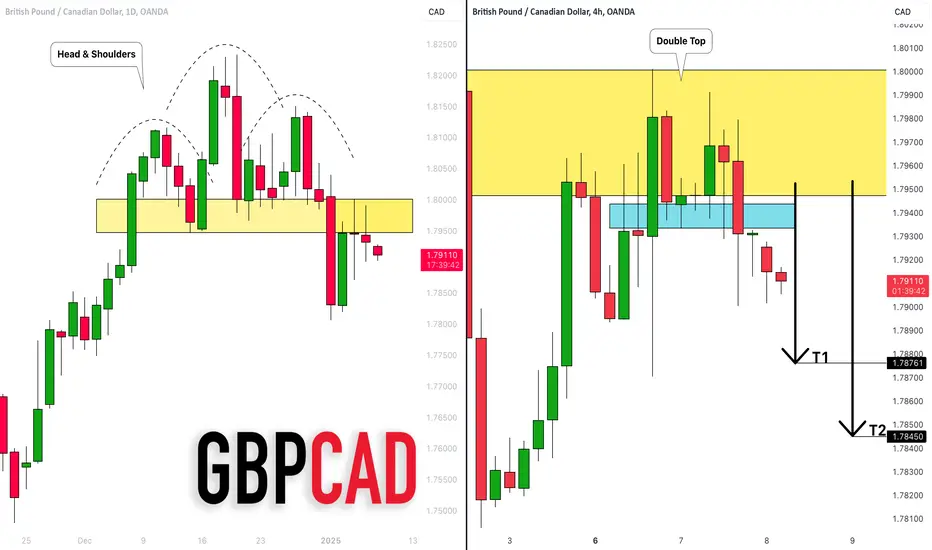
GBPCAD: One More Bearish Confirmation?! 🇬🇧🇨🇦
GBPCAD forms one more bearish pattern on a 4H time frame
after a retest of a recently broken neckline of a head & shoulders pattern on a daily.
Chances are high that the price will go down and reach at least 1.7876 level.
❤️Please, support my work with like, thank you!❤️
Nvidia Stock Double Top Nvidia 📉 **Double Top Pattern in Technical Analysis** 📉
A **Double Top** is a bearish reversal pattern that signals a potential trend change from upward to downward. It forms after a strong uptrend and consists of two peaks at roughly the same price level, with a valley (or trough) in between.
🔍 **Key Characteristics**:
1. **First peak** – Price hits a high point and retraces.
2. **Second peak** – Price rises again but fails to surpass the first peak.
3. **Neckline break** – A drop below the trough confirms the pattern, signaling a potential downtrend.
🚨 **What it means**: When the price breaks below the neckline (the support level), traders may look for a sell signal, as the pattern suggests weakness and a possible reversal of the current uptrend.
#TechnicalAnalysis #DoubleTop #ChartPatterns #StockMarket #TrendReversal #TradingTips
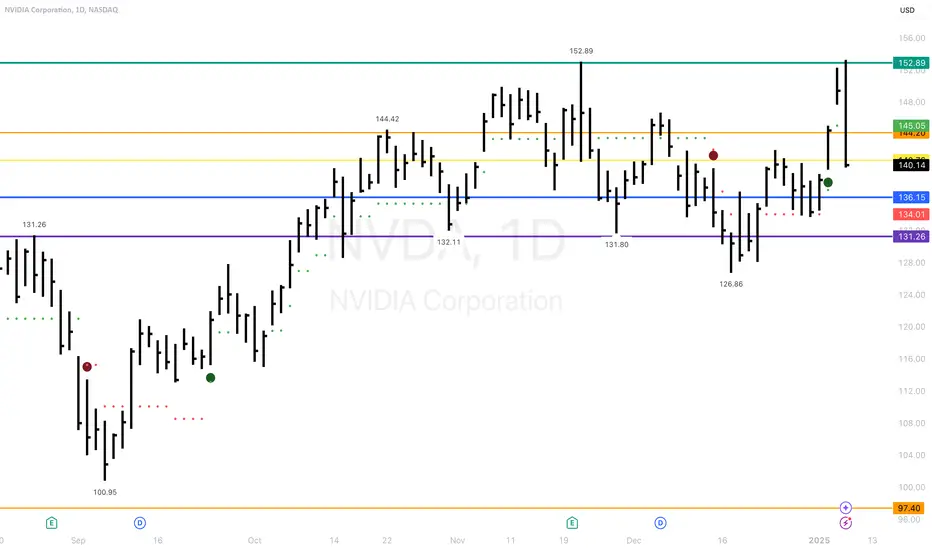
Possible bear case and short entryNASDAQ:NVDA possible bear case projection with the double-top.
If lost, short entry short entry should wait for a rejection by weekly EMA30, blue box.
Give price a chance to bounce-off $129 and weekly EMA30 before getting beared-up.

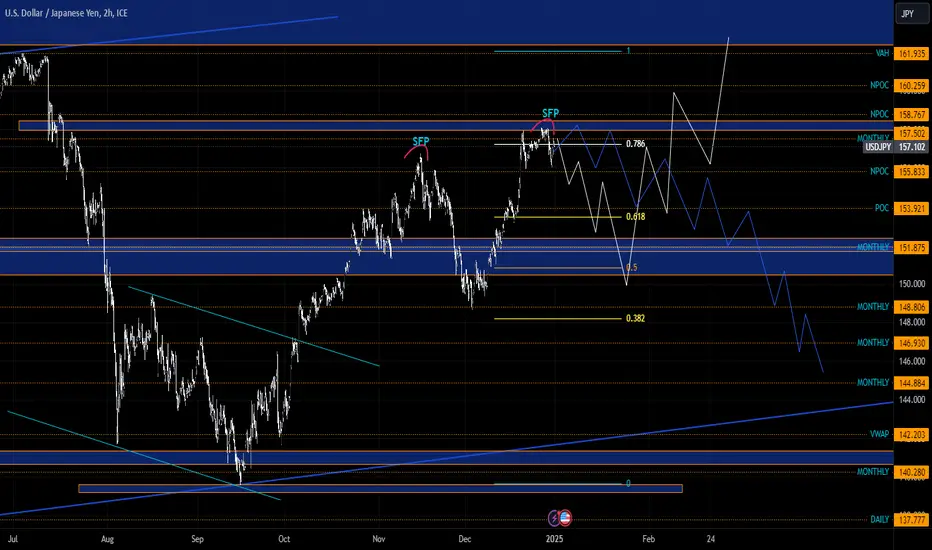
USDJPY Scenario 1.1.2025At this moment we are shown two scenarios, both shorts, we have an sfp above the low because it could give us a better view of the overall direction the market could be heading at the moment, support above us, which if it breaks, nothing prevents us from moving to a higher level, if we hold the level, then we can expect a move somewhere towards the price of 150, but I am still waiting for confirmation.
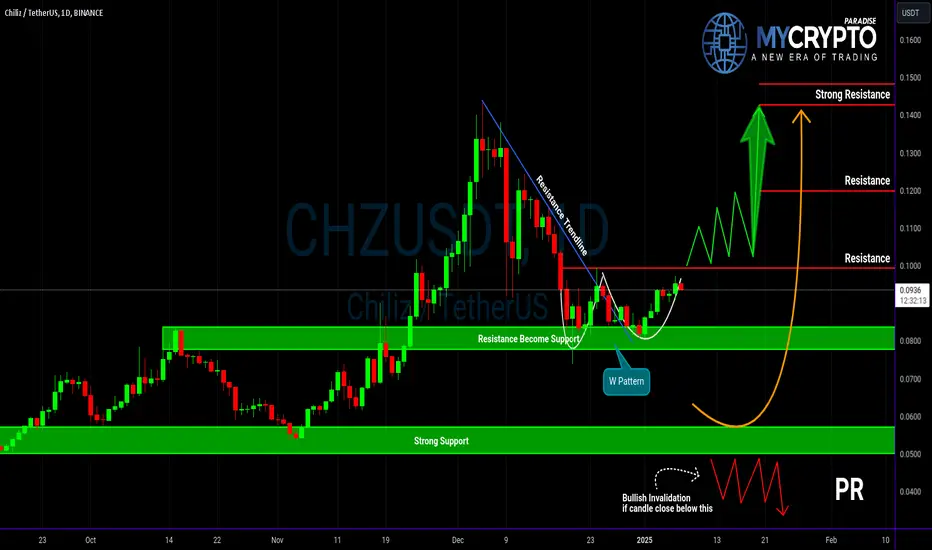
CHZUSDT: Bullish Breakout or Breakdown? Key Levels to Watch!Yello, Paradisers! Is CHZUSDT about to break out into a bullish rally, or will the support zone crumble and invalidate the setup? We’re at a critical decision point, and how price reacts at key levels will be crucial. Let’s break it down.
💎CHZUSDT has formed a W-pattern at a key support zone, which is a classic bullish reversal structure. This pattern increases the probability of an upward move, but it still requires confirmation. Without a proper breakout above resistance, the bullish setup remains incomplete.
💎To validate the W-pattern and increase the chances of bullish continuation, CHZUSDT needs to break through the resistance level and close a candle above it. A confirmed breakout at this level would signal strength from buyers and could lead to a significant upward move.
💎However, if the price pulls back instead of breaking out, there’s still hope for the bullish case. In the event of a retracement, we can expect a bounce from the strong support zone. But to increase the probability in our favor, it’s essential to watch for bullish signals on lower time frames. These include an Internal Change of Character (I-CHoCH) or familiar patterns like a smaller W-pattern or an inverse head and shoulders. Seeing any of these will reinforce the bullish outlook.
💎On the other hand, if the price breaks down and closes a candle below the strong support zone, the bullish idea becomes invalid. In that case, it’s better to step back and wait for cleaner price action to form before making any new decisions. It’s never a good idea to force a trade when the market is unclear.
Patience is key here. The market rewards those who wait for high-probability setups rather than chasing moves without confirmation. Discipline and a clear strategy will always keep you ahead.
MyCryptoParadise
iFeel the success🌴