Double BottomCLSK
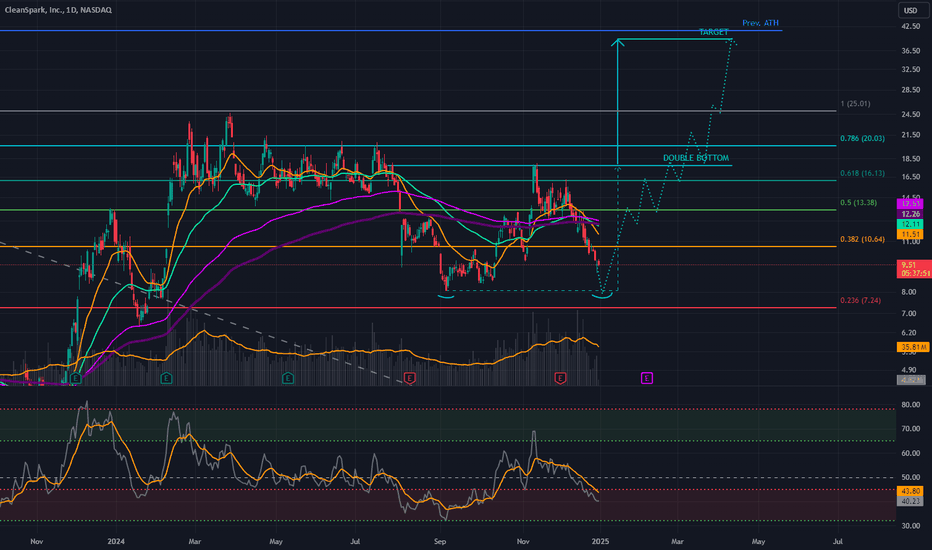
Potentially a Double Bottom forming on the daily chart.
When the next low is printed I´m going to pay attention to if the daily chart prints Bullish Divergence on the RSI. If yes and we see upwards momentum in price with continuation it would confirm that the bottom is in for CLSK and we go up from here.... Possibly in to a parabolic phase of the market which also signals the end is near. for this cycle.
BTC
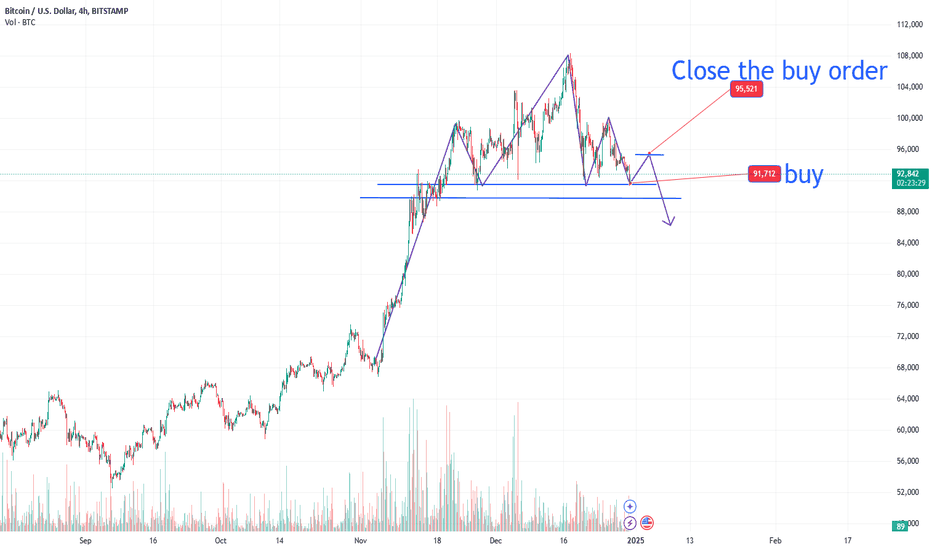
This all is dependent on what the price does for BTC. The BTC chart is a leading indicator when analyzing and trading CLSK. If/when BTC sets in the low of the present correction and pushes price up with continuation, first then the price of CLSK has a chance to break to the upside.
MARKET SENTIMENT
Right now in time of writing the market sentiment is cracking and the FEAR & GREED indicator is at 64 signaling that we are starting to see a reset of the market sentiment. This indicates that people that is suffering losses on their trade are willing to sell at a loss in order to salvage their hard earned money. A reset of the market sentiment is good for future price apreciation
"It is always the dumpiest before the pumpiest" as one smart guy once said.
WHERE IN THE CYCLE ARE WE?
Zooming out and watching previous cycle leading in to the CLSK top in 2021 we see that CLSK topped out 100 days before BTC did. Now one can assume that both BTC and CLSK are more mature assets now. How that affect its price-action we will hopefully live to see.
VOLUME
Looking at the volume on the chart we can see there is a substantial amount of volume traded at this times of lower prices... sellers are leading the race hence the price declines BUT... WHO is buying? Is it retail? I don´t think so... keep in min the market sentiment is cracking at the moment and scared money is probably letting go of their positions.
FUNDAMENTALS/b]
I believe CLSK is a bargain at $10. Why? Because they at the time of writing are mining bitcoin at a cost of around $55k / BTC and a time when price is around $100k / BTC, AND they are hodling their bag, i.e. not selling.
Accounting The FASB have adopted the FAIR VALUE ACCOUNTING for companies holding BTC and that could potentially boost the value of CLSK significantly, watch next earnings report.
Dilution CLSK have been diluting their shares significantly over the last year. In doing this they have been growing their hashrate to stay competitive which is good in the long run, shitty in the short run.
The last vote on issuing more common stock got approved in Q4 2024, in doing this they mitigate the dilution by featuring a capped call option meaning they will not be diluting any more shares until price reaches above $24.
MACRO
The liquidity has been increasing during 2024, i.e. there has been money printing by lowering interest-rates and other stimulatives. Jerome Powell raised a finger for inflation concerns as we move in to 2025 leading to a market decline as the fears are the liquidity (money printing) will slow in 2025.
COUNTER ARGUMENT
If the liquidity injection slows down in 2025 we will probably see markets turn over and a recession is likely to kick in full throttle. This would take us in to a bearmarket and all bullish bets are of.
CONCLUSION
BULL If the bullish bet is on I am expecting price to reach at least $24 before dilution starts to kick in.
BEAR If the moneyprinter stops all bets are of and we sell our bags to fight another day.
Double Top or Bottom
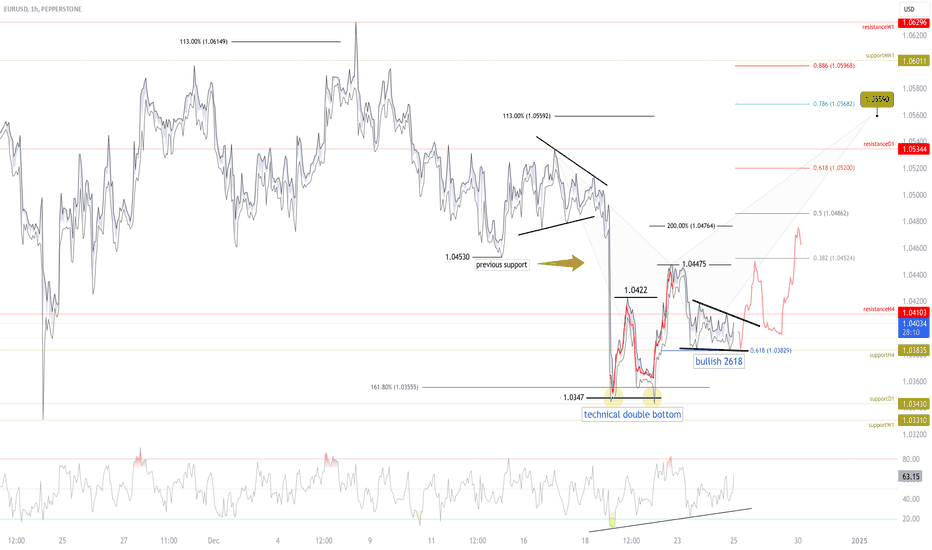
$EURUSD 60-Minute Chart: Bullish Technical Setup in Play🚀 EURUSD Analysis (60-Minute Timeframe):
🔹 After the formation of a technical double bottom , confirmed by the breakout above the neckline at 1.0422, the pair is likely to move towards the 200% Fibonacci extension at 1.0476.
🔹 New resistance formed at 1.0447, still below the previous fractal support at 1.0453.
🔹 A bullish 2618 pattern is unfolding, with recent lows near the crucial 61.8% Fibonacci retracement at 1.0382. 📊
🔹 This setup depends on the earlier double bottom formation to hold. 🔄
⚠️ A break below the daily fractal support would invalidate this bullish setup, with targets aligned with the default target for the double bottom. Let's monitor this reversal pattern closely as it could trigger a significant upward move. 📈
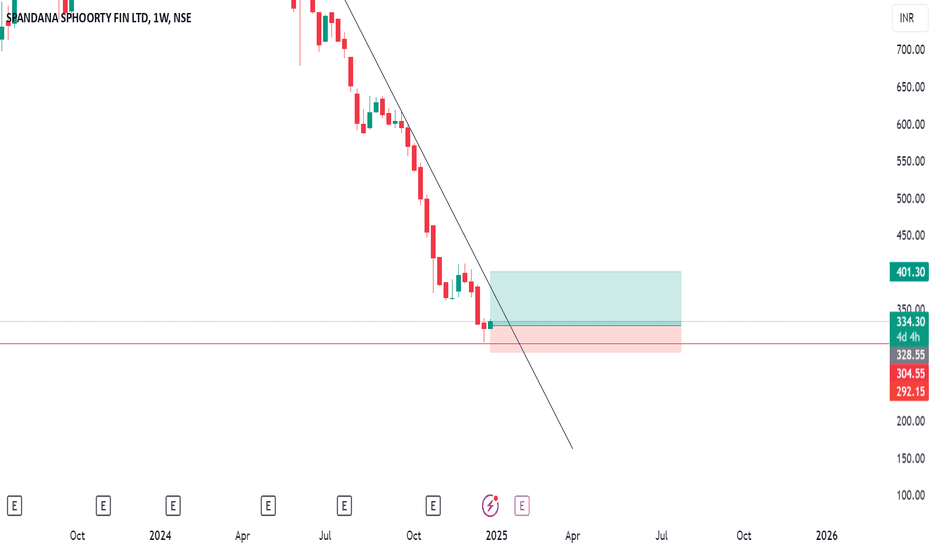
Forming hammer near all time low - on weekly time frame"Rebounding from the Bottom? A Hidden Gem in Spandana Sphoorty!"
🔍 Analysis:
Spandana Sphoorty, trading 75% below its All-Time High (ATH), shows strong signs of a potential turnaround:
📊 Weekly Chart: Forming a bullish hammer pattern.
📈 Daily Chart: Displaying a morning star pattern near its all-time low.
💰 Valuation: The stock is trading at just 0.68x its book value (Book Value: ₹480; Current Price: ₹332).
🎯 Trade Setup:
Entry: ₹328
Stop Loss: ₹292
Target: ₹401
Risk-Reward Ratio: 2:1
💡 Why This Looks Promising:
The stock has formed strong technical patterns at a crucial support zone and offers a low-risk opportunity for entry.
📢 Disclaimer:
This post is for educational purposes only. Investments in the stock market are subject to market risks. Please consult a financial advisor before making any trading decisions.
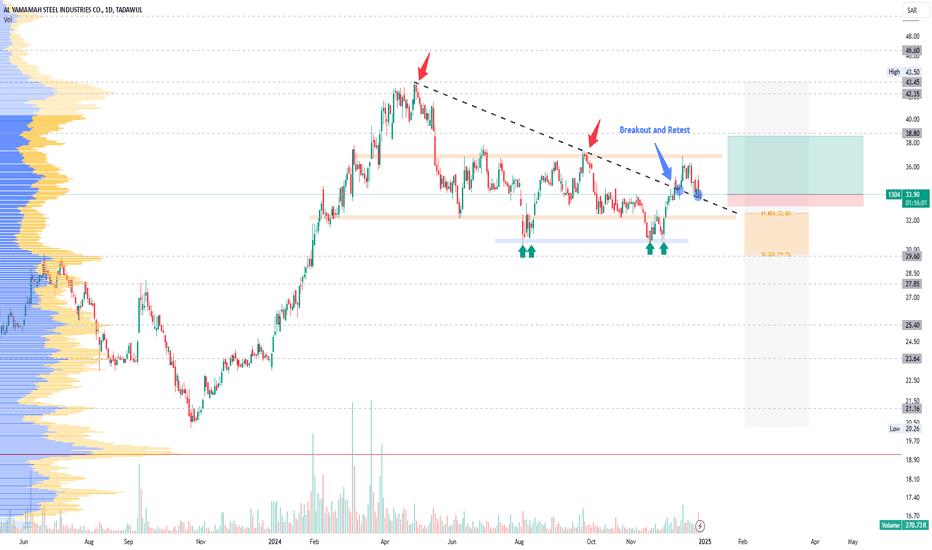
1304: Triangle Breakout and Retest1304 has shown a recent upward movement.
Price was moving within triangle.
A breakdown of triangle was observed but could not sustain. Price took an upside movement after making a double bottom (support zone).
Price is retesting the breakout of triangle.
Entry can be taken with low risk.
Manage your risk and enjoy the ride.
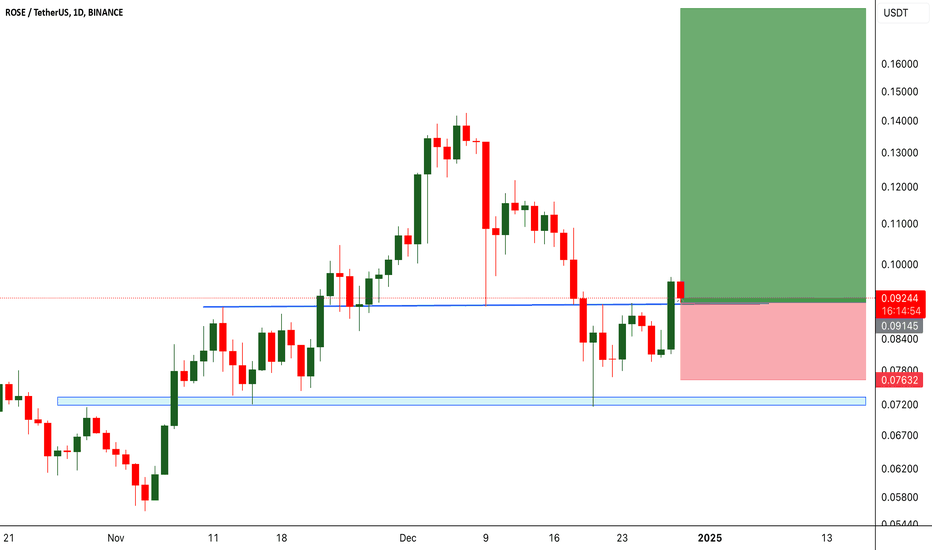
ROSEUSDT: Catching the Retracement for a Potential Big Move!!ROSEUSDT has shown promising signs of a potential bullish continuation. After a successful bounce from a major support level, the price consolidated briefly before a strong breakout yesterday, pushing through resistance. Today's retracement to the broken resistance level (now acting as support) presents a potential entry opportunity for traders. Always manage your risk and use appropriate position sizing.
BINANCE:ROSEUSDT Currently trading at $0.092
Buy level: Above $0.09
Stop loss: Below $0.076
Target : $0.18
Max Leverage 3x
Always keep Stop loss
Follow Our Tradingview Account for More Technical Analysis Updates, | Like, Share and Comment Your thoughts
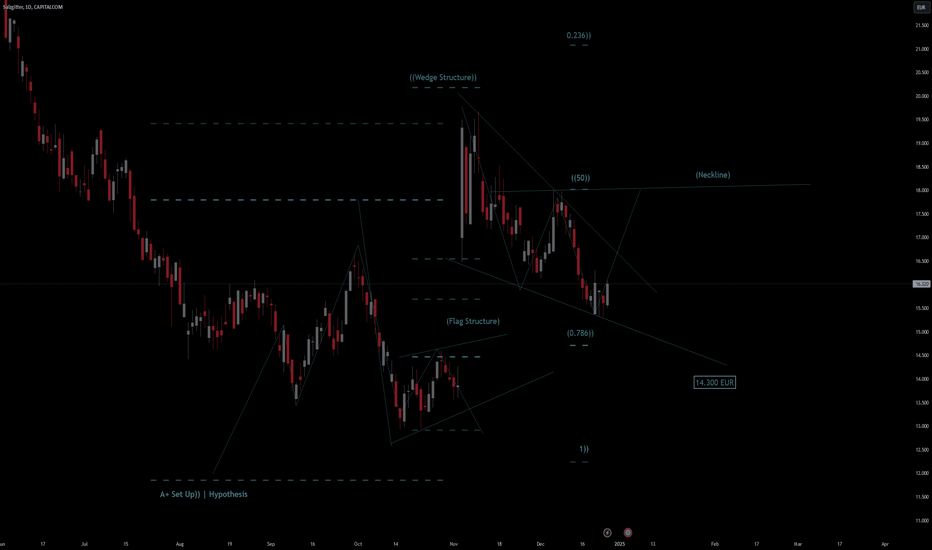
Salzgitter Stock Quote | Chart & Forecast SummaryKey Indicators On Trade Set Up In General
1. Push Set Up
2. Range Set up
3. Break & Retest Set Up
Notes On Session
# Salzgitter Stock Quote
- Double Formation
* (Flag Structure) | Completed Survey(Reversed) | Subdivision 1
* ((Wedge Structure | 14.300 EUR | Area Of Value
- Triple Formation
* Retracement Numbered | Uptrend Bias | Subdivision 2
* (Neckline) | Pattern Configuration
* Daily Time Frame | Entry Settings | Subdivision 3
Active Sessions On Relevant Range & Elemented Probabilities;
European Session(Upwards) - US-Session(Downwards) - Asian Session(Ranging)
Conclusion | Trade Plan Execution & Risk Management On Demand;
Overall Consensus | Buy
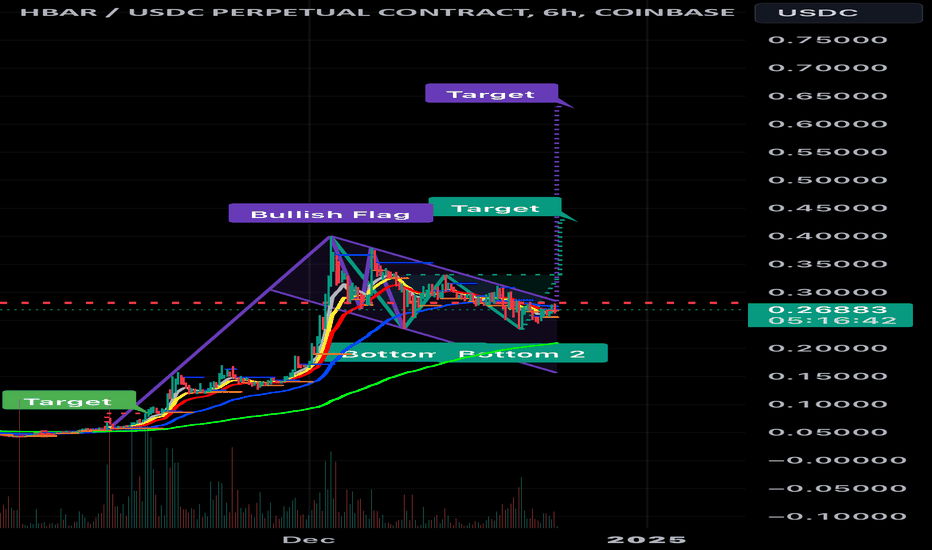
HBAR/USD Technical Analysis: Bullish Signals EmergeTechnical Overview:
The HBAR/USD pair is exhibiting a confluence of bullish technical signals, suggesting a potential upward trend reversal.
6-Hour Chart: The pair is currently forming a bullish flag pattern. This pattern typically follows a strong upward move (the "flagpole") and then consolidates within a narrow range (the "flag"). A breakout above the upper trendline of the flag would signal a resumption of the upward trend.
Smaller Timeframes: On smaller timeframes, the emergence of a double bottom pattern further strengthens the bullish outlook. The double bottom pattern forms when the price dips twice to a similar low and then bounces back, indicating increasing buying pressure at lower price levels.
Combined Interpretation:
The combination of a bull flag on the 6-hour chart and a double bottom on smaller timeframes presents a compelling bullish scenario for HBAR/USD. This suggests that the price may be poised for a significant upward move.
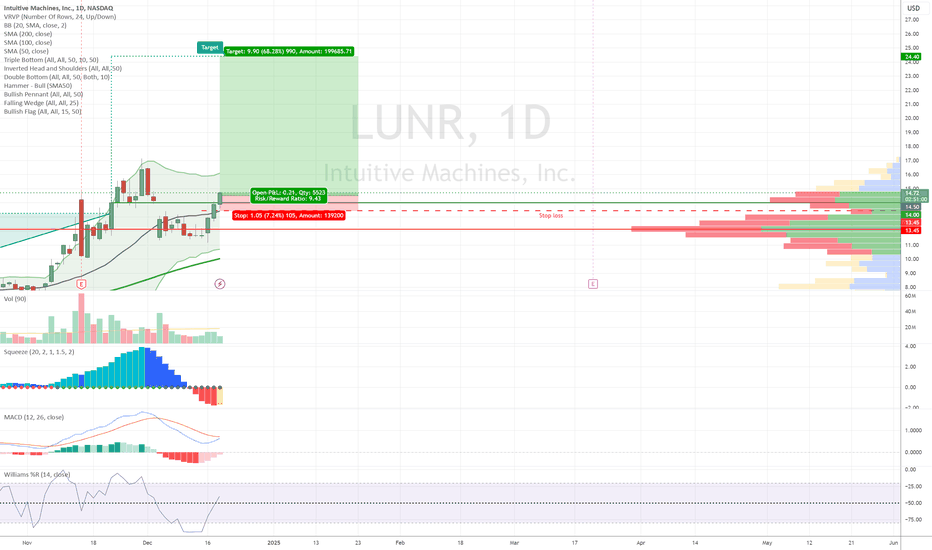
$NASDAQ:LUNR Ready for a 60% upside double bottom patternNASDAQ:LUNR there's a ~60% upside on this play.
Lunr has broken through a previous resistance point (~$14.00) and should be on track to reach the Price Target (PT) for completing a double bottom pattern ($24.41)
Entry : anything above $14, with positive direction indicators
Stop : $13.45 - heading below the ~14 resistance (now our support) is not ok, but should not dip into the lower volume pocket.
Exit : Take profits on half at ~$24 and set trailing stops on any remaining shares.
Good Luck!
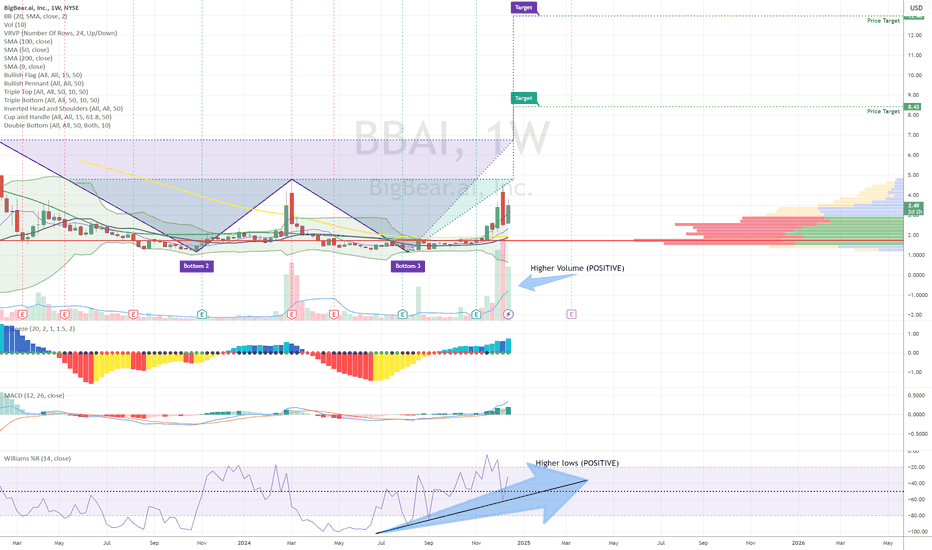
$NYSE:BBAI Double and Triple Bottoms with positive indicatorsThanks to @Money_Wins_Honey for getting this on my radar.
NYSE:BBAI is showing double and triple bottoms in the weekly as well as daily chart. The price targets are $8.43 and $12.96.
Here are my positives that support this trade:
The volume has been really going through the roof
Williams %R it tracking higher lows
It's in the AI space so it's HOT right now
Entry Points:
Higher Risk - Now, and place a stop below $3.00 (that's the current shelf that's being formed)
More conservative - wait until after breaking the double bottom resistance line (closing above $4.81)
Exits:
Double Bottom PT - $8.43
Triple Bottom PT - $12.96
Good Luck!
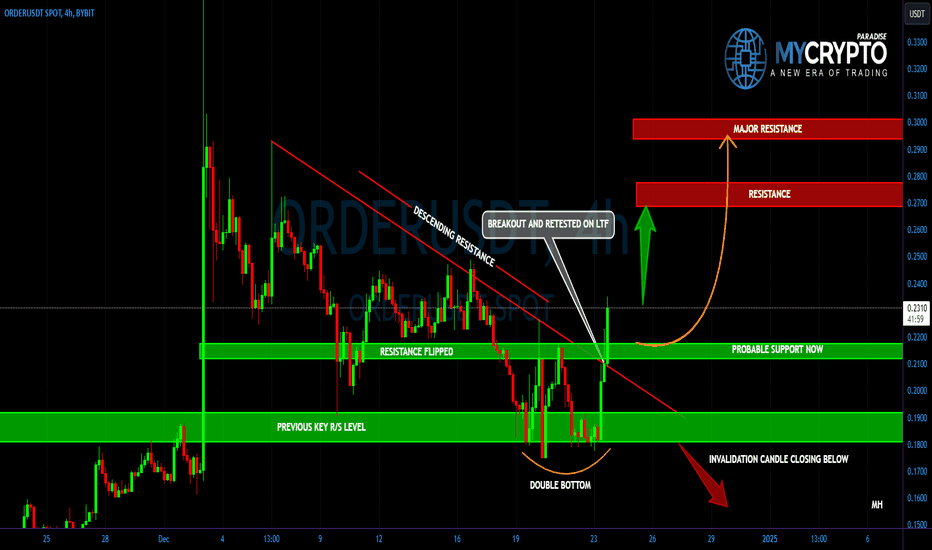
OrderUSDT: Is the Bullish Breakout for Real? Don’t Miss !Yello Paradisers! Are you ready for what could be the next big move? #OrderUSDT is flexing some serious strength compared to the rest of the market. But is it all hype, or are we on the verge of something significant? Let’s break it down.
💎#OrderUSDT has shattered a descending trendline it was stuck in for days. The breakout wasn’t just clean—it’s already retested on lower time frame as well, showing strong probability for sustained upside.After being crushed in a downtrend, the pair has shifted gears into an uptrend. That’s right, Paradisers: higher highs are back on the table.
💎The probability is high for the upside move as A critical resistance zone was flipped into support after formation of double bottom below at support zone. This spot is holding strong and could become the springboard for the next move up.
💎If OrderUSDT pulls back, look for the previous resistance-turned-support zone around $0.22-$0.23.A deeper retracement could test the descending trendline, now a key support near $0.20-$0.21.
💎The next critical resistance zone for OrderUSDT lies between $0.27 and $0.2751, a level that will likely test the strength of the current bullish momentum. A successful break and hold above this area could pave the way for a continuation toward the next significant hurdle at $0.295 to $0.30. Clearing this upper range would not only solidify the bullish structure but also signal the potential for an even stronger upward move, drawing increased market participation and setting the stage for higher targets in the near future.
💎If the pair fails to hold support and drops below $0.18, this would invalidate the bullish scenario and signal a potential return to bearish action.
💎This market loves to shake out the weak hands before making its real move. A pullback here might just be the perfect opportunity to position yourself smartly. But remember: discipline is key. Don’t rush—wait for confirmations at key levels.
Stay sharp, Paradisers. This market isn’t for the faint of heart—but for those who stay disciplined, the rewards can be game-changing. Let’s crush it!
MyCryptoParadise
iFeel the success🌴
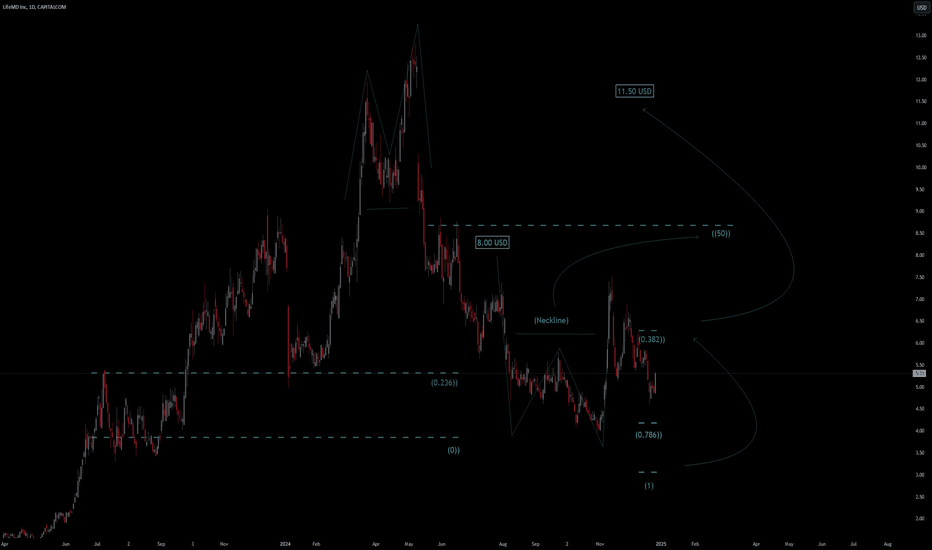
LifeMD Inc. Stock Quote | Chart & Forecast SummaryKey Indicators On Trade Set Up In General
1. Push Set Up
2. Range Set up
3. Break & Retest Set Up
Notes On Session
# LifeMD Inc. Stock Quote
- Double Formation
* (0.236)) & (0)) | Completed Retracement Survey
* 8.00 USD | Area Of Value | Subdivision 1
- Triple Formation
* (Neckline) | Configuration | ((50)) Retracement | Subdivision 2
* (0.382)) | Retracement Area Condition | Subdivision 3
* Daily Time Frame | Entry Settings
Active Sessions On Relevant Range & Elemented Probabilities;
European Session(Upwards) - US-Session(Downwards) - Asian Session(Ranging)
Conclusion | Trade Plan Execution & Risk Management On Demand;
Overall Consensus | Buy
