BUY INTEL (INTC) on any dip towards the $48 support areaBy looking at the daily chart, we can see the strong bullish rally that took the price from the March 23rd lows of around $44 to the June highs at $64, for an outstanding 45% increase in just couple of months. However, the stock didn’t stay there for long as a combination of a high profit taking interest and some further selling pressure took the price down again at the end of July to the $47-48 strong horizontal support zone. Since then, we have seen a volatile and choppy sideways price action between $48-52 levels.
The stock is currently sitting at the $54 mark after an attempt to make an upward break out of the above-mentioned range. However, we see multiple different and also strong resistances that are currently threatening the current bullish move. We can find the 100 DMA lying at the $54 mark and the strong horizontal resistance at $56. Today’s price action on the daily chart shows a bearish rejection candlestick, which in turn confirms the strength of the above-mentioned resistances and indicates that there might be further selling pressure ahead. This up move was anticipated as the stock built a meaningful support base around the $48 mark throughout the last couple months. However, we believe that the stock market in the US currently holds a lot of intrinsic risks - COVID-19, the upcoming presidential elections, the economic recovery etc. - which would probably mean that we could be in for a continued sideways and choppy price action in the coming months. At any rate, we our analysis shows that the uneven capital allocation across the different market sectors will continue to support the tech sector as well as the stocks in it. The large institutional investors will start looking for places to reinvest the tremendous profits that they have generated from the likes of ZOOM, TESLA, NETFLIX, Shopify etc. throughout the last 3-6 months, which will lead them to stocks like INTC!
We are bullish on the INTC’s stock and believe that any profit-taking corrections would give us a great opportunity to buy the stock at a good discount. This, in turn would give us a chance to maximize our profits to the upside, once the stock resumes its uptrend movement. Furthermore, some of the technical indicators that we are monitoring closely (50 DMA, 100 DMA, Bollinger Bands, RSI etc.) are currently showing exhaustion of the recent up move and are signaling that a potential return-move to the $48-52 range might occur very soon. This will be the right time to jump on the bullish Intel train, that will take you up to the $60 mark in the coming weeks and months.
Our long-term target levels are $61 and $66 respectively.
Sincerely,
DowExperts
Dowexperts

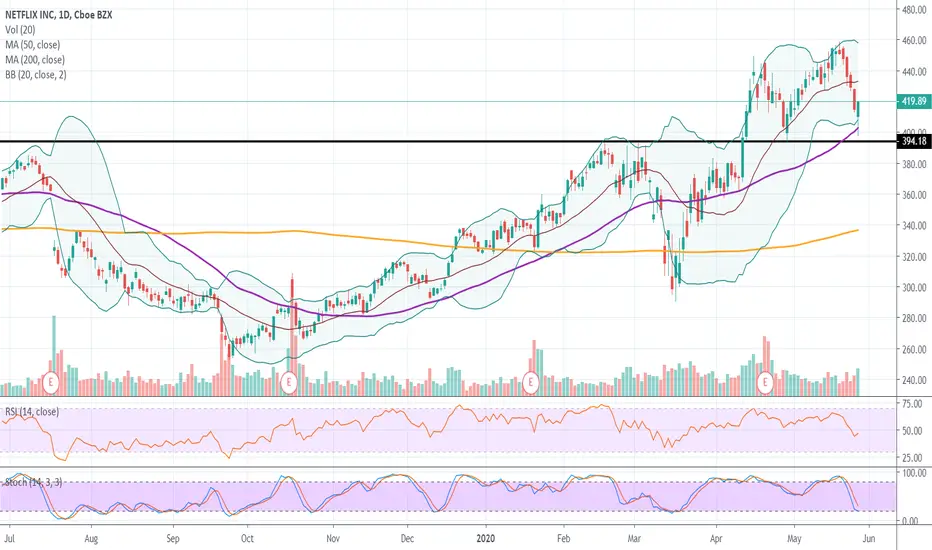
Full Stock Report - Netflix Inc. - A strong growth story!Due to Netflix’s huge expansion globally and the great quality of new products and features it provides subscribers with, leading to its great financial performance in the past few quarters, the share price of the company has been very bullish since the 3rd quarter of 2019. The stock was trading at only $253 in the end of September 2019 when the company beat analysts’ expectations for the 3rd quarter of last year and delivered better than expected earnings for the quarter, which immediately led to a huge buying interest among investors who started pushing the stock higher. The price started heading higher and formed a very strong bullish trend that lasted until the beginning of March 2020 where the stock reached its peak for the year at $392. Yet, due to the coronavirus pandemic and the huge sell-off across the stock market all around the world, Netflix’s stock depreciated as well, reaching the lows at $291 two weeks later.
Yet, as we have mentioned earlier, the social distancing and the fact that people have been staying at home have given investors a signal that the correction back then was a great buying opportunity, giving them a chance to boost their profitability to the upside, considering the great financial performance of the stock and the even stronger expectations for the 1st quarter earnings report. Thus, investors started buying aggressively and that led to a massive bullish rally in the past 1.5 months, sending the price from $291 to $450. In fact, this was a new all-time high, since the previous record was reached back in 2018 when the stock reached its peak at $420.
Since the company reached its new record high on the stock on the 20th of April we have seen a bit of profit-taking interest, which has ultimately sent the price down towards the key support at $394-$400 where investors started buying again earlier today, thus pushing it back up towards the current $419 level.
After analyzing all the above-mentioned factors and the huge financial success of the company, we believe in the longer-term success of the company and would like to add Netflix to our portfolio. Therefore, we need to decide at what price we would like to buy the stock in order to maximize our followers’ profitability to the upside. Moreover, we are taking into consideration that the situation with the coronavirus has started improving and countries are slowly getting out of the recent lockdown, which would also motivate investors to seek great buying opportunities on leading stocks, such as Netflix.
Going back to our previous point, the daily chart shows the key psychological support at $394-$400, which used to be a strong resistance level that was broken in the middle of April during the huge buying activity on the stock, where investors pushed it towards the new record of $450.
As soon as investors started cashing in some profits and the price reached the lows at $394-$400 there was a lack of further selling activity and that could easily be seen on the chart, which shows that as soon as the price reached the $400 support investors started buying again, taking advantage of the short-term profit-taking correction and sending the price towards the $419 already.
In fact, the middle Bollinger band line matches with the key support at $400, while the RSI is still heading higher at the current levels at 55. The Stochastics indicator has already crossed down in the overbought territory during the recent correction that has taken place and is now close to reaching the oversold area where it will be giving further bullish indications as well. Furthermore, the Fibonacci retracement at 38.20% matches perfectly with the support at $400, giving a further buying indication at that key psychological support level.
As you know, our correlation-confirmation model gives us a chance to identify great market movements and therefore be able to maximize our profitability on different stocks. Yet, before we buy the stock we need to get a confirmation from some of the biggest ETFs and make sure they confirm our bullish stance on the stock.
You can find our full correlation confirmation analysis if you follow us everywhere!
Therefore, the current price movement on both XLY and SPY confirm our bullish stance on the Netflix stock and give us a further indication that buying the stock at the strong psychological level at $395-$400 would give us a chance to make high profits to the upside. Therefore, considering that Netflix is currently standing at $419 we would prefer to wait for a short-term profit taking correction towards the support at $400 where we will start buying the stock aggressively. In case the price makes a further drop we will be interested in adding more to our buy positions at the next strong support mark currently standing at $380, which will give us a chance to improve our average cost basis and maximize our profitability to the upside.
We will be looking to cash in some of our profits when the price reaches our first target at $420, followed by the longer term target at $450-$460 where we will be fully cashing in our profits and waiting for another correction that would give us a chance to buy again and boost our followers’ profits again.
Tesla Inc.: A strong BUY on any short-term declinesThe technical chart of the stock shows a remarkably volatile price action in the last 10 trading weeks with huge appreciations and even steeper declines. Tesla’s stock has always been considered as a rather speculative play for growth oriented investors, thus people who are familiar with the stock are no strangers to volatility. However, the moves that we have observed recently have really set some records for the stock.
After the company announced its 2nd consecutive earnings beat back on January 29th with its Q4 2019 earnings report and also gave an upbeat future guidance for 2020, the stock skyrocketed from $600 to $967 in two trading sessions. Soon after that astronomical 61% gain the stock started retracing and dropped to the $690-750 levels at the end of February, and looked quite comfortable there. However, the stock was then dragged lower with the rest of the market in March as a result of the global pandemic COVID-19 outbreak. The stock broke the initial horizontal support lying at $686, the secondary support at $542 and then proceeded its decline through the $455 tertiary support level to only stop at the 200-day moving average at the $350-360 zone. The company’s market capitalization lost 63% of its value in 4 weeks.
We are long-term buyers of Tesla’s stock as a result of the great fundamental positioning that the company has, as we believe that it is poised to benefit from the accelerated demand for the company’s products in the coming years. Additionally, the fact that the company has finally managed to become profitable and is now consistently delivering strong financial results is another great indication for the bright future ahead for the stock. However, following our cross-sector, multi-layered confirmation correlation model we have concluded that Tesla Inc. (TSLA) will give our followers a better entry point for them to open their long-term buy positions in the stock, in the next few weeks.
Thus, we would be interested in buying the stock on any pullback towards the $686 support level and will look to further add to our exposure to the stock in case the price revisits the next support zone around the $542. Our mid-term targets will be placed at the $890 and $995 marks respectively, with our extended long-term take profit levels positioned at the $1150 and $1220 per share.
For more trading ideas and analyses you can follow us everywhere!
Sincerely,
DowExperts
