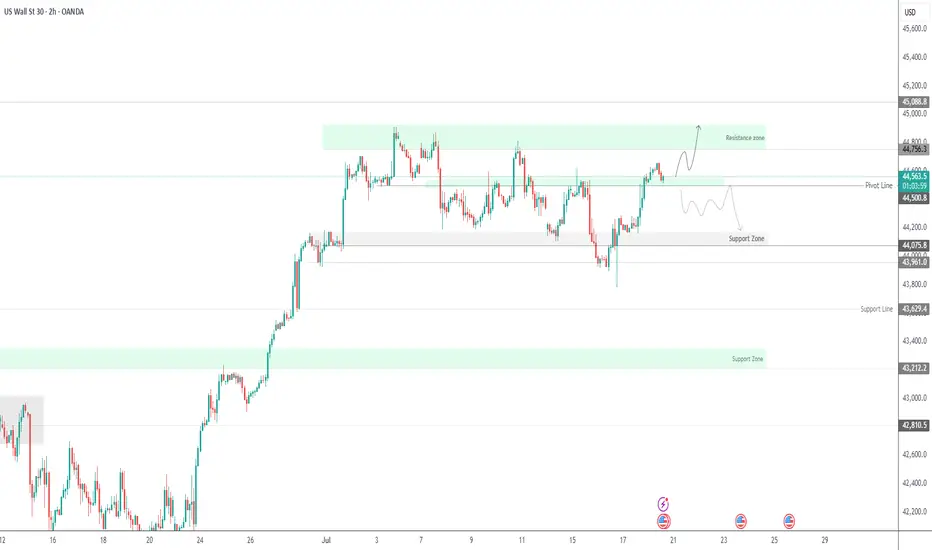
US30 Massive Bullish Breakout!
HI,Traders !
#US30 is trading in a strong
Uptrend and the price just
Made a massive bullish
Breakout of the falling
Resistance line and the
Breakout is confirmed
So after a potential pullback
We will be expecting a
Further bullish continuation !
Comment and subscribe to help us grow !
Dowjones

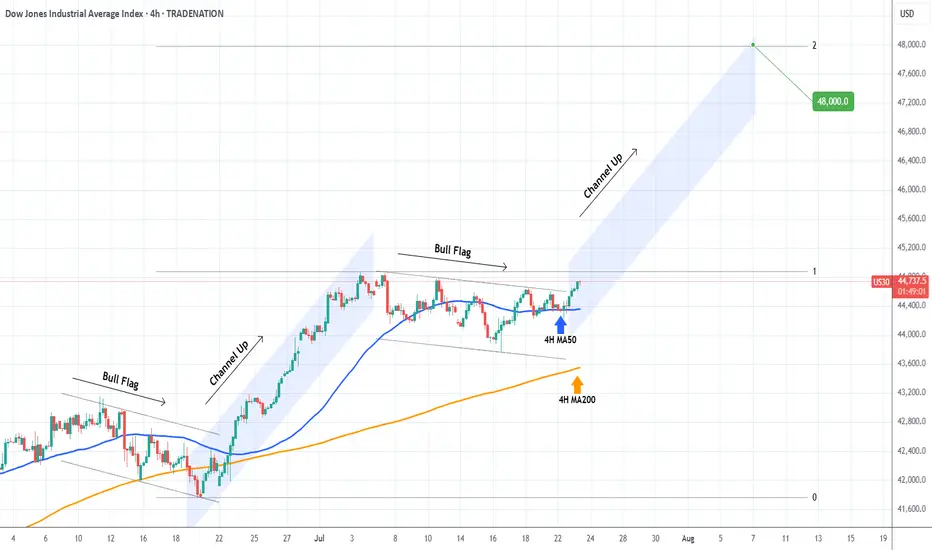
DOW JONES Strong rebound on its 4H MA50.Dow Jones (DJI) is having a strong rebound exactly on its 4H MA50 (blue trend-line). This is taking place just after the price broke above the Bull Flag that served as the accumulation pattern following the previous Channel Up.
This is a repetitive pattern and most likely we will now see the new Channel Up starting. The technical Target on such formations is the 2.0 Fibonacci extension at 48000.
-------------------------------------------------------------------------------
** Please LIKE 👍, FOLLOW ✅, SHARE 🙌 and COMMENT ✍ if you enjoy this idea! Also share your ideas and charts in the comments section below! This is best way to keep it relevant, support us, keep the content here free and allow the idea to reach as many people as possible. **
-------------------------------------------------------------------------------
Disclosure: I am part of Trade Nation's Influencer program and receive a monthly fee for using their TradingView charts in my analysis.
💸💸💸💸💸💸
👇 👇 👇 👇 👇 👇
Dow Set for Volatile Move as Earnings, Tariff Risks CollideUS30 OVERVIEW
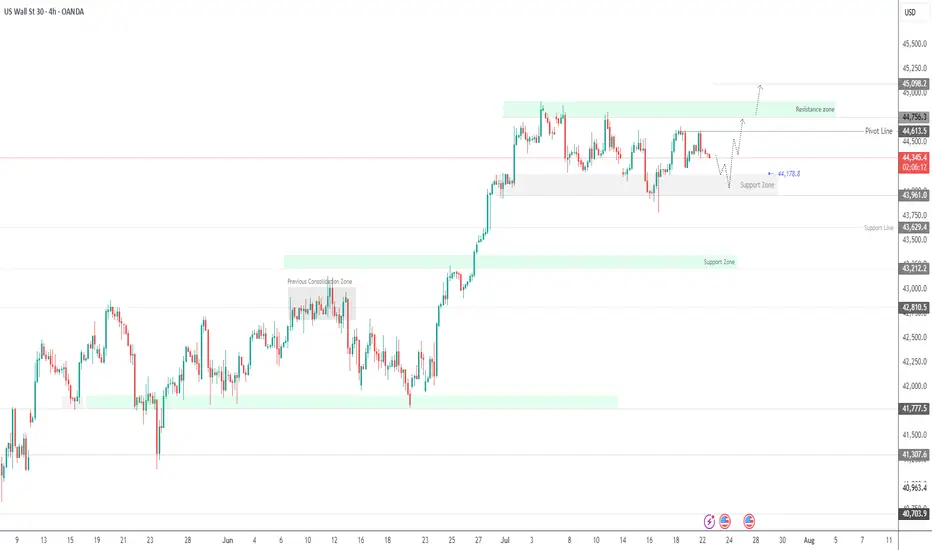
The price is currently consolidating between 44,180 and 44,620, awaiting a catalyst. Today’s earnings reports are expected to heavily influence Dow Jones price action.
If earnings come in strong, the index is likely to push toward 44,620 and 44,760. A confirmed stability above 44,620 would strengthen the bullish case, potentially opening the path toward a new all-time high near 45,100.
However, a break below 44,180 would signal bearish momentum, with potential downside toward 43,960. Additional pressure could come from escalating tariff tensions, further weakening sentiment.
Resistance: 44,620 · 44,760 · 45,100
Support: 44,180 · 43,960 · 43,630
US30 Dow Jones New All Time HIGHMost people over complicate things, mostly the idea is right in front of you yet most don't believe in what they trade; simple bull flag, simple new ATH, that's it. believe it.
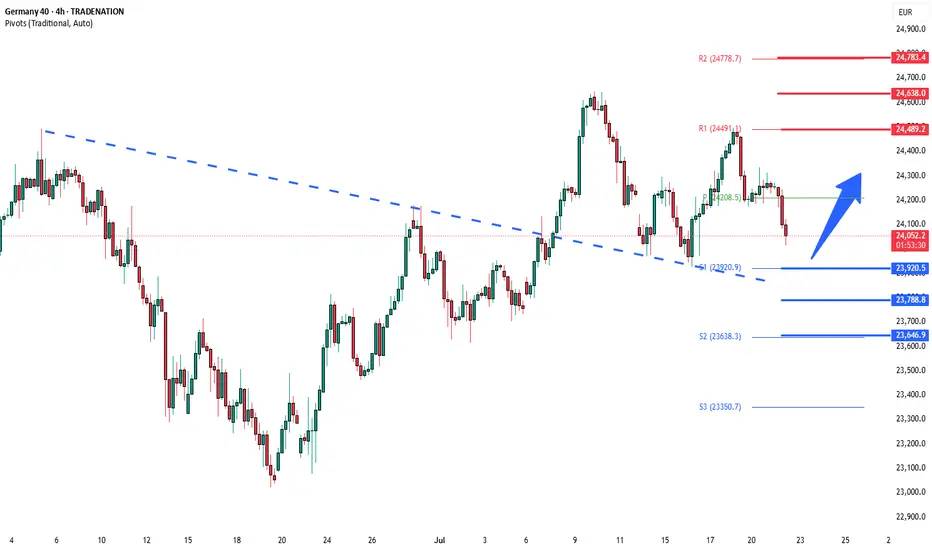
DowJones corrective pullback supported at 23920Key Support and Resistance Levels
Resistance Level 1: 24490
Resistance Level 2: 24640
Resistance Level 3: 24780
Support Level 1: 23920
Support Level 2: 23790
Support Level 3: 23646
This communication is for informational purposes only and should not be viewed as any form of recommendation as to a particular course of action or as investment advice. It is not intended as an offer or solicitation for the purchase or sale of any financial instrument or as an official confirmation of any transaction. Opinions, estimates and assumptions expressed herein are made as of the date of this communication and are subject to change without notice. This communication has been prepared based upon information, including market prices, data and other information, believed to be reliable; however, Trade Nation does not warrant its completeness or accuracy. All market prices and market data contained in or attached to this communication are indicative and subject to change without notice.
NQ thread: Short ideaMonday started off bullish, but only to drop at the end of the session.
Here is a thread on what is happening and on which narratives I view the market
Starting off with the 4H Time frame, we witnessed NQ and ES taking last weeks high.
YM did not.
This is the first stage of the movement. To find the second stage, we need to dive deeper into the lower timeframes..

Dow Jones is Nearing an Important Support!!Hey Traders, in today's trading session we are monitoring US30 for a buying opportunity around 43,950 zone, Dow Jones is trading in an uptrend and currently is in a correction phase in which it is approaching the trend at 43,950 support and resistance area.
Trade safe, Joe.

Dow Jones -> A breakout rally of +40%!🐂Dow Jones ( TVC:DJI ) will create new highs:
🔎Analysis summary:
Since the April lows, the Dow Jones already rallied about +25%. This was simply the expected rejection away from a strong confluence of support. Now, the Dow Jones is sitting at the previous all time highs and about to break out, leading to a massive rally.
📝Levels to watch:
$45.000, $60.000
🙏🏻#LONGTERMVISION
Philip - Swing Trader

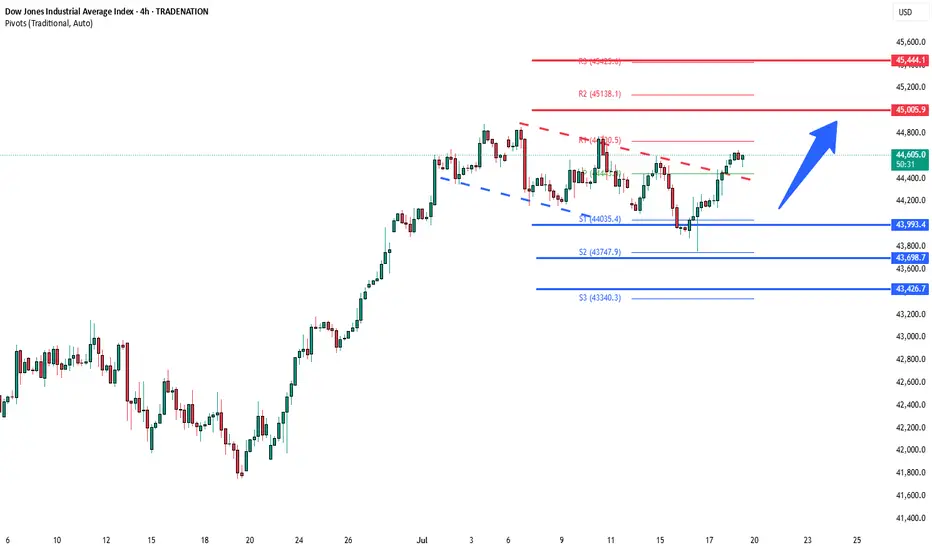
DowJones bullish continuation breakout support at 43990Key Support and Resistance Levels
Resistance Level 1: 45000
Resistance Level 2: 45440
Resistance Level 3: 46000
Support Level 1: 43990
Support Level 2: 43700
Support Level 3: 43420
This communication is for informational purposes only and should not be viewed as any form of recommendation as to a particular course of action or as investment advice. It is not intended as an offer or solicitation for the purchase or sale of any financial instrument or as an official confirmation of any transaction. Opinions, estimates and assumptions expressed herein are made as of the date of this communication and are subject to change without notice. This communication has been prepared based upon information, including market prices, data and other information, believed to be reliable; however, Trade Nation does not warrant its completeness or accuracy. All market prices and market data contained in or attached to this communication are indicative and subject to change without notice.
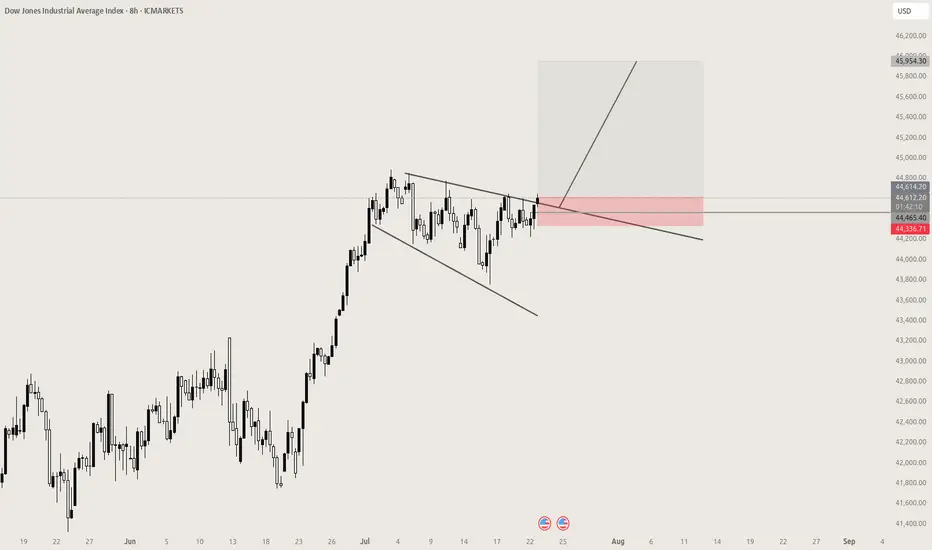
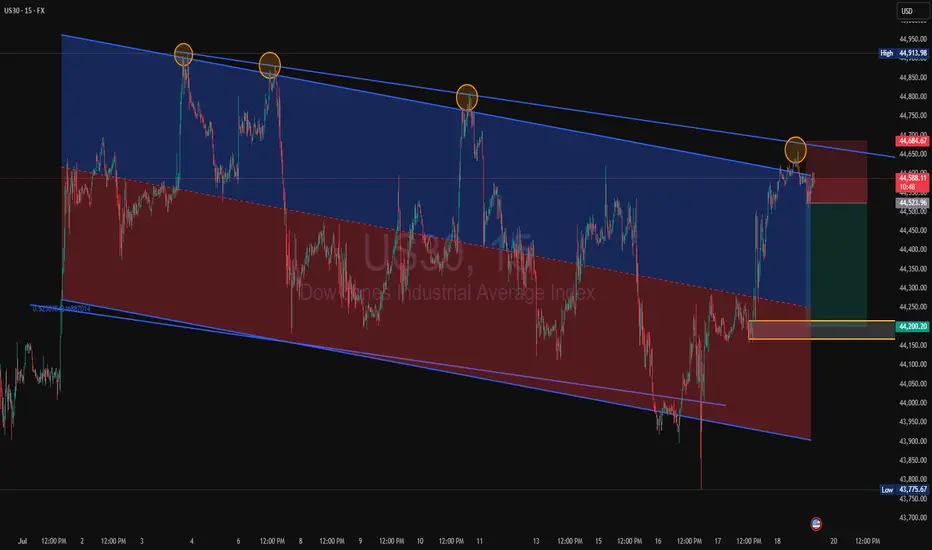
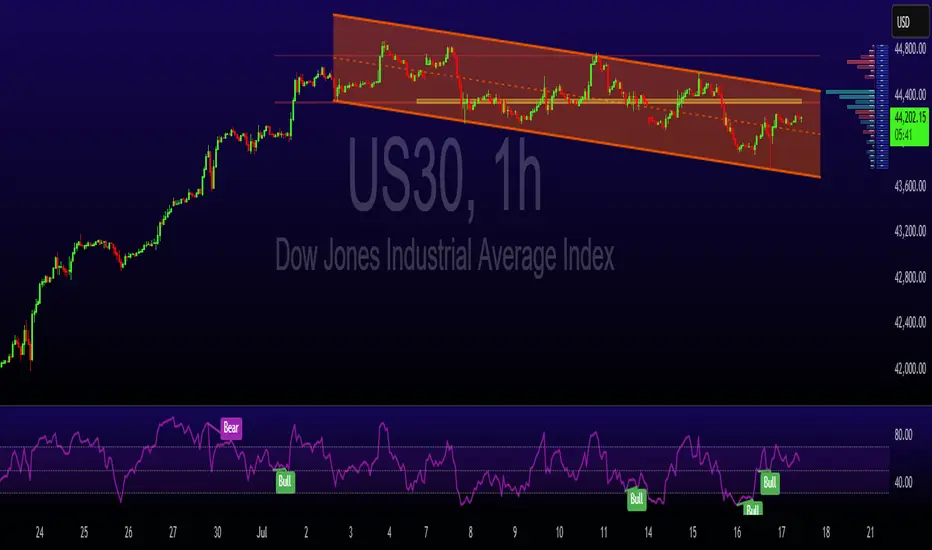
US30 Rejection at Channel Resistance US30 is showing a repeated pattern of rejection at the upper boundary of the descending channel. Price has now tapped this trendline for the fourth time, forming a consistent bearish structure.
Price rejected again at the top of the descending channel (marked by orange circles)
Clear sell setup with stop above the most recent swing high, targeting the lower channel boundary around 44,200, aligning with past demand.
Short below 44,685
Target: 44,200
Stop: Above recent highs near 44,913
Risk/Reward: Favourable if structure holds. If this pattern plays out as before, we can expect another push to the downside within the channel.
A break and retest of the midline could add extra confirmation.
#US30 #DowJones #PriceAction #SellSetup #BearishRejection #ChannelTrading #TechnicalAnalysis
US30 Holds Above 44500 – Bullish Momentum in PlayUS30 | Technical Overview
The price action continues to reflect a bullish bias, supported by strong earnings reports and solid U.S. economic data. As long as the index trades above 44500, the upward momentum is expected to continue.
Technical Outlook:
Price remains bullish above 44500, with upside targets at 44640 and 44760.
A confirmed 1H close below 44500 would shift momentum to the downside, exposing support levels at 44350 and 44215.
Key Levels:
• Pivot: 44500
• Resistance: 44640 / 44760 / 44920
• Support: 44350 / 44215 / 44075
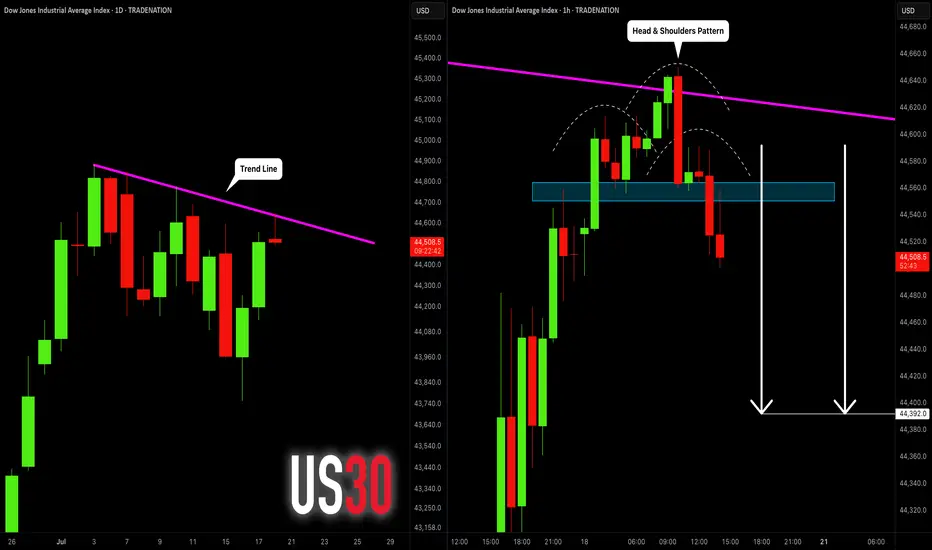
DOW JONES INDEX (US30): Bearish Move From Trend Line
I see a test of a strong trend line on US30.
The price formed a head & shoulders pattern on that
and a breakout of its neckline on an hourly time frame.
I expect a retracement to 48390
❤️Please, support my work with like, thank you!❤️
I am part of Trade Nation's Influencer program and receive a monthly fee for using their TradingView charts in my analysis.
Quick take on DJIACurrently, the Dow Jones Industrial Average TVC:DJI is trading within a short-term downside channel. However, could it just be part of a correction, before another possible leg of buying? Let's dig in.
MARKETSCOM:US30
Let us know what you think in the comments below.
Thank you.
75.2% of retail investor accounts lose money when trading CFDs with this provider. You should consider whether you understand how CFDs work and whether you can afford to take the high risk of losing your money. Past performance is not necessarily indicative of future results. The value of investments may fall as well as rise and the investor may not get back the amount initially invested. This content is not intended for nor applicable to residents of the UK. Cryptocurrency CFDs and spread bets are restricted in the UK for all retail clients.

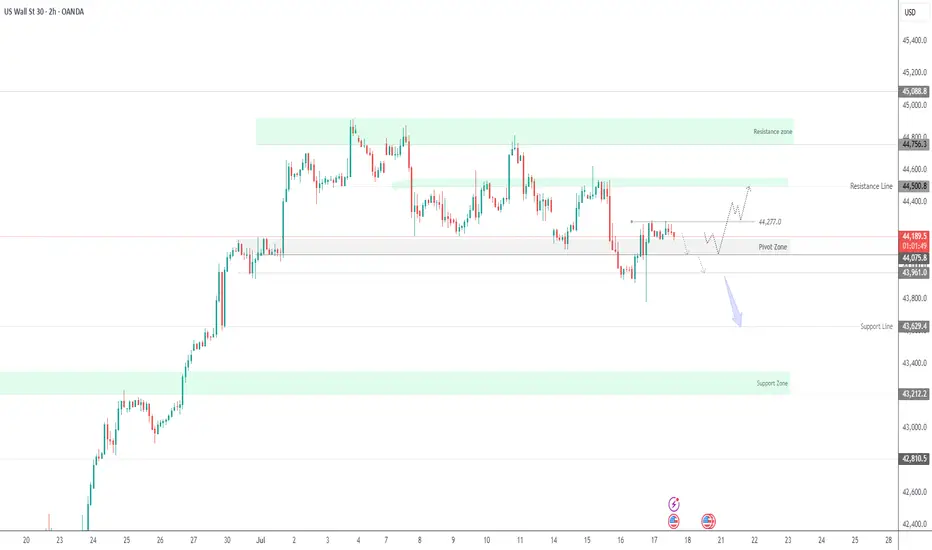
US30 | Bearish Pressure Builds Below 44,170 — Breakout or BounceUS30: Eyes on Earnings and News
US stocks edged higher pre-market after Trump denied plans to fire Fed Chair Powell, easing market concerns. With corporate earnings in focus, sentiment remains cautiously optimistic.
Technical View:
The price holds bullish momentum above 44170, targeting 44280 and 44500.
A 1H close below 44170 may lead to a drop toward 44075, and breaking below that would open the path to 43960 and 43630.
A 1H close above 44280 strengthens the bullish case toward 44500.
Key Levels:
Resistance: 44280, 44410, 44500
Support: 44075, 43960, 43630
previous idea:
Bulls Steady Ahead of Key Earnings and Economic DataU.S. equities are holding steady in what has been a week of conflicting signals. President Trump’s aggressive stance on trade, including potential 30% tariffs on EU and Mexican goods, has shaken market sentiment, but his public commitment to retain Jerome Powell as Fed Chair brought some temporary relief. That stability, at least for now, is helping underpin stock indices.
Focus has now turned to corporate earnings, with key players like TSMC and Netflix reporting shortly. These names could set the tone for the broader Q2 earnings season. At the same time, traders are closely monitoring incoming U.S. data — including retail sales and jobless claims — to gauge the health of the consumer and labor market. The combination of strong earnings and resilient macro data could provide the momentum
Technical Structure:
• Resistance: 44,350 — a potential breakout point
• Support: 44,000 and 43,800
• Pattern: The index is trading within a descending channel, but recent strength suggests a breakout may be developing.
• Upside potential: If earnings and macro data support risk appetite, a breakout toward 44,800 becomes plausible.
Takeaway: Sentiment remains fragile but stable. Traders should keep a close eye on both corporate results and macro data releases for direction cues.
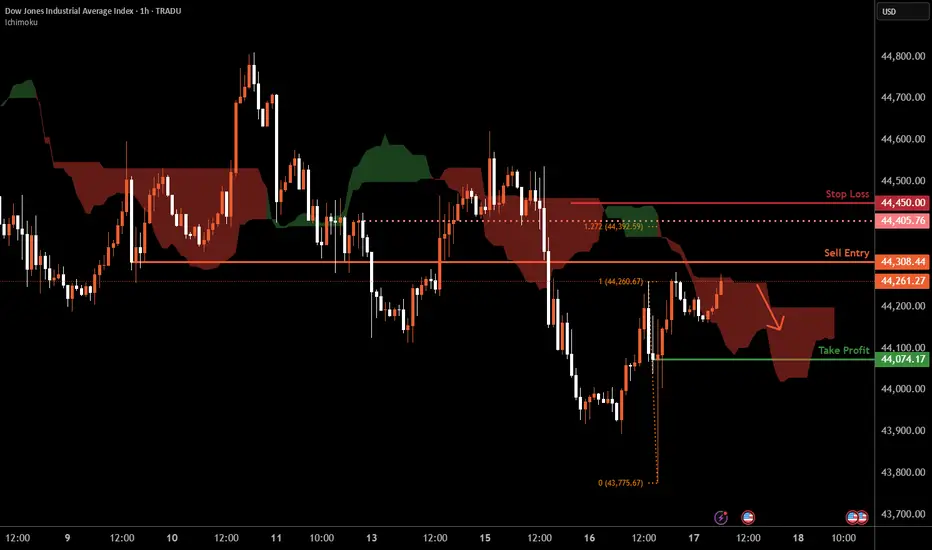
Dow Jones H1 | Approaching a pullback resistanceThe Dow Jones (US30) is rising towards a pullback resistance and could potentially reverse off this level to drop lower.
Sell entry is at 44,308.44 which is a pullback resistance.
Stop loss is at 44,450.00 which is a level that sits above an overlap resistance and the 127.2% Fibonacci extension.
Take profit is at 44,074.17 which is a swing-low support.
High Risk Investment Warning
Trading Forex/CFDs on margin carries a high level of risk and may not be suitable for all investors. Leverage can work against you.
Stratos Markets Limited (tradu.com ):
CFDs are complex instruments and come with a high risk of losing money rapidly due to leverage. 66% of retail investor accounts lose money when trading CFDs with this provider. You should consider whether you understand how CFDs work and whether you can afford to take the high risk of losing your money.
Stratos Europe Ltd (tradu.com ):
CFDs are complex instruments and come with a high risk of losing money rapidly due to leverage. 66% of retail investor accounts lose money when trading CFDs with this provider. You should consider whether you understand how CFDs work and whether you can afford to take the high risk of losing your money.
Stratos Global LLC (tradu.com ):
Losses can exceed deposits.
Please be advised that the information presented on TradingView is provided to Tradu (‘Company’, ‘we’) by a third-party provider (‘TFA Global Pte Ltd’). Please be reminded that you are solely responsible for the trading decisions on your account. There is a very high degree of risk involved in trading. Any information and/or content is intended entirely for research, educational and informational purposes only and does not constitute investment or consultation advice or investment strategy. The information is not tailored to the investment needs of any specific person and therefore does not involve a consideration of any of the investment objectives, financial situation or needs of any viewer that may receive it. Kindly also note that past performance is not a reliable indicator of future results. Actual results may differ materially from those anticipated in forward-looking or past performance statements. We assume no liability as to the accuracy or completeness of any of the information and/or content provided herein and the Company cannot be held responsible for any omission, mistake nor for any loss or damage including without limitation to any loss of profit which may arise from reliance on any information supplied by TFA Global Pte Ltd.
The speaker(s) is neither an employee, agent nor representative of Tradu and is therefore acting independently. The opinions given are their own, constitute general market commentary, and do not constitute the opinion or advice of Tradu or any form of personal or investment advice. Tradu neither endorses nor guarantees offerings of third-party speakers, nor is Tradu responsible for the content, veracity or opinions of third-party speakers, presenters or participants.
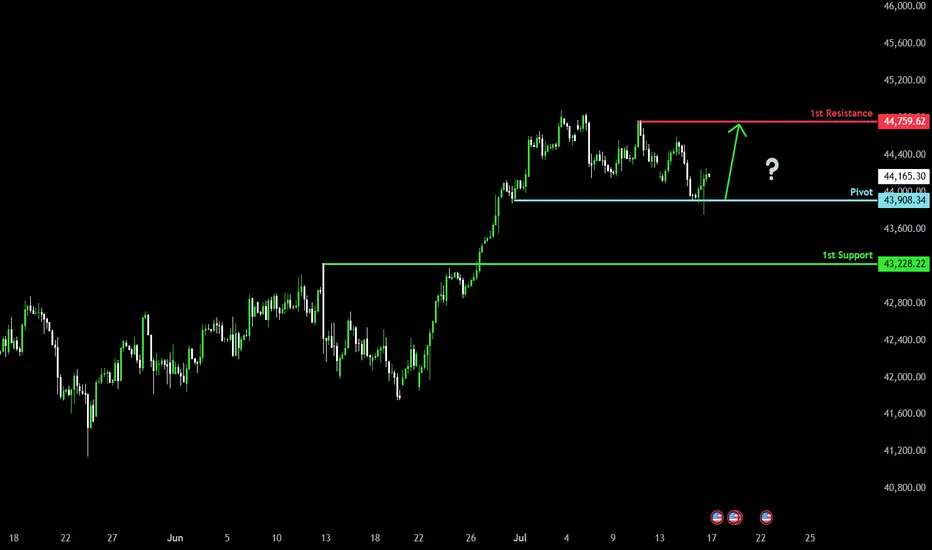
Could the price rise from here?Dow Jones (US30) has bounced off the pivot and could potentially rise to the 1st resistance which acts as a pullback resistance.
Pivot: 43,908.34
1st Support: 43,228.22
1st Resistance: 44,759.62
Risk Warning:
Trading Forex and CFDs carries a high level of risk to your capital and you should only trade with money you can afford to lose. Trading Forex and CFDs may not be suitable for all investors, so please ensure that you fully understand the risks involved and seek independent advice if necessary.
Disclaimer:
The above opinions given constitute general market commentary, and do not constitute the opinion or advice of IC Markets or any form of personal or investment advice.
Any opinions, news, research, analyses, prices, other information, or links to third-party sites contained on this website are provided on an "as-is" basis, are intended only to be informative, is not an advice nor a recommendation, nor research, or a record of our trading prices, or an offer of, or solicitation for a transaction in any financial instrument and thus should not be treated as such. The information provided does not involve any specific investment objectives, financial situation and needs of any specific person who may receive it. Please be aware, that past performance is not a reliable indicator of future performance and/or results. Past Performance or Forward-looking scenarios based upon the reasonable beliefs of the third-party provider are not a guarantee of future performance. Actual results may differ materially from those anticipated in forward-looking or past performance statements. IC Markets makes no representation or warranty and assumes no liability as to the accuracy or completeness of the information provided, nor any loss arising from any investment based on a recommendation, forecast or any information supplied by any third-party.
US30 DOW BULLISH ANALYSIS Triple tops are the next liquidity targets from a fvg support as shown. the tops are week as we have seen NASDAQ and S&P500 hav3 liquidated their highs its. Lear US30 is following the same path.
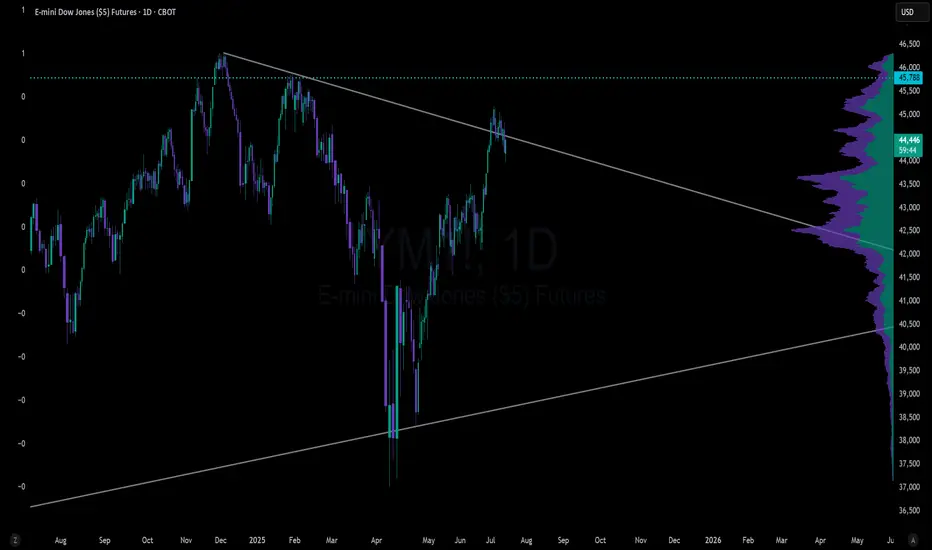
Here we go againDow Futures false breakout to the upside and now downside. Expect volatile price moves into 2026
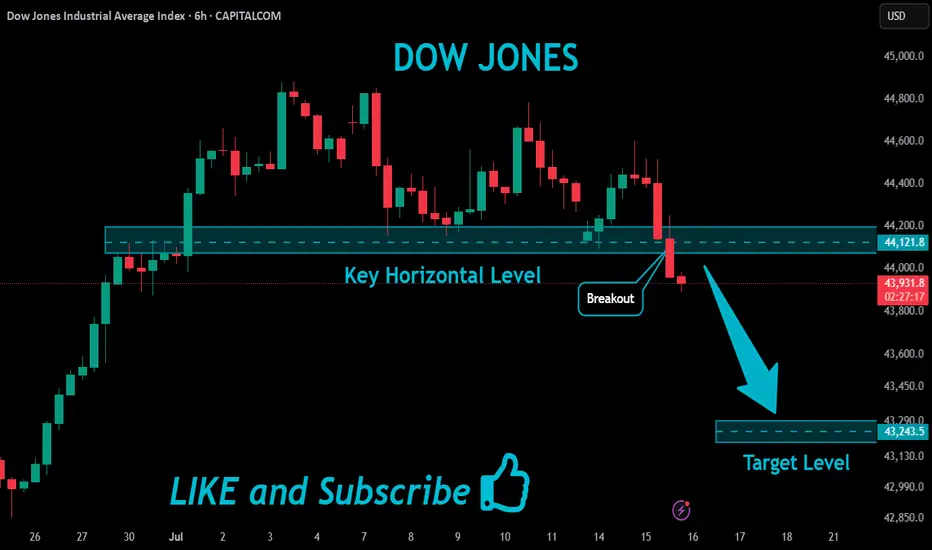
US30 Bearish Breakout!
HI,Traders !
#US30 index is trading in a strong downtrend,
and has broken through the key horizontal
level at 44121.8, reinforcing our bearish
outlook. We expect further declines !
Comment and subscribe to help us grow !
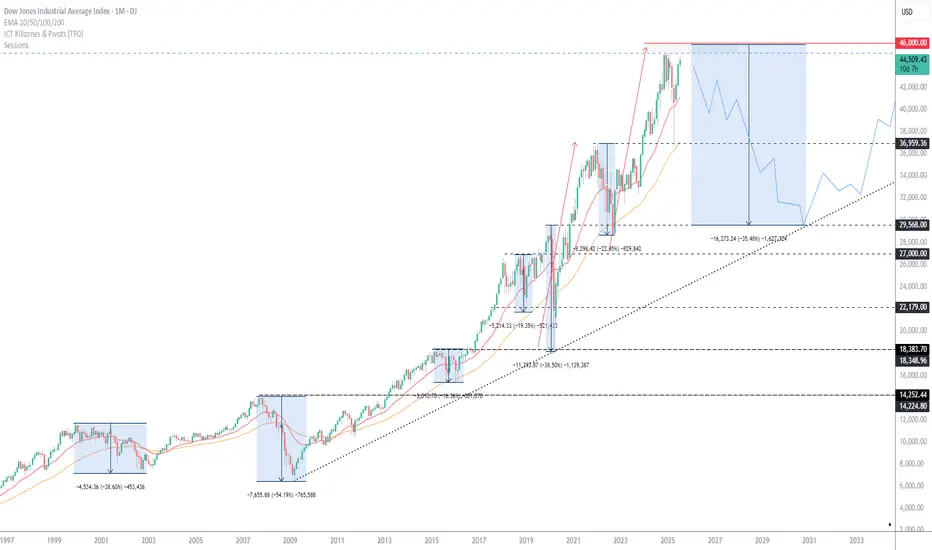
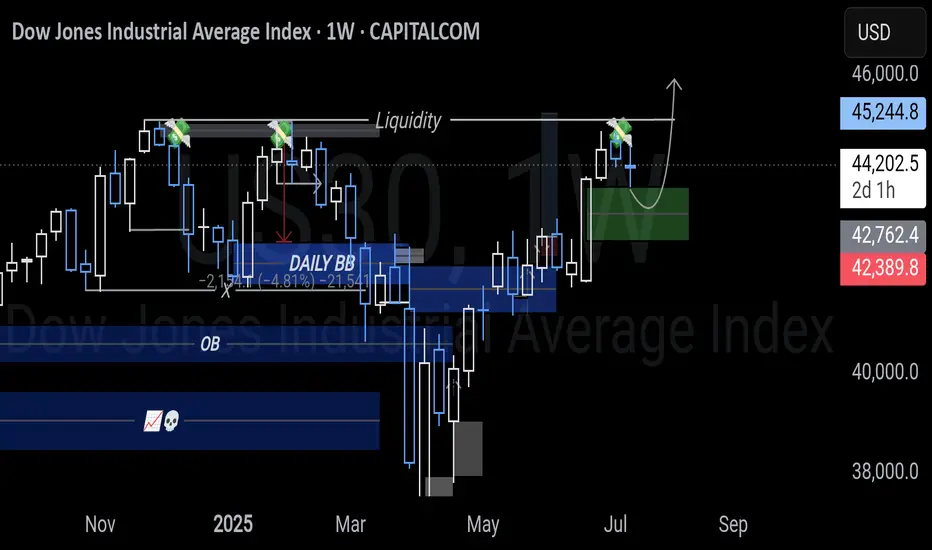
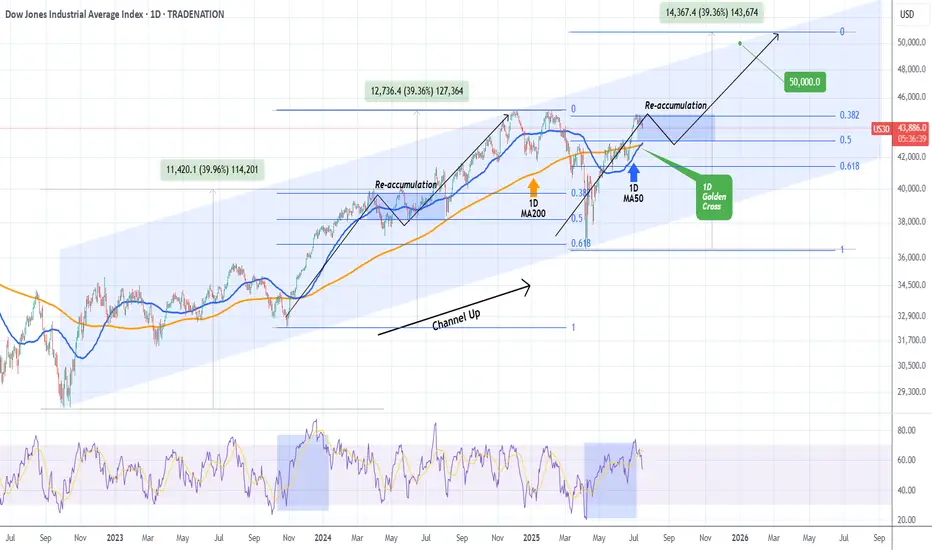
DOW JONES formed 1st 1D Golden Cross since 2022!Dow Jones (DJIA) completed on Monday its 1st Golden Cross on the 1D time-frame since December 12 2022! This powerful bullish pattern comes with the price close to its All Time High (ATH).
Being inside almost a 3-year Channel Up, the current rise is the pattern's latest Bullish Leg following the April 07 2025 bottom (Higher Low). Both previous Bullish Legs rose by +39.96% before forming a Higher High.
Based on the Fibonacci retracement levels, last time the previous Bullish Leg was within the 0.382 - 0.5 Fibonacci Zone, it formed a Re-accumulation Phase for 3 months. As a result, we shouldn't dismiss the fact of trading sideways for the rest of the Summer and then picking up the pace. Our end-of-year Target remains 50000.
-------------------------------------------------------------------------------
** Please LIKE 👍, FOLLOW ✅, SHARE 🙌 and COMMENT ✍ if you enjoy this idea! Also share your ideas and charts in the comments section below! This is best way to keep it relevant, support us, keep the content here free and allow the idea to reach as many people as possible. **
-------------------------------------------------------------------------------
Disclosure: I am part of Trade Nation's Influencer program and receive a monthly fee for using their TradingView charts in my analysis.
💸💸💸💸💸💸
👇 👇 👇 👇 👇 👇
Market Mood Sours as Inflation Surprises AgainU.S. stock markets were under pressure on Tuesday after new inflation data came in higher than expected. This has made investors rethink how soon the Federal Reserve might cut interest rates.
What Happened?
● The Consumer Price Index (CPI) recorded its biggest monthly rise in 5 months.
● Core inflation (which excludes food and energy) jumped by 2.9% compared to last year — more than the Fed's 2% target.
What It Means
● Investors had expected the Fed to cut interest rates multiple times in 2025.
● After the inflation report, they now think the Fed will cut less than expected.
● The chances of a rate cut in September also dropped sharply.
Market Impact
● Bond yields went up — the 10-year U.S. government bond yield rose to 4.49%, making borrowing more expensive.
● Stock futures fell (Dow, S&P 500, Nasdaq), as higher yields tend to hurt company profits and stock prices.
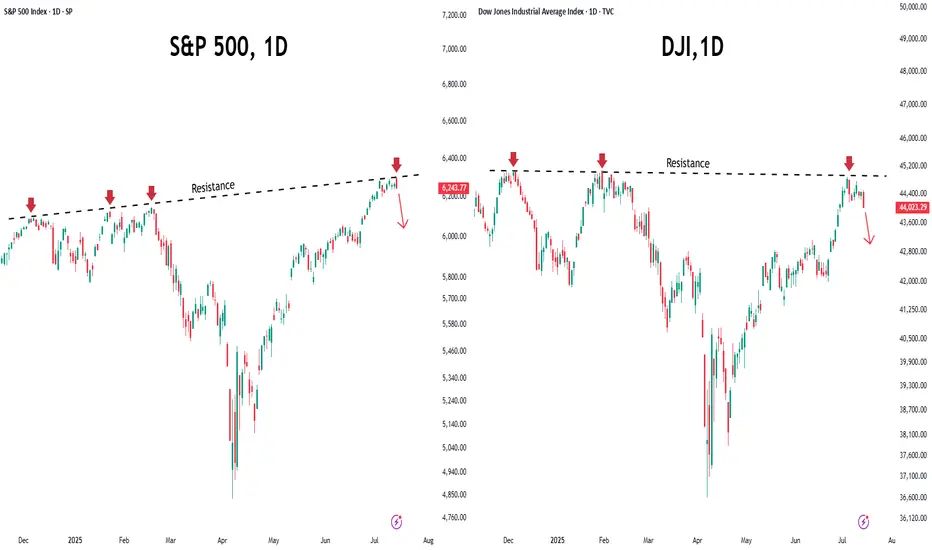
S&P 500 and Dow Struggle at Resistance
● Both the S&P 500 and Dow Jones faced resistance near all-time highs.
● This rejection suggests potential for further short-term pullback, especially if macro pressures like inflation and rate uncertainty persist.
Near-Term Outlook
With inflation running hotter than expected, hopes for early Fed rate cuts have cooled. Traders and investors should remain cautious, manage risk actively, and prepare for continued volatility in the coming weeks.