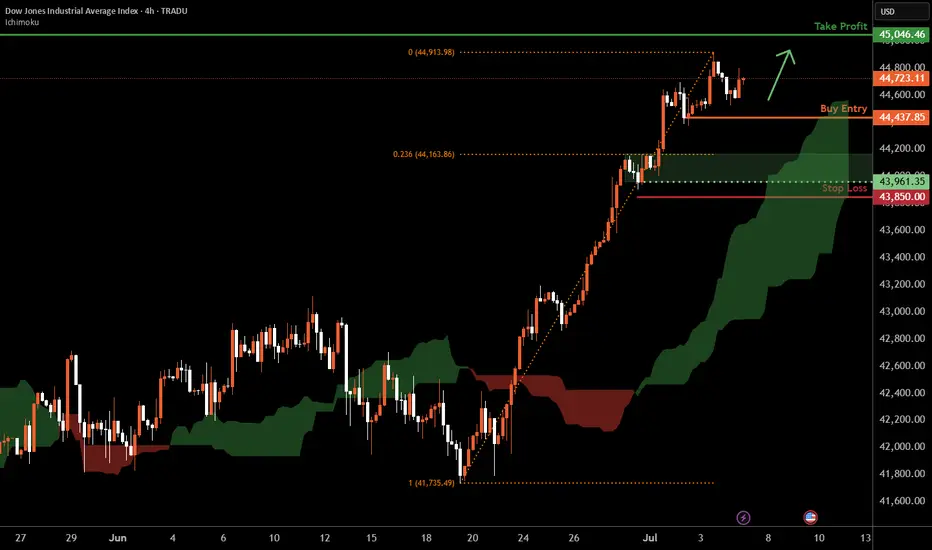
Dow Jones H4 | Bullish uptrend to extend higher?The Dow Jones 30 (US30) could fall towards a swing-low support and could potentially bounce off this level to climb higher.
Buy entry is at 44,437.85 which is a swing-low support.
Stop loss is at 43,850.00 which is a level that lies underneath a swing-low support and the 23.6% Fibonacci retracement.
Take profit is at 45,046.46 which is a multi-swing-high resistance.
High Risk Investment Warning
Trading Forex/CFDs on margin carries a high level of risk and may not be suitable for all investors. Leverage can work against you.
Stratos Markets Limited (tradu.com ):
CFDs are complex instruments and come with a high risk of losing money rapidly due to leverage. 63% of retail investor accounts lose money when trading CFDs with this provider. You should consider whether you understand how CFDs work and whether you can afford to take the high risk of losing your money.
Stratos Europe Ltd (tradu.com ):
CFDs are complex instruments and come with a high risk of losing money rapidly due to leverage. 63% of retail investor accounts lose money when trading CFDs with this provider. You should consider whether you understand how CFDs work and whether you can afford to take the high risk of losing your money.
Stratos Global LLC (tradu.com ):
Losses can exceed deposits.
Please be advised that the information presented on TradingView is provided to Tradu (‘Company’, ‘we’) by a third-party provider (‘TFA Global Pte Ltd’). Please be reminded that you are solely responsible for the trading decisions on your account. There is a very high degree of risk involved in trading. Any information and/or content is intended entirely for research, educational and informational purposes only and does not constitute investment or consultation advice or investment strategy. The information is not tailored to the investment needs of any specific person and therefore does not involve a consideration of any of the investment objectives, financial situation or needs of any viewer that may receive it. Kindly also note that past performance is not a reliable indicator of future results. Actual results may differ materially from those anticipated in forward-looking or past performance statements. We assume no liability as to the accuracy or completeness of any of the information and/or content provided herein and the Company cannot be held responsible for any omission, mistake nor for any loss or damage including without limitation to any loss of profit which may arise from reliance on any information supplied by TFA Global Pte Ltd.
The speaker(s) is neither an employee, agent nor representative of Tradu and is therefore acting independently. The opinions given are their own, constitute general market commentary, and do not constitute the opinion or advice of Tradu or any form of personal or investment advice. Tradu neither endorses nor guarantees offerings of third-party speakers, nor is Tradu responsible for the content, veracity or opinions of third-party speakers, presenters or participants.
Dowjones
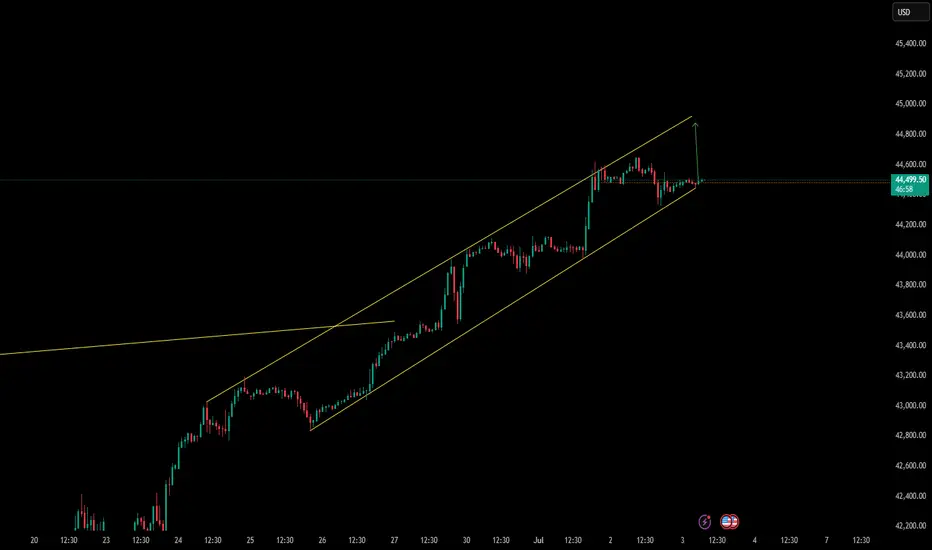
US30 LONG There's still bullish momentum on US30. Price has done third touch on US30, it printed a strong bullish signal for another bullish push, potentially to 45,000 psychological level.
DOW Jones go upCMCMARKETS:US30
Reaching the price level of 45,082.74 is inevitable. From the current closing price, there is a high probability of continuation toward the ATH.
However, the price levels 44,440 and 44,344.95 are also acceptable zones from which the move toward 45,082.74 may begin.
At the start of the upcoming week, as soon as the market opens, we are likely to move toward the ATH from one of these three levels.

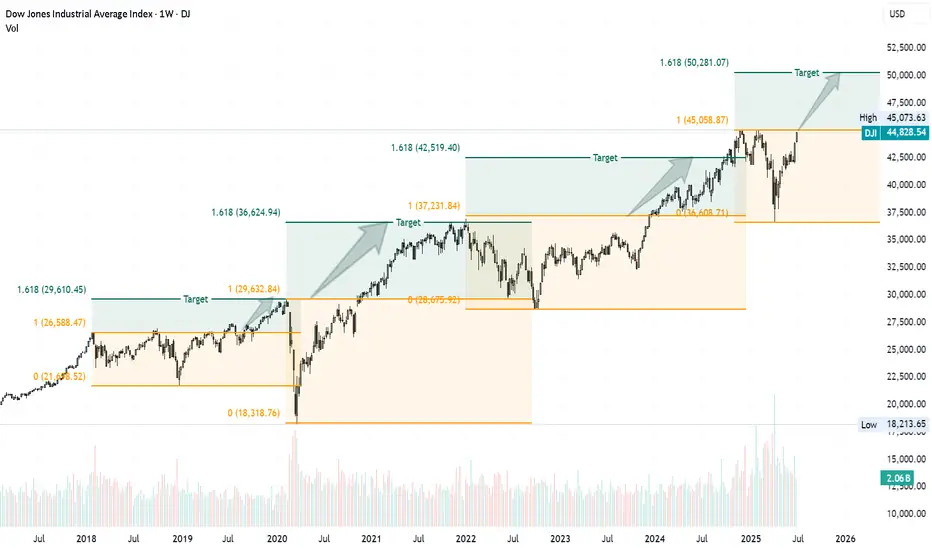
Dow Could Be Gearing Up for a Run Toward 50,000We’ve seen it before—and we might be seeing it again . The Dow Jones is showing a familiar pattern, and here’s what’s happening:
The index has been repeatedly hitting the 1.618 Fibonacci extension from previous ranges.
Right now, we’re approaching the 100% extension between the last swing high (~45,000) and swing low (~36,600).
If the Dow breaks above that previous high at 45,000, there's a good chance we’ll see the pattern repeat—with 50,000 as the next target.
It’s all about that breakout confirmation. Until then, we watch and wait.
This market has a memory—let’s see if it chooses to repeat it again.
Dow Jones (DJI) Logarithmic Macro Outlook Log target: 48k
The dotted red line is adjusted for inflation. The stock market cycles are lengthening. Continued downside till EOM followed by a final melt-up rally that will bring the end of grand wave 5.
ETA: Q1 '23.

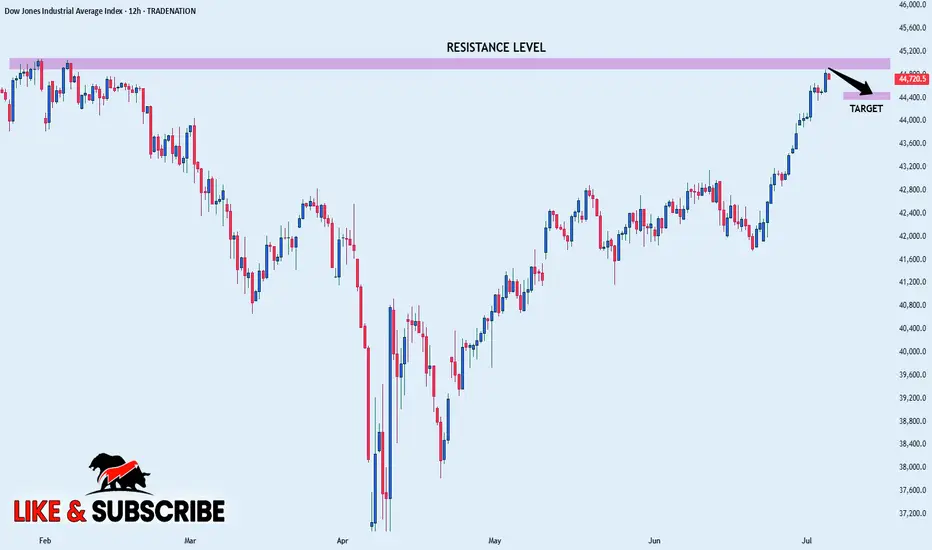
US30 SHORT FROM RESISTANCE|
✅DOW JONES is going up now
But a strong resistance level is ahead at 45,077
Thus I am expecting a pullback
And a move down towards the target of 44,500
SHORT🔥
✅Like and subscribe to never miss a new idea!✅
Disclosure: I am part of Trade Nation's Influencer program and receive a monthly fee for using their TradingView charts in my analysis.
US30 Potential UpsidesHey Traders, in today's trading session we are monitoring US30 for a buying opportunity around 44,230 zone, Dow Jones is trading in an uptrend and currently is in a correction phase in which it is approaching the trend at 44,230 support and resistance area.
Trade safe, Joe.
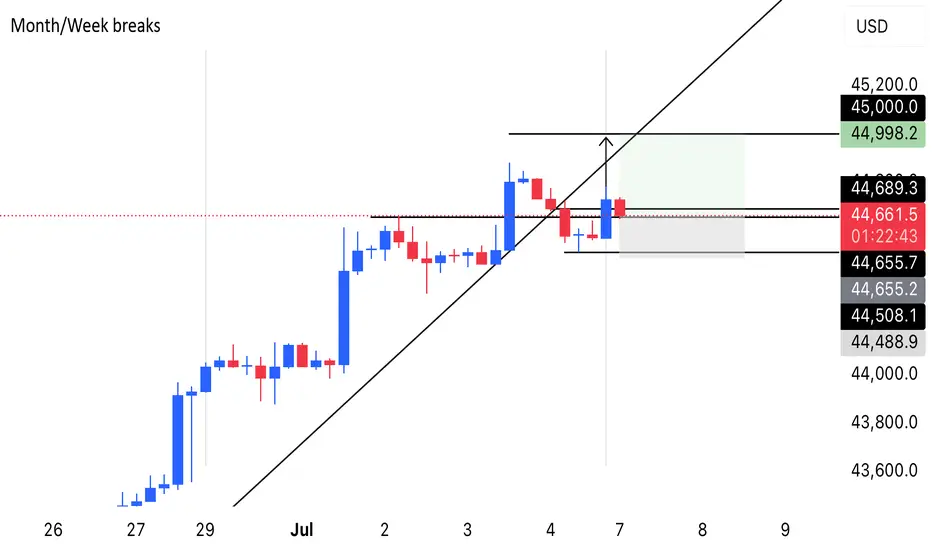
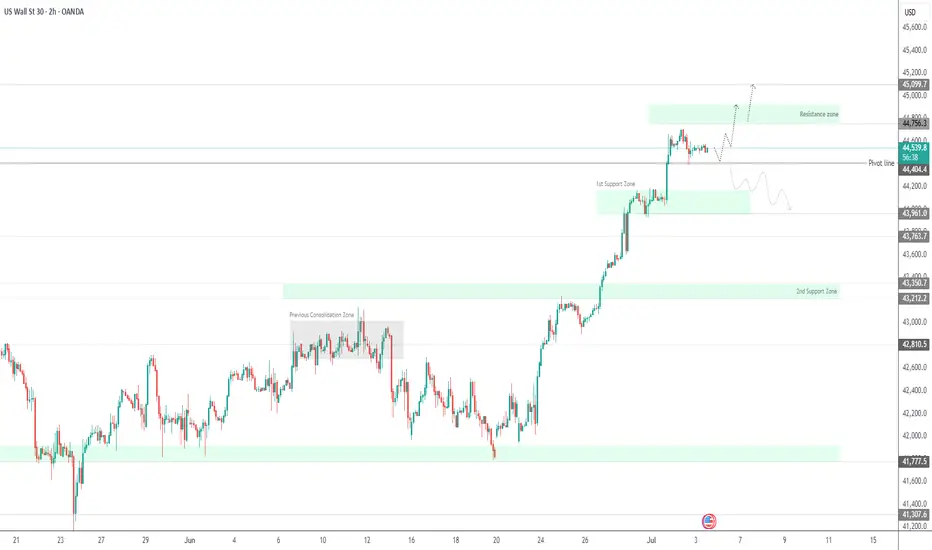
US30 Awaits NFP – Bullish Above 44,410, Volatility Expected US30 (Dow Jones) – NFP Volatility in Focus
Today’s session is expected to be volatile due to the upcoming NFP report. Based on current forecasts, the outlook remains broadly positive for U.S. indices, though intraday swings are likely.
Technical Outlook:
As long as the price holds above 44,410, the bullish momentum remains intact, with potential upside targets at 44,750 and 44,910
A pullback toward 44,410 remains possible before any continuation higher.
However, a confirmed 4H close below 44,400 would shift the short-term structure to bearish, opening the door toward the 1st support zone around 44,180.
Key Levels:
• Resistance: 44,750 / 44,910 / 45,090
• Support: 44,410 / 44,180 / 43,970
Stay cautious — volatility is expected to spike around the release of the jobs data.
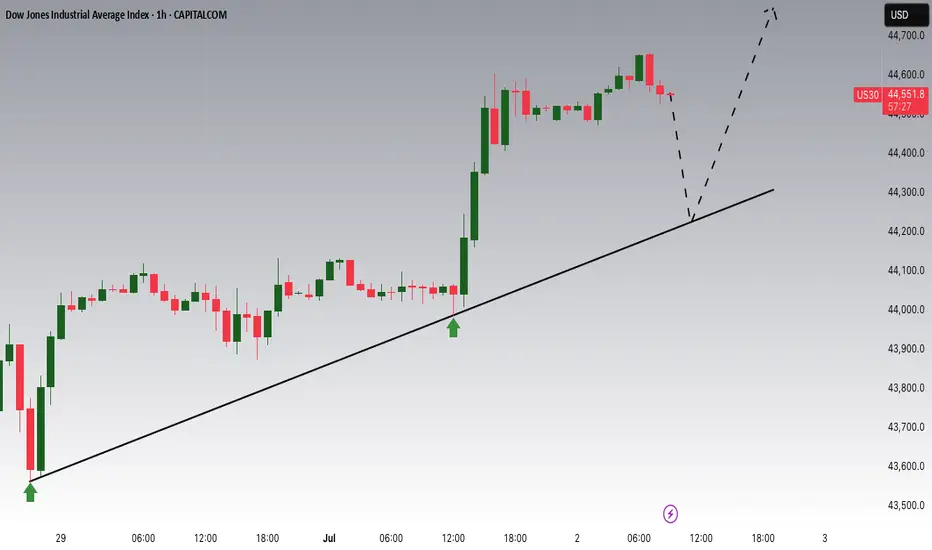
Dow’s fighting hard for that breakoutDow Jones is moving within a bullish channel
with low selling pressure —
strong legs pushing toward the top.
I’m expecting another solid bullish leg.
BLACKBULL:US30
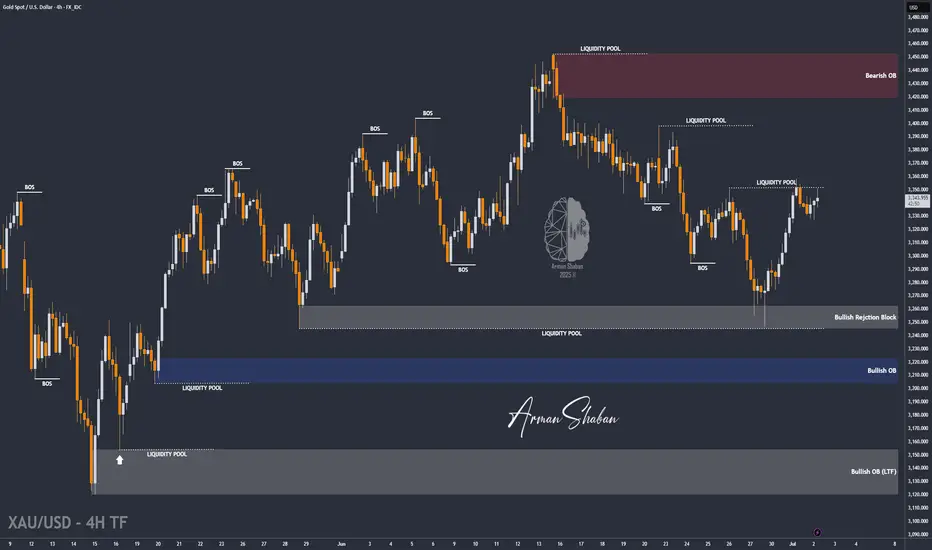
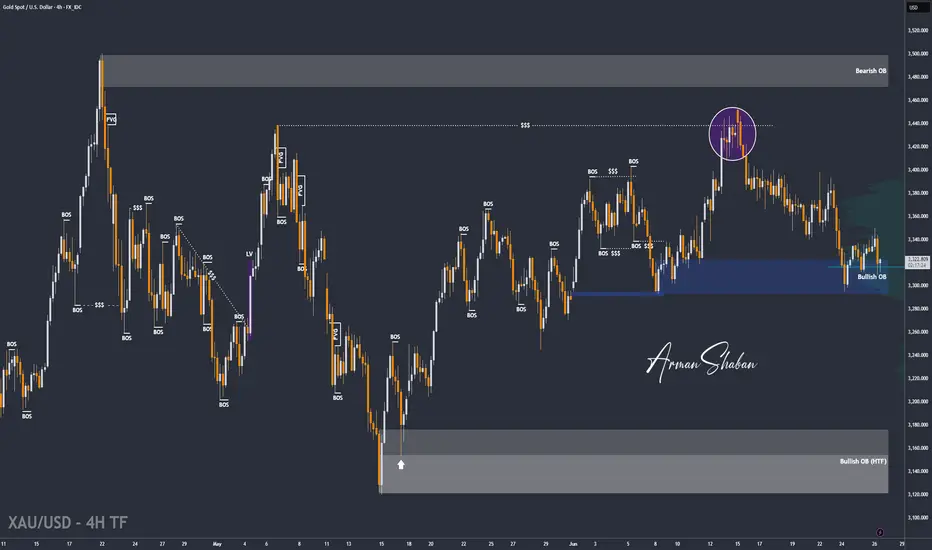
XAUUSD : Bull or Bear ? (READ THE CAPTION)By analyzing the gold chart on the 4-hour timeframe, we can see that the price continued its correction yesterday, dropping to as low as $3327. However, gold rebounded and is currently trading around the $3344 level.
The key condition for further bullish movement is a stable hold above $3338. If this level holds, the next potential upside targets are $3366 and $3399 respectively.
Please support me with your likes and comments to motivate me to share more analysis with you and share your opinion about the possible trend of this chart with me !
Best Regards , Arman Shaban
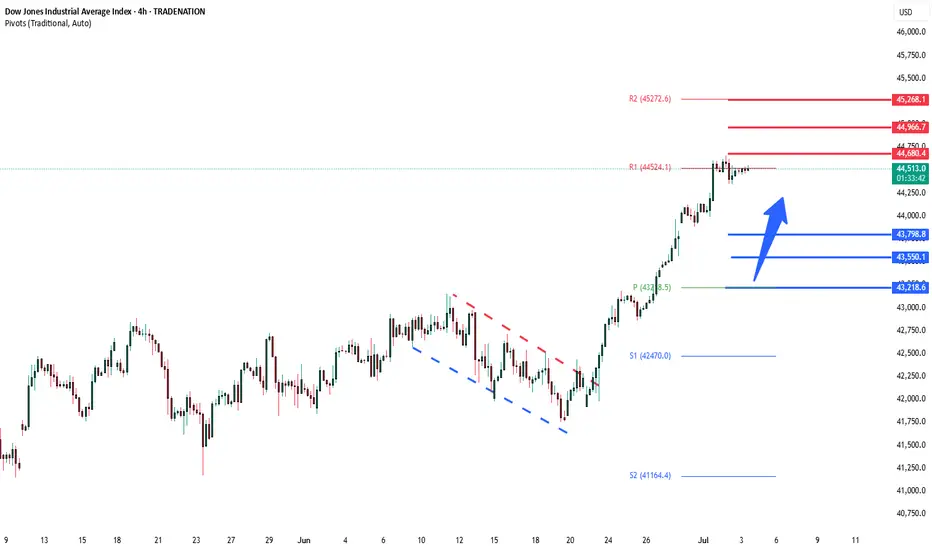
DowJones awaits us employment - NFP data Key Support and Resistance Levels
Resistance Level 1: 44680
Resistance Level 2: 44670
Resistance Level 3: 45270
Support Level 1: 43800
Support Level 2: 43550
Support Level 3: 43220
This communication is for informational purposes only and should not be viewed as any form of recommendation as to a particular course of action or as investment advice. It is not intended as an offer or solicitation for the purchase or sale of any financial instrument or as an official confirmation of any transaction. Opinions, estimates and assumptions expressed herein are made as of the date of this communication and are subject to change without notice. This communication has been prepared based upon information, including market prices, data and other information, believed to be reliable; however, Trade Nation does not warrant its completeness or accuracy. All market prices and market data contained in or attached to this communication are indicative and subject to change without notice.
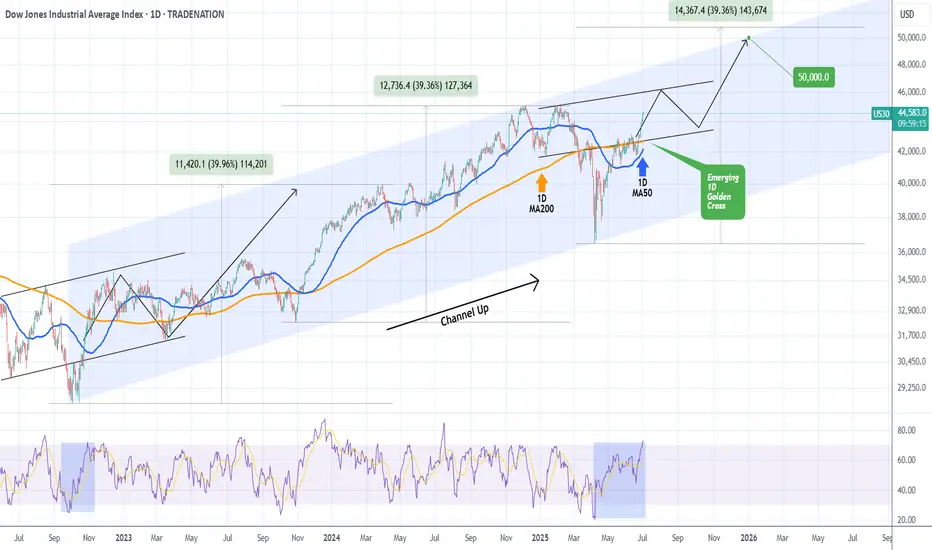
DOW JONES This is how it hits 50000 by the end of the year.Dow Jones (DJI) has been trading within a Channel Up pattern since the October 03 2022 market bottom and since the April 07 2025 Low, it's been unfolding the pattern's new Bullish Leg.
Ahead of an emerging 1D Golden Cross, the first since December 13 2022, the price action looks more bullish than ever strongly supported by the 1D MA50 (blue trend-line).
In fact, it is not that different from the fractal of that last 1D Golden Cross, which traded inside a neckline before the Bullish Leg broke upwards and completed eventually a +39.96% rise.
We expect a 50000 test towards the end of the year at the top of the Channel Up, which is still marginally below the tolerance levels of a +39.36% rise.
-------------------------------------------------------------------------------
** Please LIKE 👍, FOLLOW ✅, SHARE 🙌 and COMMENT ✍ if you enjoy this idea! Also share your ideas and charts in the comments section below! This is best way to keep it relevant, support us, keep the content here free and allow the idea to reach as many people as possible. **
-------------------------------------------------------------------------------
Disclosure: I am part of Trade Nation's Influencer program and receive a monthly fee for using their TradingView charts in my analysis.
💸💸💸💸💸💸
👇 👇 👇 👇 👇 👇
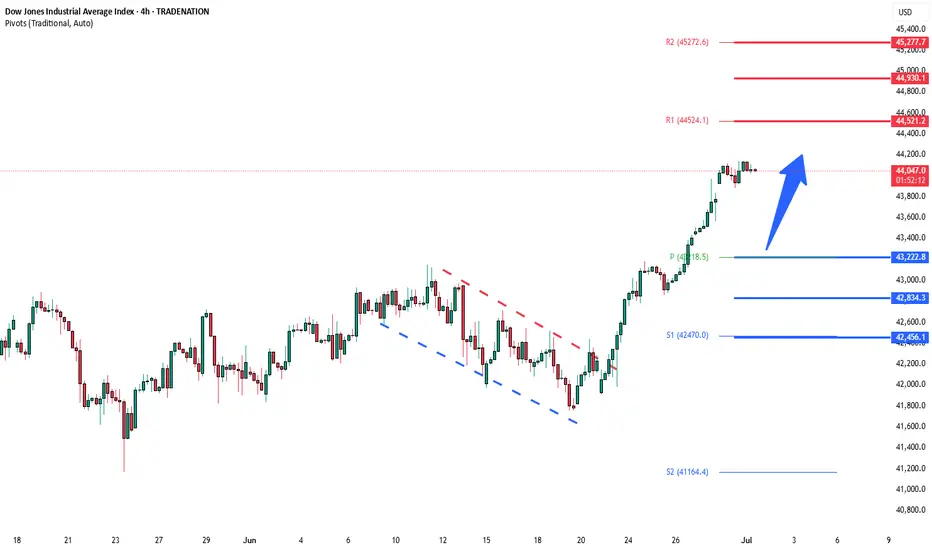
DowJones key trading level at 43220Key Support and Resistance Levels
Resistance Level 1: 44520
Resistance Level 2: 44930
Resistance Level 3: 45280
Support Level 1: 43220
Support Level 2: 42830
Support Level 3: 42460
This communication is for informational purposes only and should not be viewed as any form of recommendation as to a particular course of action or as investment advice. It is not intended as an offer or solicitation for the purchase or sale of any financial instrument or as an official confirmation of any transaction. Opinions, estimates and assumptions expressed herein are made as of the date of this communication and are subject to change without notice. This communication has been prepared based upon information, including market prices, data and other information, believed to be reliable; however, Trade Nation does not warrant its completeness or accuracy. All market prices and market data contained in or attached to this communication are indicative and subject to change without notice.
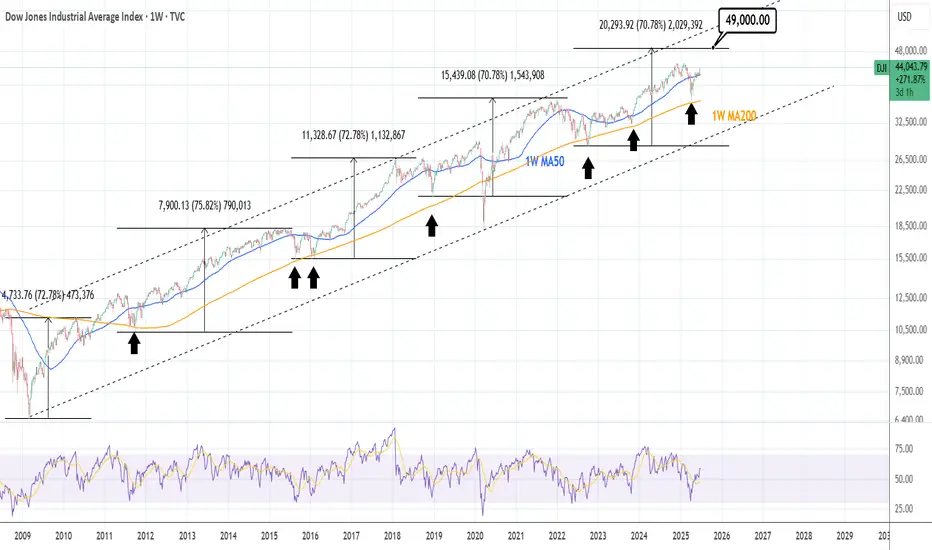
DOW JONES: Final phase of bullish wave has started.Dow is practically overbought on its 1D technical outlook (RSI = 69.306, MACD = 518.450, ADX = 36.217) but that should little affect the heavily bullish price action on the long term. The reason is that after the April bounce on the 1W MA200, Dow entered the final phase of the Bull Cycle that started on the October 2022 bottom and according to all prior bullish waves inside the 16 year Channel Up, it should rise by a minimum of +71%. That gives a TP = 49,000.
## If you like our free content follow our profile to get more daily ideas. ##
## Comments and likes are greatly appreciated. ##
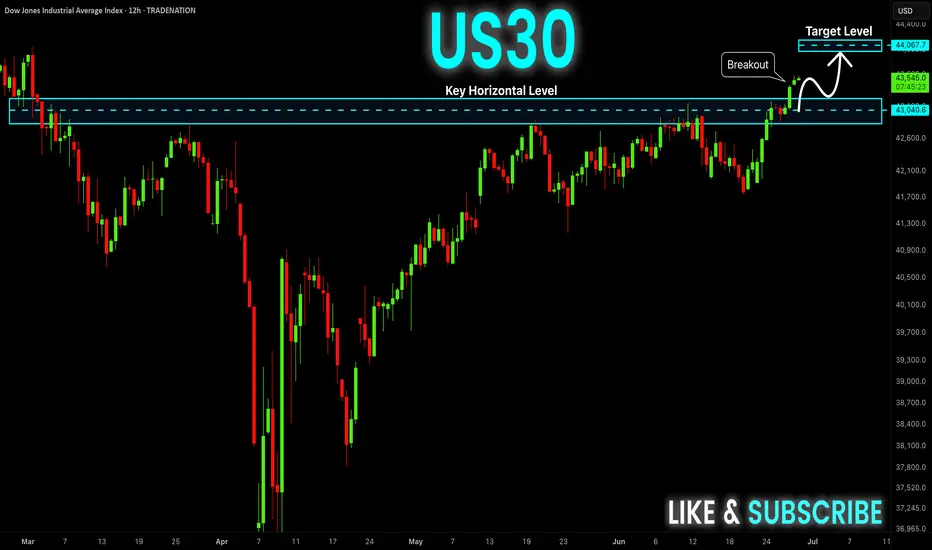
DOW JONES Will Keep Growing! Buy!
Hello,Traders!
US30 is trading in an
Uptrend and the index broke
The key horizontal level
Around 43,200 and the
Breakout is confirmed so
We are bullish biased
And we will be expecting a
Further bullish move up
Buy!
Comment and subscribe to help us grow!
Check out other forecasts below too!
Disclosure: I am part of Trade Nation's Influencer program and receive a monthly fee for using their TradingView charts in my analysis.
It seems very simple.Based on the market volume chart, as well as its similarity to previous declines, it seems like we are approaching a reliable bottom. This bottom is not far away and could happen right around 5000. We just have to wait for the daily reversal candle.

DOW JONES INDEX (US30): Consolidation is Over
Dow Jones Index completed a bullish accumulation on a daily.
The price violated a key horizontal resistance cluster and closed above that.
Next goal for bulls is 43790.
❤️Please, support my work with like, thank you!❤️
I am part of Trade Nation's Influencer program and receive a monthly fee for using their TradingView charts in my analysis.

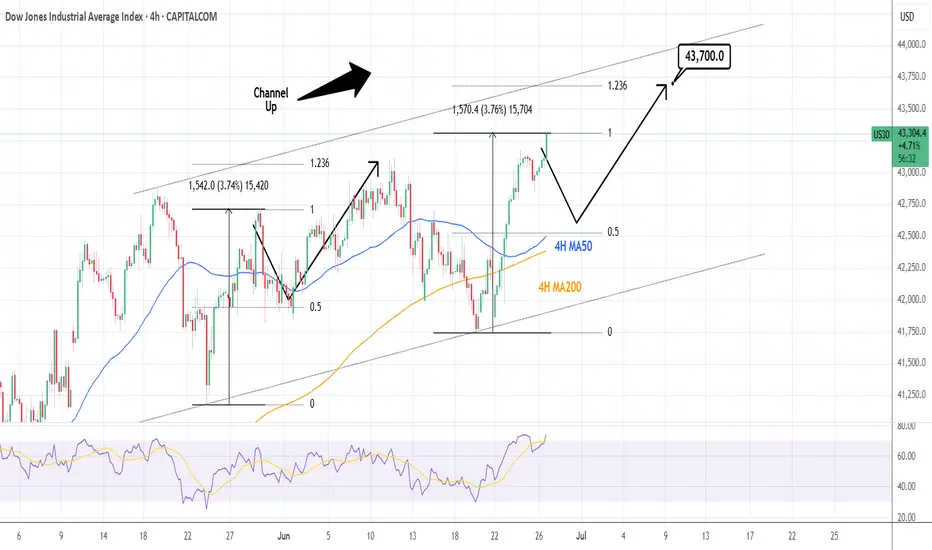
DOW JONES: Technical pullback possible but 43,700 target remainsDow Jones is bullish on its 1D technical outlook (RSI = 62.550, MACD = 276.720, ADX = 11.070), extending the bullish wave of the 1 month Channel Up. This is only the second such wave of this pattern and its first pulled back to the 0.5 Fiboancci retracement level after making a +3.75% rise. It is possible to see such a retrace start either now or tomorrow but on the medium term the bullish target on the 1.236 Fibonacci extension is intact (TP = 43,700).
## If you like our free content follow our profile to get more daily ideas. ##
## Comments and likes are greatly appreciated. ##
Gold Pullback Into Demand – Is Another Bullish Leg Coming?By analyzing the gold chart on the 4-hour timeframe, we can see that, as expected, price began to rise from the $3323 area and reached up to $3350. After this move, gold experienced a minor correction down to $3310, which aligns with a key demand zone.
Currently, gold is trading around $3322, and if price holds above $3313, we can expect another bullish move with $3333 as the first target and $3350 as the second.
This outlook will be invalidated if price closes below $3309.
Please support me with your likes and comments to motivate me to share more analysis with you and share your opinion about the possible trend of this chart with me !
Best Regards , Arman Shaban
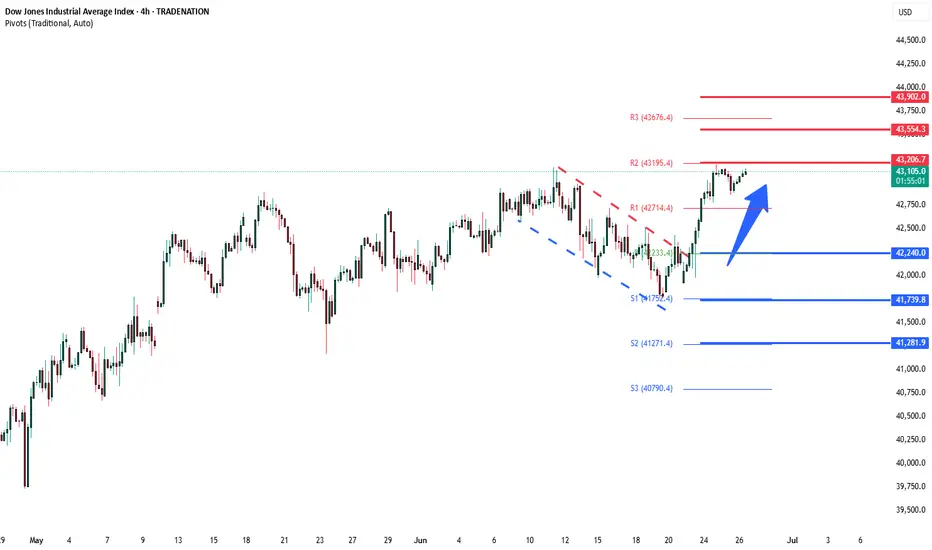
DowJones bullish breakout supported at 42240Key Support and Resistance Levels
Resistance Level 1: 43200
Resistance Level 2: 43544
Resistance Level 3: 43900
Support Level 1: 42240
Support Level 2: 41740
Support Level 3: 41280
This communication is for informational purposes only and should not be viewed as any form of recommendation as to a particular course of action or as investment advice. It is not intended as an offer or solicitation for the purchase or sale of any financial instrument or as an official confirmation of any transaction. Opinions, estimates and assumptions expressed herein are made as of the date of this communication and are subject to change without notice. This communication has been prepared based upon information, including market prices, data and other information, believed to be reliable; however, Trade Nation does not warrant its completeness or accuracy. All market prices and market data contained in or attached to this communication are indicative and subject to change without notice.
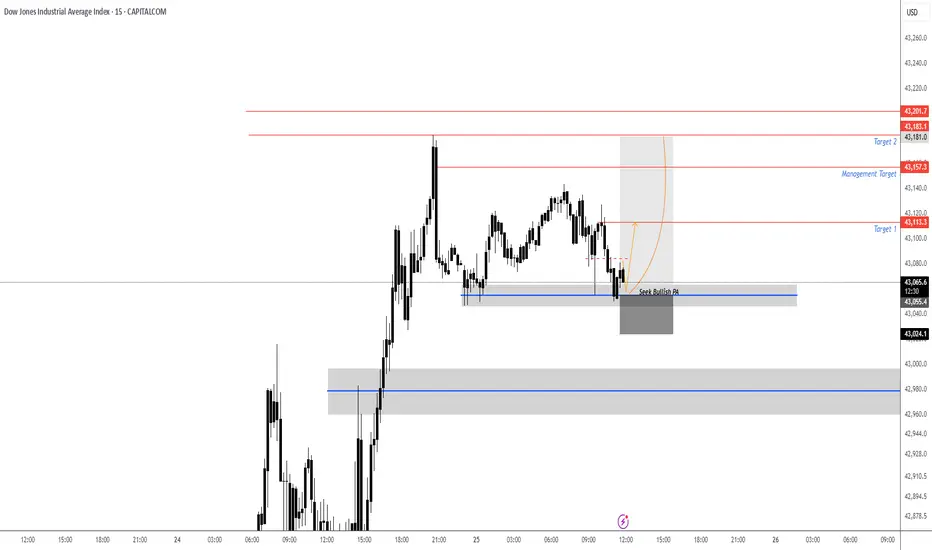
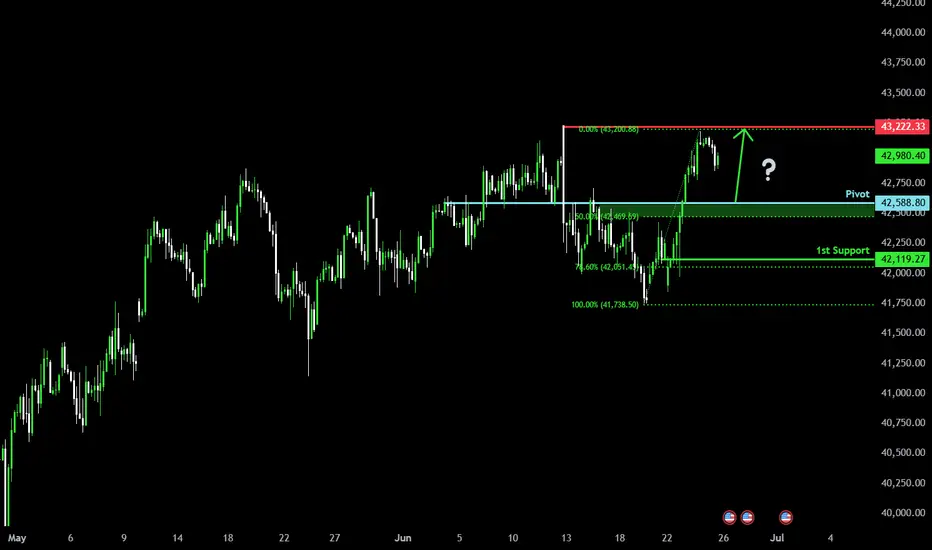
Bullish bounce for the Dow Jones?The price is falling towards the pivot which has been identified as an overlap support and could bounce from this level to our take profit.
Pivot: 42,588.80
1st Support: 42,119.27
1st Resistance: 43,222.33
Risk Warning:
Trading Forex and CFDs carries a high level of risk to your capital and you should only trade with money you can afford to lose. Trading Forex and CFDs may not be suitable for all investors, so please ensure that you fully understand the risks involved and seek independent advice if necessary.
Disclaimer:
The above opinions given constitute general market commentary, and do not constitute the opinion or advice of IC Markets or any form of personal or investment advice.
Any opinions, news, research, analyses, prices, other information, or links to third-party sites contained on this website are provided on an "as-is" basis, are intended only to be informative, is not an advice nor a recommendation, nor research, or a record of our trading prices, or an offer of, or solicitation for a transaction in any financial instrument and thus should not be treated as such. The information provided does not involve any specific investment objectives, financial situation and needs of any specific person who may receive it. Please be aware, that past performance is not a reliable indicator of future performance and/or results. Past Performance or Forward-looking scenarios based upon the reasonable beliefs of the third-party provider are not a guarantee of future performance. Actual results may differ materially from those anticipated in forward-looking or past performance statements. IC Markets makes no representation or warranty and assumes no liability as to the accuracy or completeness of the information provided, nor any loss arising from any investment based on a recommendation, forecast or any information supplied by any third-party.
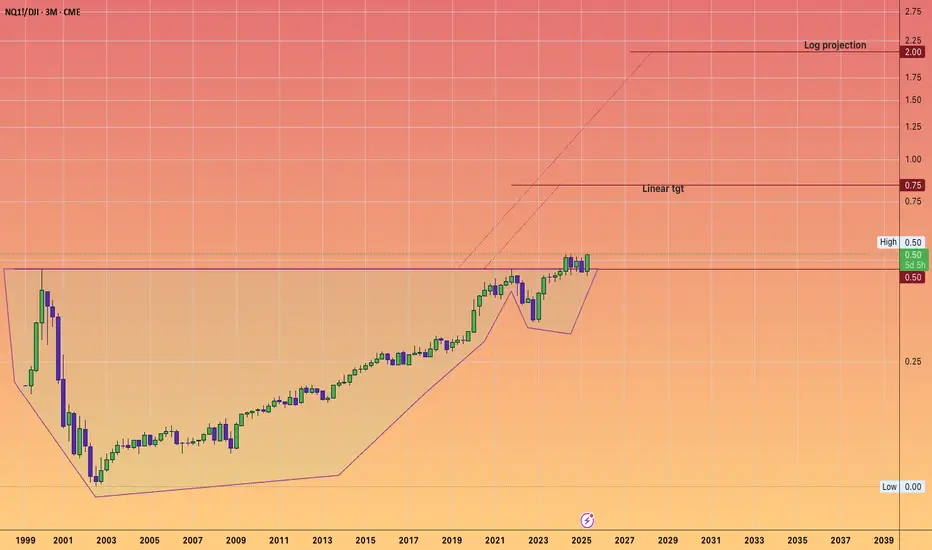
In the 2030's The Nasdaq 100 to 2X the Dow Jones.#CupandHandle don't fight the trend.
Technology vs Industrials.
AI
Robotics
Space Economy
Biotech
Artificial Super Intelligence to power GDP to insane levels.
US30 - Final Push before PullbackPotentially another push to upper levels of supply potentially 43,150-43,200. Can see this retest before seeing a potential pull back based off larger time frame.