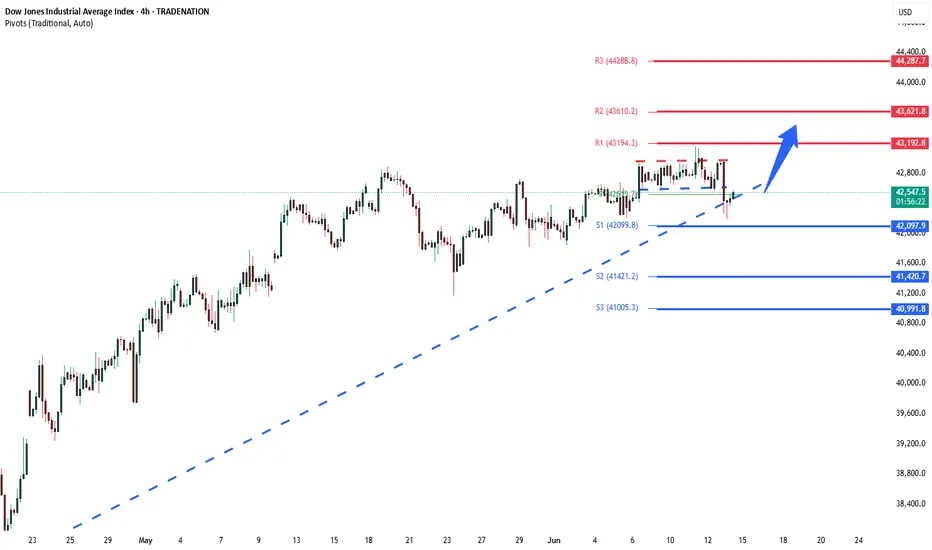
DowJones uptrend retest Key Support and Resistance Levels
Resistance Level 1: 43192
Resistance Level 2: 43620
Resistance Level 3: 44290
Support Level 1: 42100
Support Level 2: 41420
Support Level 3: 40990
This communication is for informational purposes only and should not be viewed as any form of recommendation as to a particular course of action or as investment advice. It is not intended as an offer or solicitation for the purchase or sale of any financial instrument or as an official confirmation of any transaction. Opinions, estimates and assumptions expressed herein are made as of the date of this communication and are subject to change without notice. This communication has been prepared based upon information, including market prices, data and other information, believed to be reliable; however, Trade Nation does not warrant its completeness or accuracy. All market prices and market data contained in or attached to this communication are indicative and subject to change without notice.
Dowjones
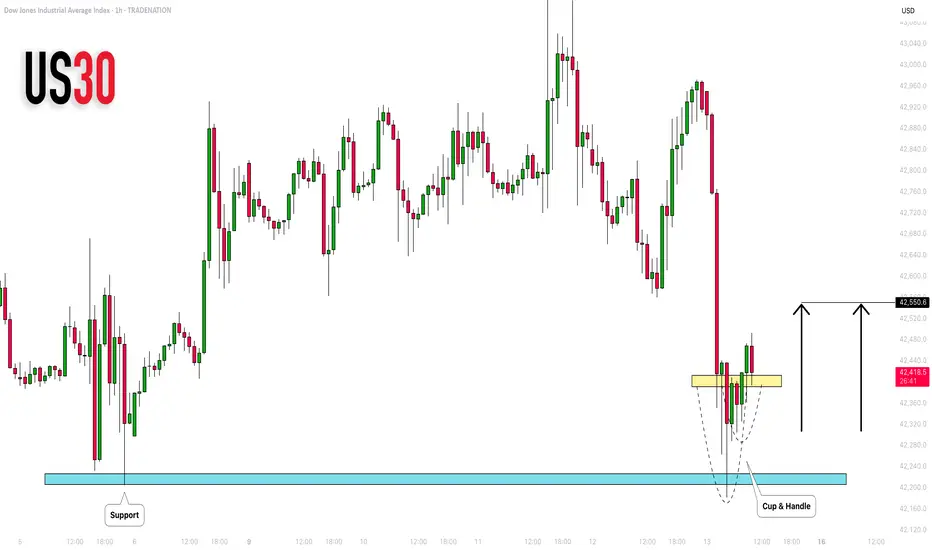
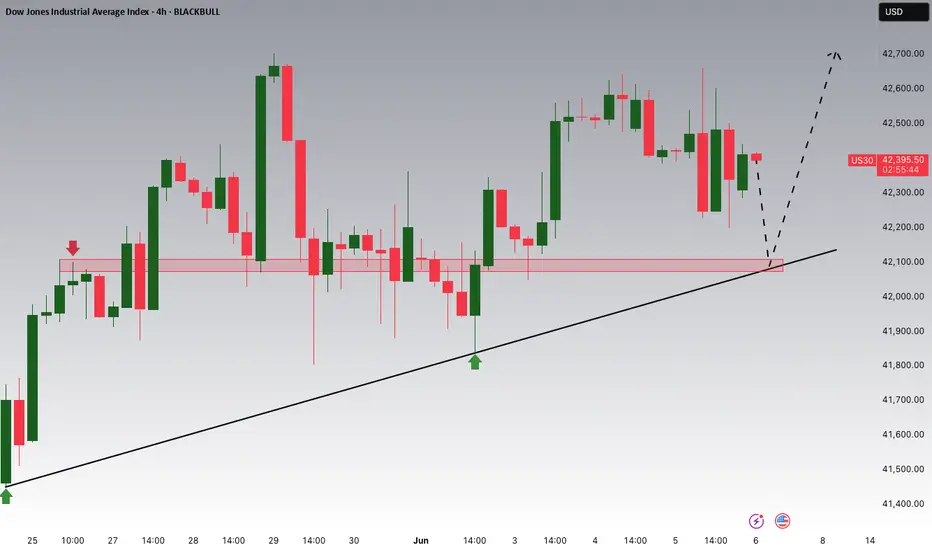
DOW JONES INDEX (US30): Pullback From Support
US30 shows some strength after a test of a key intraday support.
A cup and handle pattern on that and a violation of its neckline
indicate a local strength of the buyers.
I expect a pullback to 42550
❤️Please, support my work with like, thank you!❤️
I am part of Trade Nation's Influencer program and receive a monthly fee for using their TradingView charts in my analysis.
US30 Analysis: Liquidity Dip or Deeper Correction?📉 US30 (Dow Jones) Trade Idea 📉
Currently analysing US30 – the Dow Jones Index 🏛️, and there are some key developments worth noting…
On the 4-hour timeframe, we’re observing a clear shift in market structure, with price breaking through previous lows ⚠️. This raises two possibilities:
🔹 It could be a liquidity grab before a rally 🚀
🔹 Or, it may be the beginning of a deeper end-of-week sell-off targeting levels below 🔻
At this stage, I’m watching for a potential counter-trend short position — but only if the conditions outlined in the video are met with precision 🎯.
🧠 As always, it’s about waiting for confirmation, not jumping in early. Disciplined execution is key. 🧩💼
⚠️ Disclaimer: This is not financial advice. The information provided is for educational purposes only. Always do your own analysis and manage risk accordingly.

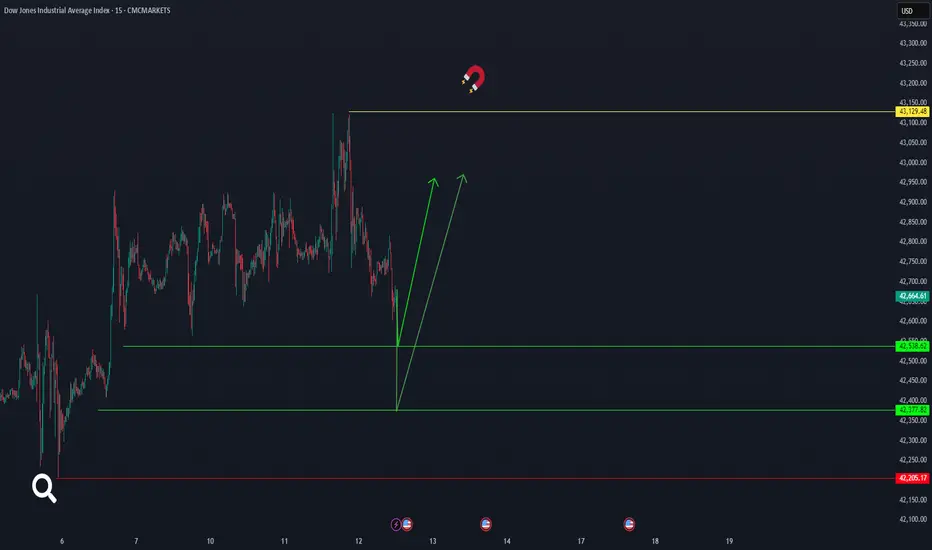
us30It seems that the Dow Jones will start moving again from the areas of 42377 or 42538 and the price will definitely reach 43129.48. Of course, the critical point is 42205. CMCMARKETS:US30
DowJones INTRADAY important support retest Key Support and Resistance Levels
Resistance Level 1: 43190
Resistance Level 2: 43620
Resistance Level 3: 44290
Support Level 1: 42100
Support Level 2: 41420
Support Level 3: 40990
This communication is for informational purposes only and should not be viewed as any form of recommendation as to a particular course of action or as investment advice. It is not intended as an offer or solicitation for the purchase or sale of any financial instrument or as an official confirmation of any transaction. Opinions, estimates and assumptions expressed herein are made as of the date of this communication and are subject to change without notice. This communication has been prepared based upon information, including market prices, data and other information, believed to be reliable; however, Trade Nation does not warrant its completeness or accuracy. All market prices and market data contained in or attached to this communication are indicative and subject to change without notice.

Dow Jones Potential UpsidesHey Traders, in today's trading session we are monitoring US30 for a buying opportunity around 42,100 zone, US30 is trading in an uptrend and currently is in a correction phase in which it is approaching the trend at 42,100 support and resistance area.
Trade safe, Joe.
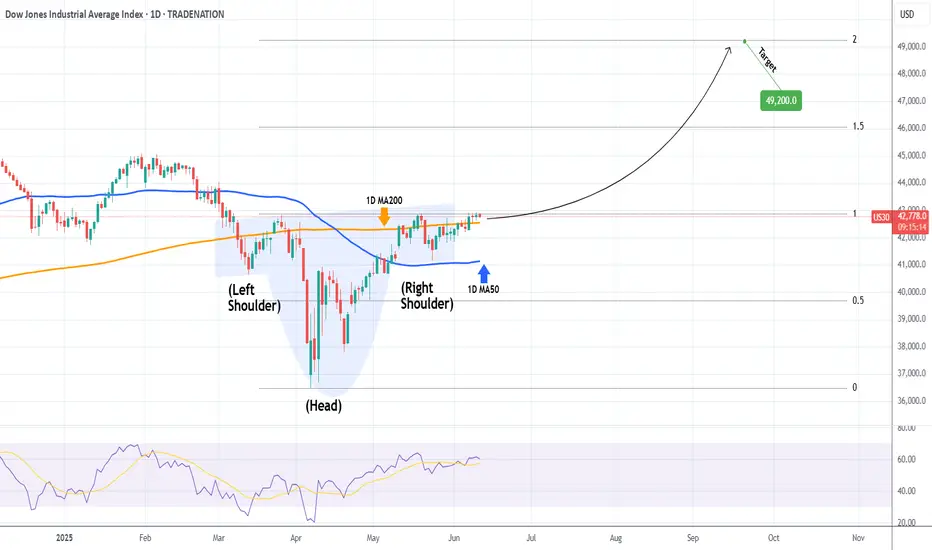
DOW JONES Inverse Head and Shoulders close to a bullish breakoutDow Jones (DJI) has completed an Inverse Head and Shoulders (IH&S) pattern, having formed the Right Shoulder supported by the 1D MA50 (blue trend-line).
The price is now slowly rising to test the upper neckline and if broken, expect a strong movement upwards. Technically, such patterns target their 2.0 Fibonacci extensions. The current one is at 49200 and that's our long-term Target. If you seek lower risk, you may target the 1.5 Fib extension.
-------------------------------------------------------------------------------
** Please LIKE 👍, FOLLOW ✅, SHARE 🙌 and COMMENT ✍ if you enjoy this idea! Also share your ideas and charts in the comments section below! This is best way to keep it relevant, support us, keep the content here free and allow the idea to reach as many people as possible. **
-------------------------------------------------------------------------------
Disclosure: I am part of Trade Nation's Influencer program and receive a monthly fee for using their TradingView charts in my analysis.
💸💸💸💸💸💸
👇 👇 👇 👇 👇 👇
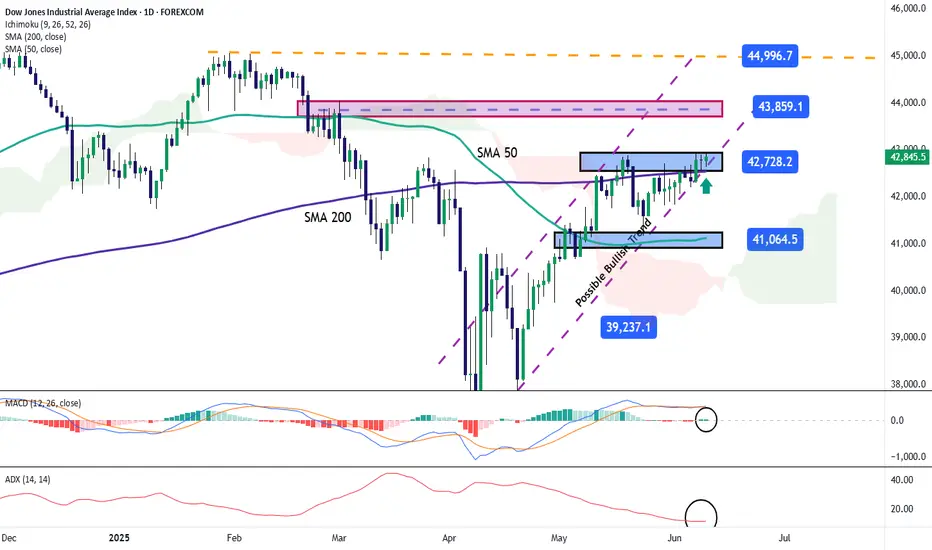
Dow Jones Struggles to Reach 43,000 PointsThe Dow Jones has gained more than 1% over the last three trading sessions and is now attempting to consistently reach price levels not seen since March of this year. The bullish bias has remained steady as investor confidence has recovered, driven by ongoing economic negotiations between the United States and China. The potential easing of trade tensions has helped stabilize market sentiment in the short term, and if this trend continues positively, consistent buying pressure could emerge in the index's movements over the near term.
Sustained Uptrend
Since early April, the Dow Jones has maintained a steady upward trend, and so far, selling corrections have been insufficient to break that trend. However, price action continues to face resistance at the trendline, and if this ongoing neutrality persists, the trendline could come under pressure in the coming sessions.
MACD
The MACD histogram continues to oscillate very close to the neutral 0 line, indicating that momentum between the moving averages remains balanced. As long as this behavior persists, the current neutral tone could become even more pronounced in upcoming sessions.
ADX
The ADX line remains below the neutral 20 level in the short term, signaling that average volatility has been steadily decreasing over the past sessions. This has further intensified the market’s neutral tone near the current resistance zone where the price is trading.
Key Levels:
42,700 points: Current resistance zone, aligned with the recent multi-week highs. This level could become the base for a broader short-term consolidation.
43,800 points: A level not seen since February of this year. A return to this area could reinforce the bullish bias and support a more sustained upward trend.
41,000 points: A critical support level that coincides with the 200-day simple moving average. A move toward this level on the downside could threaten the current bullish structure.
Written by Julian Pineda, CFA – Market Analyst
DowJones INTRADAY support at 42100Key Support and Resistance Levels
Resistance Level 1: 43190
Resistance Level 2: 43620
Resistance Level 3: 44290
Support Level 1: 42100
Support Level 2: 41420
Support Level 3: 40990
This communication is for informational purposes only and should not be viewed as any form of recommendation as to a particular course of action or as investment advice. It is not intended as an offer or solicitation for the purchase or sale of any financial instrument or as an official confirmation of any transaction. Opinions, estimates and assumptions expressed herein are made as of the date of this communication and are subject to change without notice. This communication has been prepared based upon information, including market prices, data and other information, believed to be reliable; however, Trade Nation does not warrant its completeness or accuracy. All market prices and market data contained in or attached to this communication are indicative and subject to change without notice.

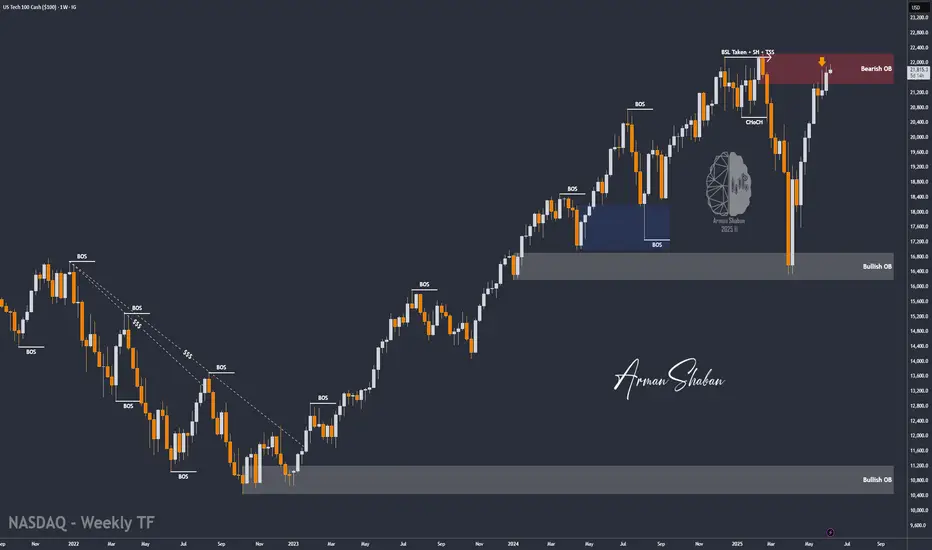
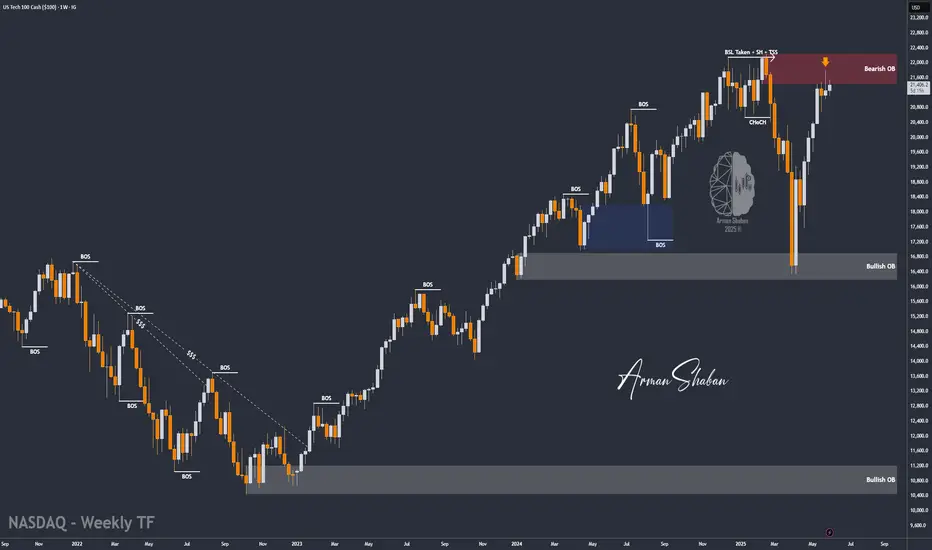
Nasdaq at Supply Zone – Rejection or Breakout? (READ THE CAPTIONBy examining the #Nasdaq chart on the weekly timeframe, we can see that the price is still trading within the supply zone around 21,850. We are still waiting for a strong rejection from this level, which could lead to a short-term price correction in this index.
The potential downside targets are:
21,000, 20,700, 20,200, and 19,150.
The key supply range lies between 21,400 and 22,200.
Additionally, there is a possibility of a liquidity grab or stop-hunt above 22,200 before any real drop begins.
This analysis will be considered invalid if price closes above 22,400 in the next three weeks.
On the fundamental side, there are several macro factors to watch:
Interest Rate Expectations:
Although inflation in the U.S. has cooled compared to last year, the Fed remains cautious. If upcoming CPI or PPI prints show unexpected resilience, the likelihood of rate cuts this year could diminish, pressuring tech-heavy indices like Nasdaq.
Tech Sector Valuations:
Valuations in major tech names — such as NVIDIA, Apple, and Microsoft — have reached historically high multiples. This makes Nasdaq particularly vulnerable to correction, especially if earnings disappoint or growth expectations soften.
Geopolitical Risks:
Ongoing tensions between the U.S. and China over trade and technology, as well as potential instability in the Middle East, could contribute to a risk-off sentiment — further supporting the case for a short-term pullback.
Earnings Season Ahead:
Q2 earnings season is around the corner. Any signs of slowing revenue growth or reduced forward guidance from major tech firms could act as a catalyst for the expected correction.
Please support me with your likes and comments to motivate me to share more analysis with you and share your opinion about the possible trend of this chart with me !
Best Regards , Arman Shaban
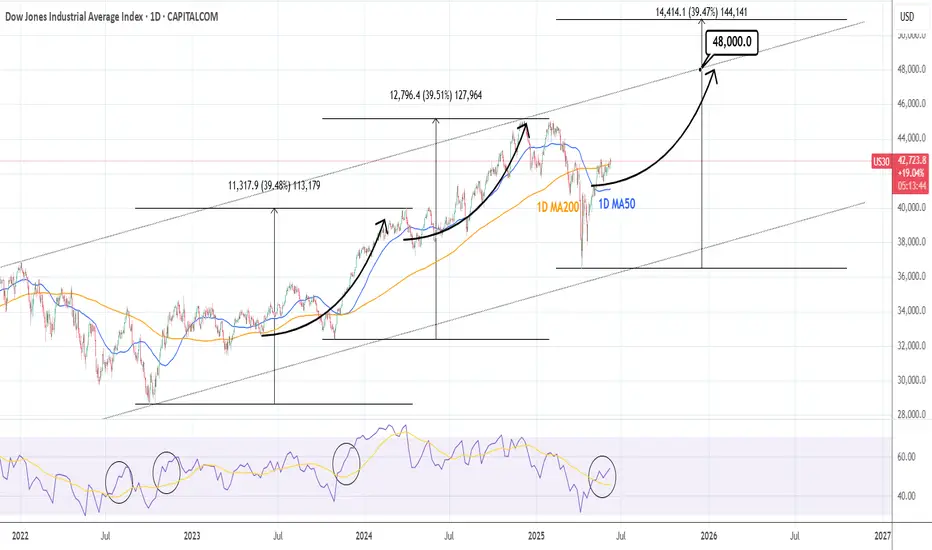
DOW JONES: Turning sideways for summer. Massive rise afterwards.Dow Jones is bullish on its 1D technical outlook (RSI = 58.389, MACD = 425.040, ADX = 23.083) but 1W is neutral, a natural outcome of the ranged trading within the 1D MA200 and 1D MA50in the last 3 weeks. It is possible to see the index staying sideways until the end of August and then attempt to complete a +39.50% rise from its bottom, like both prior bullish waves did. Regardless of this a test of the Channel Up top trendline, gives us a fair TP = 48,000 for the end of the year.
## If you like our free content follow our profile to get more daily ideas. ##
## Comments and likes are greatly appreciated. ##
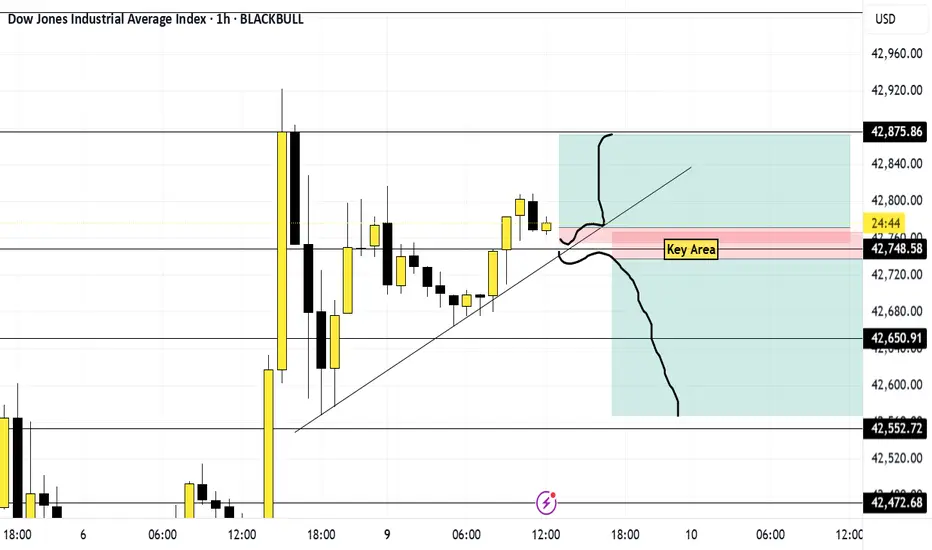
US30 JUNE 9Happy Mondays! Why are libraries so tall? Because they have many stories, like you will once you lock in on trading.
Now we can only do three things when it comes to trading Buy, Sell or nothing.
Price is moving up right now. If price breaks and retests my trend line and key area then I'm going to sell. However, if price rejects those same areas and starts to create higher highs and lows then I'll buy it.
If price decides to act like that one friend who got too high and decides to go nowhere then I shall do nothing and wait. That it that all.
Have fun and enjoy the process
Dow Jones Index Rises Towards Key ResistanceDow Jones Index Rises Towards Key Resistance
On Friday, the Dow Jones Industrial Average (Wall Street 30 mini on FXOpen) climbed above the 42,950 level — a high not seen since early March.
The index has gained around 1.6% since the beginning of June.
Why Is the Dow Jones Rising?
→ Friday’s US jobs report helped ease concerns about the country’s economic outlook. According to ForexFactory, Non-Farm Employment Change came in at +139K, beating the forecast of +126K.
→ On Thursday, Donald Trump and Chinese President Xi Jinping held a call, easing tariff tensions. Market participants also welcomed news that officials may hold trade negotiations in London on 9 June.
Could the DJIA (Wall Street 30 mini on FXOpen) Rally Continue?
Technical Analysis of the Dow Jones Chart
The chart suggests that the 42,950 level is acting as a significant resistance. The price has repeatedly reversed from the 42,660–42,950 area (as shown by the arrows).
At the same time:
→ Friday’s move above 42,950 triggered selling pressure, forming a candlestick with a long upper shadow;
→ This may have been a false bullish breakout of the May high;
→ The price remains within an ascending channel (shown in blue), but the bounces off the lower boundary appear weak.
Given this setup, it is reasonable to assume that intensified bearish activity near 42,950 on the USA30 could lead to a breakout below the channel’s lower boundary.
Additional pressure on the Dow Jones Industrial Average (Wall Street 30 mini on FXOpen) may come from developments in California, where protests have erupted against immigrant deportations, with President Donald Trump and Governor Gavin Newsom trading accusations.
This article represents the opinion of the Companies operating under the FXOpen brand only. It is not to be construed as an offer, solicitation, or recommendation with respect to products and services provided by the Companies operating under the FXOpen brand, nor is it to be considered financial advice.

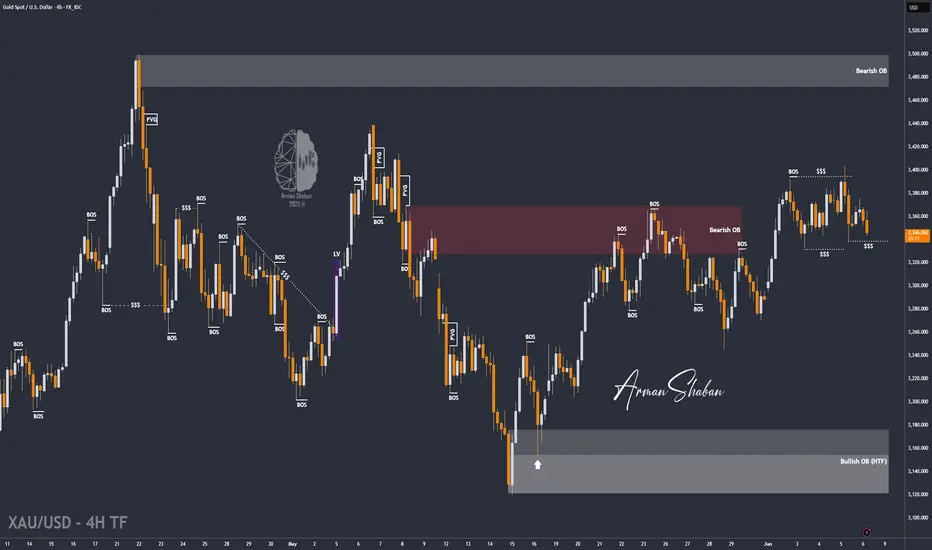
Gold Rejected Below $3370 — Eyes on Lower Demand Zones! (READ)By examining the gold chart on the 4-hour timeframe, we can see that after our previous analysis, the price climbed to $3388, giving us nearly 150 pips of return. However, gold was rejected from that level and failed to hold above $3370, eventually dropping below $3360.
Currently, gold is trading around $3348, and we may likely see further decline toward lower levels. The potential downside targets are $3338, $3332, $3326, and $3317.
Key demand zones to watch are:
→ $3327
→ $3311
→ $3298–$3300
→ $3278
Please support me with your likes and comments to motivate me to share more analysis with you and share your opinion about the possible trend of this chart with me !
Best Regards , Arman Shaban
US & Global Market Breakdown | Profits, Losses & Bearish TradesIn this video, I break down the current state of the US and global economy, and why I believe we’re heading into a bearish phase.
📉 Fundamentals:
I cover the key macroeconomic factors influencing the markets — including Trump’s proposed new tariffs, slowing GDP growth, and ongoing supply chain constraints. These all point toward increasing pressure on the global economy.
📊 Technical Analysis:
I go over the major indexes and highlight their recent behavior. We’ve seen reactions from resistance levels, contraction patterns forming, and a significant volume dry-up — followed by today’s spike in volume, which occurred right at resistance. These are potential signs that the market may be shifting toward a bearish trend.
That said, we could still just be witnessing a deeper pullback within a longer-term uptrend. Markets are unpredictable, and no one knows for sure — which is why it’s important to always do your due diligence.
💰 I also review the profits and losses I’ve taken on recent bullish trades, and why I’ve now positioned myself in select short opportunities based on what I’m seeing.
If I’m sharing this, it’s because I’m personally investing my capital based on my conviction — so always use your own judgment and risk management when making decisions.
If you found value in the breakdown, leave a like, comment, and subscribe for more timely updates.

NASDAQ at Weekly Supply Zone – Bearish Breakdown Ahead? (READ)By examining the #Nasdaq chart on the weekly timeframe, we can see that the price is currently trading within the supply zone around 21,400. If it manages to close and stabilize below 21,100, we can expect further downside for this index. The potential bearish targets are 21,000, 20,700, 20,200, and 19,150. The key supply zone ranges from 21,400 to 22,200.
Please support me with your likes and comments to motivate me to share more analysis with you and share your opinion about the possible trend of this chart with me !
Best Regards , Arman Shaban
US30 I Bearish Reversal Based on the M30 chart, the price is rising toward our sell entry level at 42,481.32, a pullback resistance that aligns with the 38.2% Fib retracement.
Our take profit is set at 42,326.96, a pullback support that aligns closely with the 50% Fib retracement.
The stop loss is set at 42,646.90, a swing high resistance.
High Risk Investment Warning
Trading Forex/CFDs on margin carries a high level of risk and may not be suitable for all investors. Leverage can work against you.
Stratos Markets Limited (tradu.com ):
CFDs are complex instruments and come with a high risk of losing money rapidly due to leverage. 63% of retail investor accounts lose money when trading CFDs with this provider. You should consider whether you understand how CFDs work and whether you can afford to take the high risk of losing your money.
Stratos Europe Ltd (tradu.com ):
CFDs are complex instruments and come with a high risk of losing money rapidly due to leverage. 63% of retail investor accounts lose money when trading CFDs with this provider. You should consider whether you understand how CFDs work and whether you can afford to take the high risk of losing your money.
Stratos Global LLC (tradu.com ):
Losses can exceed deposits.
Please be advised that the information presented on TradingView is provided to Tradu (‘Company’, ‘we’) by a third-party provider (‘TFA Global Pte Ltd’). Please be reminded that you are solely responsible for the trading decisions on your account. There is a very high degree of risk involved in trading. Any information and/or content is intended entirely for research, educational and informational purposes only and does not constitute investment or consultation advice or investment strategy. The information is not tailored to the investment needs of any specific person and therefore does not involve a consideration of any of the investment objectives, financial situation or needs of any viewer that may receive it. Kindly also note that past performance is not a reliable indicator of future results. Actual results may differ materially from those anticipated in forward-looking or past performance statements. We assume no liability as to the accuracy or completeness of any of the information and/or content provided herein and the Company cannot be held responsible for any omission, mistake nor for any loss or damage including without limitation to any loss of profit which may arise from reliance on any information supplied by TFA Global Pte Ltd.
The speaker(s) is neither an employee, agent nor representative of Tradu and is therefore acting independently. The opinions given are their own, constitute general market commentary, and do not constitute the opinion or advice of Tradu or any form of personal or investment advice. Tradu neither endorses nor guarantees offerings of third-party speakers, nor is Tradu responsible for the content, veracity or opinions of third-party speakers, presenters or participants.

DOW JONES starting the new Bullish Leg.Dow Jones (DJI) is rallying off its 4H MA50 (blue trend-line), shortly after making a new Higher Low on its 6-week Channel Up. Technically that is the start of its new Bullish Leg.
With the 4H RSI being identical to the Bullish Leg at the start of the Channel Up, we expect it to again rise by +4.30% and touch the 2.0 Fibonacci extension. Target 43600.
-------------------------------------------------------------------------------
** Please LIKE 👍, FOLLOW ✅, SHARE 🙌 and COMMENT ✍ if you enjoy this idea! Also share your ideas and charts in the comments section below! This is best way to keep it relevant, support us, keep the content here free and allow the idea to reach as many people as possible. **
-------------------------------------------------------------------------------
Disclosure: I am part of Trade Nation's Influencer program and receive a monthly fee for using their TradingView charts in my analysis.
💸💸💸💸💸💸
👇 👇 👇 👇 👇 👇

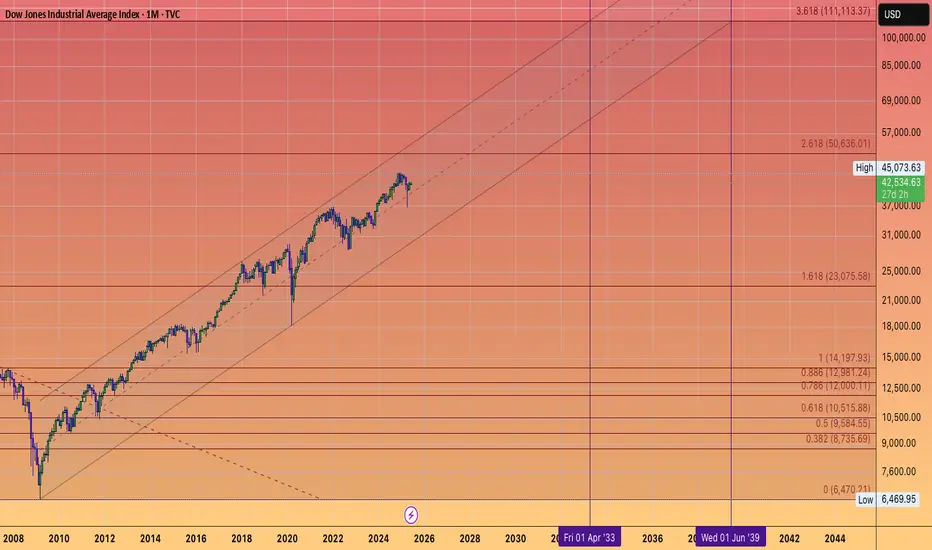
DOW JONES TO 111 THOUSAND..in the the 2030's.
as an investor you must be thinking 2 decades down the line.
NOT 2 quarters.
They can not
stop
printing #FIAT
it's in the code.
A 8% compound rate puts the Dow Jones at 85,000 in 2034.
I'm long forever.
DowJones INTRADAY broader concern over global trade headwindsTrade Tensions: US-China, US-Europe
Trump and Xi May Speak This Week: The call—if it happens—comes amid rising tensions over critical mineral exports, crucial for electronics and clean tech.
Market Implication: Ongoing uncertainty in US-China trade could pressure tech, EVs, and semiconductors, which rely on these materials. Watch for volatility in those sectors.
Europe Talks Stalling: Trade negotiations with Europe are also breaking down, with new tariff threats emerging.
Trading Angle: Defensive positioning in multinationals and exporters may be prudent. Currency pairs like EUR/USD could see movement on headline risk.
Corporate Layoffs: Disney, Microsoft
Disney & Microsoft Cut Jobs: Hundreds of layoffs in media and tech highlight continued weakness in entertainment and enterprise software demand.
Trading Relevance: Signals profit-margin pressure and shifting labor costs. Potential bearish signal for media ETFs and tech sector if layoff trend broadens.
China E-Commerce Firms Shift to Europe
Strategic Pivot: Chinese platforms are diversifying away from US markets due to tariffs and restrictions.
Market Watch: Could benefit European retail and logistics stocks. May also impact Chinese ADRs traded in the U.S.
Elon Musk’s xAI Debt Sale
$5B Debt Offering: Musk is raising capital for his AI venture, xAI Corp., while stepping back from politics.
Investor Focus: Watch Tesla and other Musk-related equities for capital allocation impacts. The move could dilute attention and increase risk premiums on his companies.
Harvard Legal Battle
Free Speech Lawsuit: Harvard pushes back on a Trump-era funding freeze.
Trading Impact: Limited direct effect, but feeds into broader political noise. May influence education sector stocks or legal/regulatory sentiment.
Wall Street Trade Idea (Nomura)
Strategy: Short S&P 500 on Trump trade threats, cover 5 days later → yielded 12% since February.
Application: Suggests short-term tactical trades can exploit volatility driven by political rhetoric. Useful for active traders focused on news-driven momentum.
Market Outlook
Futures Lower Today: Reflects broader concern over global trade headwinds.
Key Sectors to Watch: Tech (semis, EVs), Media, Chinese ADRs, European exporters, and AI-related plays.
Key Support and Resistance Levels
Resistance Level 1: 42920
Resistance Level 2: 43300
Resistance Level 3: 43620
Support Level 1: 41470
Support Level 2: 41160
Support Level 3: 40890
This communication is for informational purposes only and should not be viewed as any form of recommendation as to a particular course of action or as investment advice. It is not intended as an offer or solicitation for the purchase or sale of any financial instrument or as an official confirmation of any transaction. Opinions, estimates and assumptions expressed herein are made as of the date of this communication and are subject to change without notice. This communication has been prepared based upon information, including market prices, data and other information, believed to be reliable; however, Trade Nation does not warrant its completeness or accuracy. All market prices and market data contained in or attached to this communication are indicative and subject to change without notice.

DOW JONES: Inverse Head and Shoulders looking for a breakout.Dow Jones is marginally bullish on its 1D technical outlook (RSI = 55.600, MACD = 267.860, ADX = 21.901) as just now it is attempting to be detached from the 4H MA50. Technically this could be the attempt to break towards the 2.0 Fibonacci extension, after having formed the RS of an Inverse head and Shoulders pattern. With the 4H MACD close to a Bullish Cross, we are bullish, TP = 44,250.
## If you like our free content follow our profile to get more daily ideas. ##
## Comments and likes are greatly appreciated. ##

US30 SELLING ON DIPS !!HELLO TRADERS
AS I CAN SEE US30 is fail to break resistence zone after making a ATH its time to retrace as we can see bad econmy of US and GDP investors will pull money from stocks and invest in Safe haven so our Risk reward is great for us it is just a trade idea share ur thoughts stay tuned for more updates

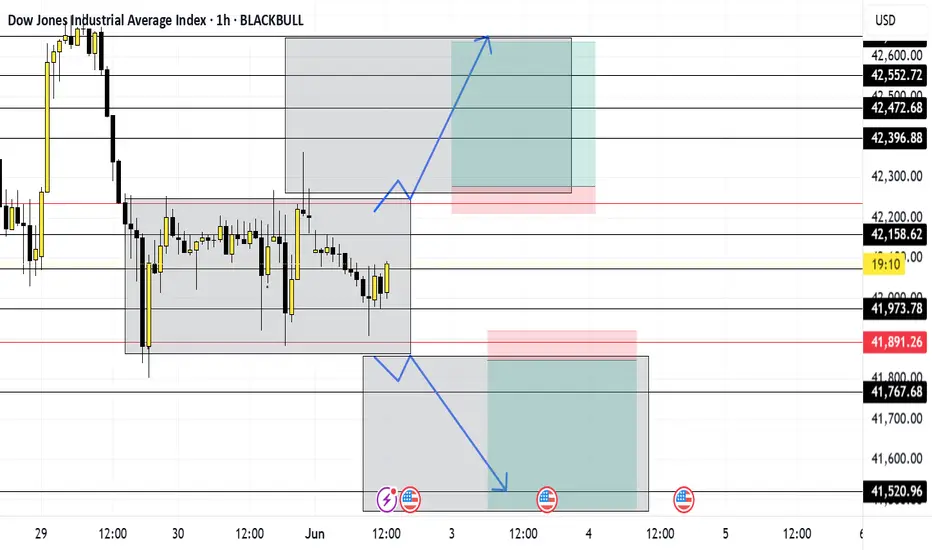
US30 JUNE 2What did the Buffalo say to his son when he left home? Bison...
Anyway, let's get to work. Price is looking very messy. So instead of trading it I'm going to draw a box around the consolidation and wait for price to break and retest the ends of the boxes.
Like always I'll wait for the 1m for price to break and retest before I enter the trade.
NEVER Trade Consolidation, it gets messy quickly.
Anywho... Have fun trading and be patient.