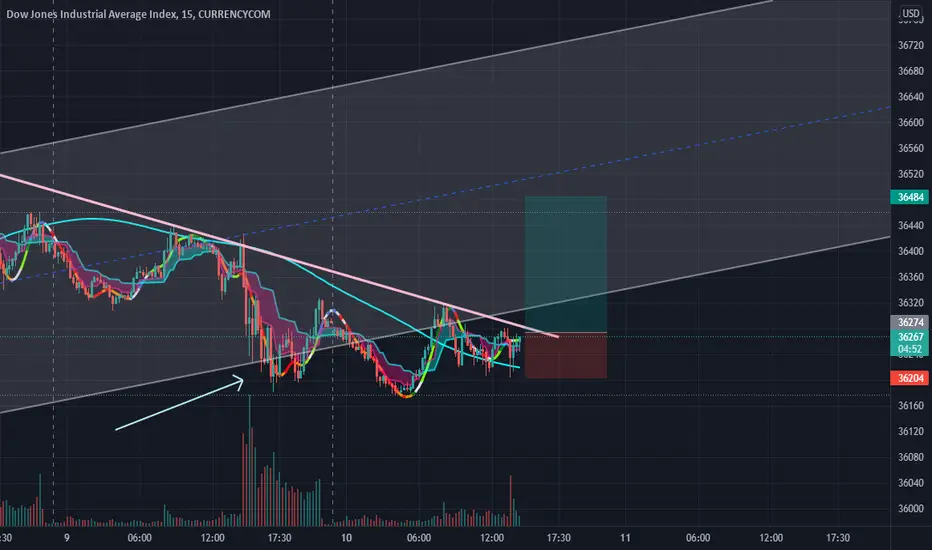
Dow jones longdow jones is about to make an uptrend.
after that downtrend that the price have been on, it finally squeezed exactly where i put the arrow,
as we can see the price didn't go lower than that, we're expecting to break the resistance and get our track back to the channel
buy at 36274, that's your entry, close position at 36440
Dowjonesanalysis
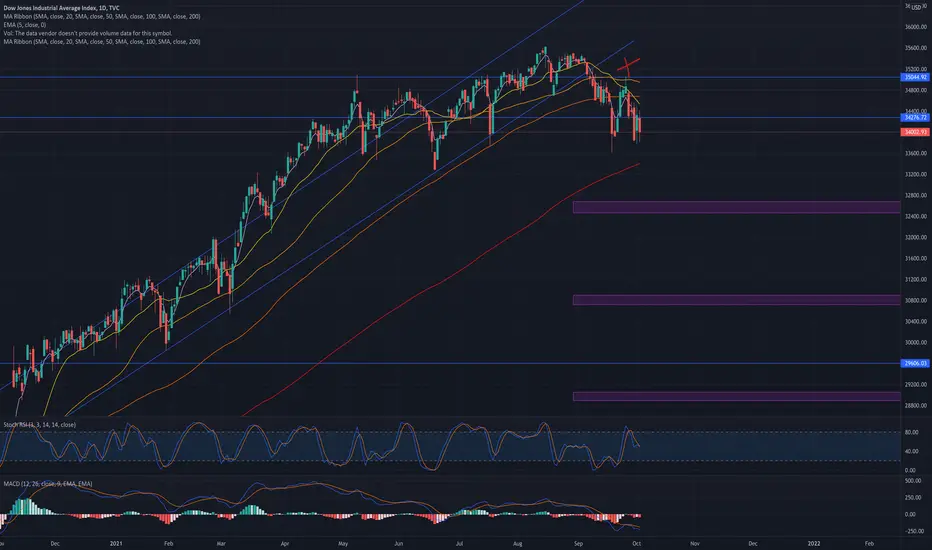
DOW JONES - Potential Short Term Topping Process Taking Place.NOTE: IF PROVEN ACCURATE, THIS NEW COUNT INVALIDATES ANY PREVIOUS LONG TRADE IDEAS FOR THE DOW JONES AND NASDAQ.
In this video I talk about some signs I am seeing of a topping process taking place right now.
When it becomes blatantly obvious that something is not right then I will change my count accordingly.
Although this is yet unconfirmed I explain to you why it looks very likely that we will see a 10-16% correction.
The long term trend still remains bullish but nothing goes up in a straight line forever.
Remember to use Disciplined Money Management Principles to ensure longevity as a trader.
If you don't know the long term pattern shouldn't you be doing your research instead of just following the crowd?
Just remember: I am not a financial advisor, I suggest using this only as a guide. Always do your own research.

US30 UptrendUS30 is in a strong uptrend right now but rejected at 36600. No break of trend yet nor incomplete order-block that needs to be filled so uptrend still strong and valid. We can expect it to rally back up to 36600 and catch a few points but chances of a strong rejection possible again so I don’t suggest a hodl through the 36600 area, a reversal/counter-trend trade could be valid at the 36600 area again if there are enough confirmations and you know how to execute the style. Good luck

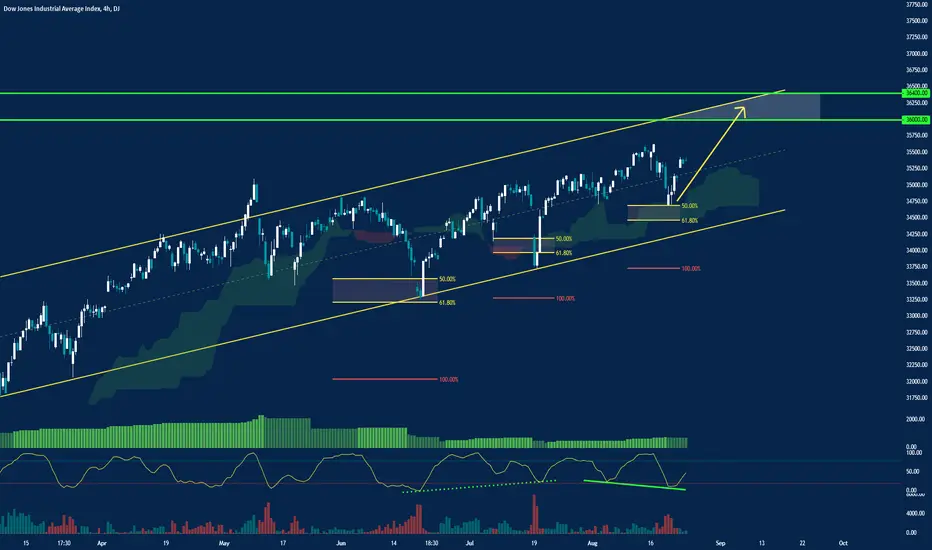
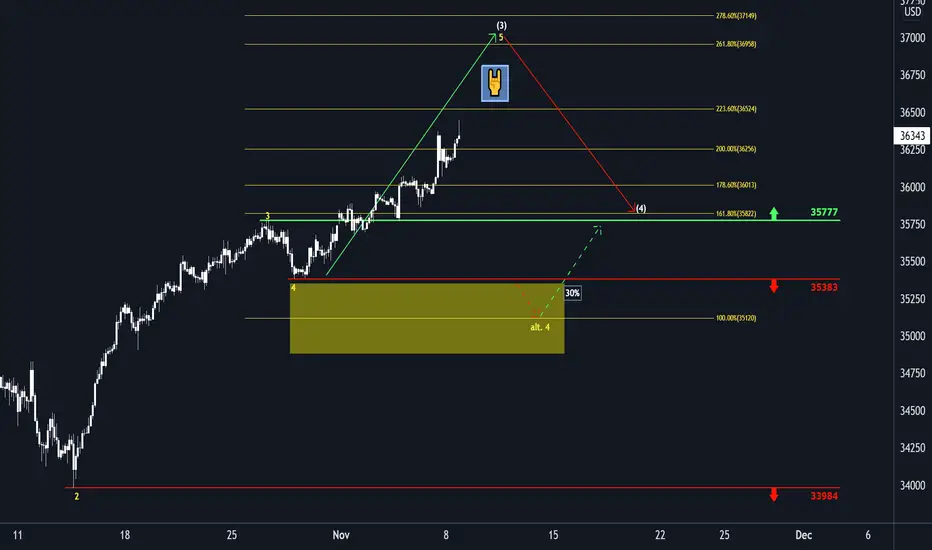
Dow Jones: Rock'N'Roll 🤘🤘🤘The Dow Jones is extending its gains and solidifies its position north of the mark at 35777 points. The index should not cross this line - for now. In total, we expect the course to further increase and reach areas above 36958 points. After that, we expect a fall towards 35822 points.
Happy trading!

US30 - Where we can see Buy Pressure 😋 / Smart Money TradingTechnical Overview: - Dow Jones
We like to see price react to our buy zones providing intraday/scalps as they are not meant to be strong as the lower zone marked :)
Simple, whoever tells you short is selling you lies, you want to be on the safe side? stay bullish on US markets simple as that.
Wait for dips if they happen don't chase the market :)
Analysis is only 1 piece of the puzzle 🧩
Our analysis is a sentiment for the upcoming week, month.
Use this as a weather forecast, you are the person that has to put on a jacket when it’s raining.
Trade this sentiment based off your own entry strategy at the right time.
Flow with the Devil 😈
Trade with the manipulation👾

US30 - Where we can see buy pressure on the way down 😋Technical Overview: - Dow Jones
We like to see price react to our buy zones providing intraday/scalps as they are not meant to be strong as the lower zone marked :)
Simple, whoever tells you short is selling you lies, you want to be on the safe side? stay bullish on US markets simple as that.
Wait for dips if they happen don't chase the market :)
Analysis is only 1 piece of the puzzle 🧩
Our analysis is a sentiment for the upcoming week, month.
Use this as a weather forecast, you are the person that has to put on a jacket when it’s raining.
Trade this sentiment based off your own entry strategy at the right time.
Flow with the Devil 😈
Trade with the manipulation👾

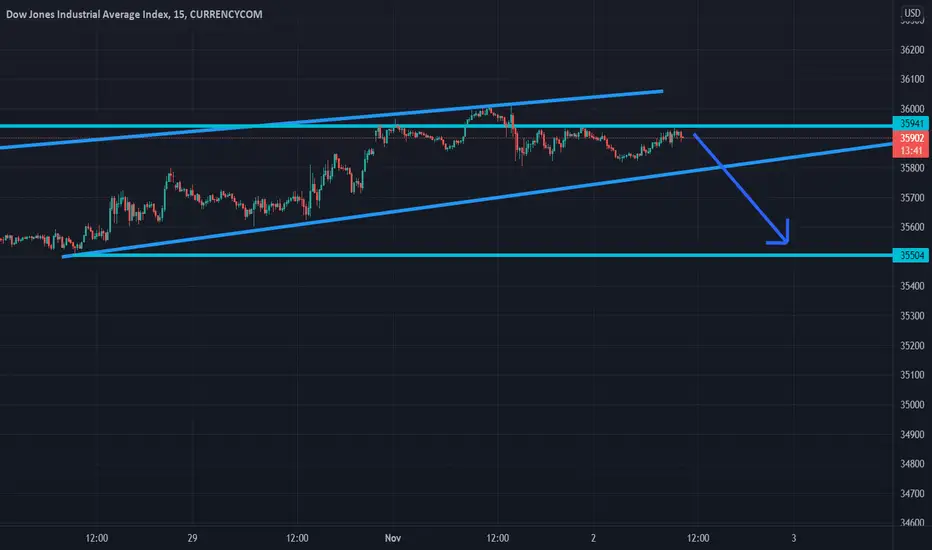
US30 ShortMy view of Dow Jones (US30) . Potential short opportunity.
Since the start of October we have entered this uptrend channel in which the price was moving in. We had 2 “fake outs” meaning the candle broke out of the channel but was overruled by the next one entering back into the uptrend channel. Smaller timeframes also show a smaller uptrend channel which I marked with the regression trend. My idea/vision/prediction is that the price could come up to 35675 during Asian session where at that point, depending on the price momentum, we could enter in a short. Entry at 35675 with a tight Stop Loss at 35715 . Take Profit is at our PBA (Pullback Area) which is at 35080 . The sell would be confirmed after we break out of the regression trend which would also break the very strong Resistance from 23rd of Aug to 7th of Sep . After breaking that level we would be due for a pullback down to the bottom of this uptrend channel .
PARAMETERS
- Entry: 35675
- SL: 35715
- TP: 35080
KEY NOTES
- Start of October , we have entered this uptrend channel .
- Smaller uptrend channel on smaller timeframes.
- The sell would be confirmed after we break out of the regression trend which would also break the very strong Resistance from 23rd of Aug to 7th of Sep.
Happy trading!

Dow Jones: Good Boy! 🐶🐶🐶The Dow Jones has been a very good boy ever since the low of the yellow wave 2. Currently, the surge should continue until somewhere around 35822 points. After completing a small correction, we expect the course to increase once again.
Push it to the limit!

US30 predictionJust my forecast about Dow, dased on order blocks logic, on BBOXs and volume. Nothing more, nothing less.

Dow Jones 2021 vs Dow Jones 1929Hi there,
Comparing the charts (before 1929 to 1929) and (before 2021 to 2021), they are scarily similar, with many similar patterns, from the perspective of only purely TA, this could be the scenario playing out, but we need some strong fundamental reason for this to happen, what could it be?
Since the start of the covid 19, we saw the market crashed, but in the end, we found out it was purely a correction, but there is one reason, that could be the consequence of the next global depression (?), that is the printing money, cannot just solve a recession.
Imagine this scenario:
Where the only good in the economy is rice and rice costs $1 a pound, and imagine you and all others earn $100 a month. Each month you buy 100 lbs of rice exchanging $1 for 1 lb of rice; so the real value of $1 is 1 lb of rice. Now suppose the government simply prints more dollar bills and gives you and everyone else an additional $100.
If you want to eat more than 100 lbs of rice a month, now you can do so, but, since others like you also want to do the same, the demand for rice in the economy would go up and very likely its price as well. Now you would have to give up, say $2 for each lb of rice . This, is inflation , and it is decreasing the real value of your dollars, you are getting less rice for every dollar than you used to. This would be the perfect example, but there is a problem in 2021, which is that the wages are not following the massive increase of inflation , due to the massive printing we had, so instead of having $200 to buy 100 pounds of rice, you still have $100 to try to buy 100 pounds of rice($2 each pound of rice now). In conclusion with this scenario, this will have consequences in the long term to the bad numbers of the unemployment and which will cause trouble in the economy, and thats when we start heading for a recession.
Back to the charts, all of this bearish price action, can it be the top of this bull market? It looks like it, we could still have another rally, another top, but the top I would say its very close, and this last bearish price action is very similar to a top out back in 1929.
I will short Dow jones to the targets mentioned in the charts, but remember, its a long term investment.

Dow Jones bullish or bearish ?Dow Jones have to break 35044 to make sure back on bullish track. but, it seems like not today for bullish. today candles close made sandwich bearish candles.
Don't miss this sweet 1:10 RRRYour divergence signals plug is back at it again !.
REASON FOR THE SELL TRADE
1. Our 200 EMA is serving as our 50% (Average) level on our RSI.
2. The confluences are as clear as day, both at our previous resistance and our trendline
3. Price is already overbought but not over over bought yet, price must be over over bought at our confluence.
4. Divergence confirmed both in our main price on our chart, RSI and AO.
5. Monday is market open which means prices needs to adjust for the new week meaning, prices need to get centered on a moving average in this case, our 200 Exponential MA.
Right after this post is published, i will set my alert to be received via email and mobile notification so i don't miss this scalping opportunity.
Calculations:
STOP LOSS (SL) is set at 51 points (or pips) whereas our
TAKE PROFIT (TP) is set at a whooping 550 points (or pips)
So therefore, using the following lots on a 50 spread account, you manage a loss and make a profit of:
0.01 (10 cents) = SL - $5.10 TP - $55
0.10 (1 dollar) = SL - $51 TP - $550
1.00 (10 dollars) = SL - $510 TP - $5500
10.00 (100 dollars) = SL - $5100 TP - $55,000
Use proper risk management, use proper money management !.
I have time on my hands hence the essay-like breakdown of this trade lol !.

DOW JONES - 33100 DOW Expected to test Levels of 33100 in this current move but It's a ROCK SOLID LEVELS WHICH EXPECT NOT GOING TO BREAK SOON...
33700 IS IMPORTANT LEVELS
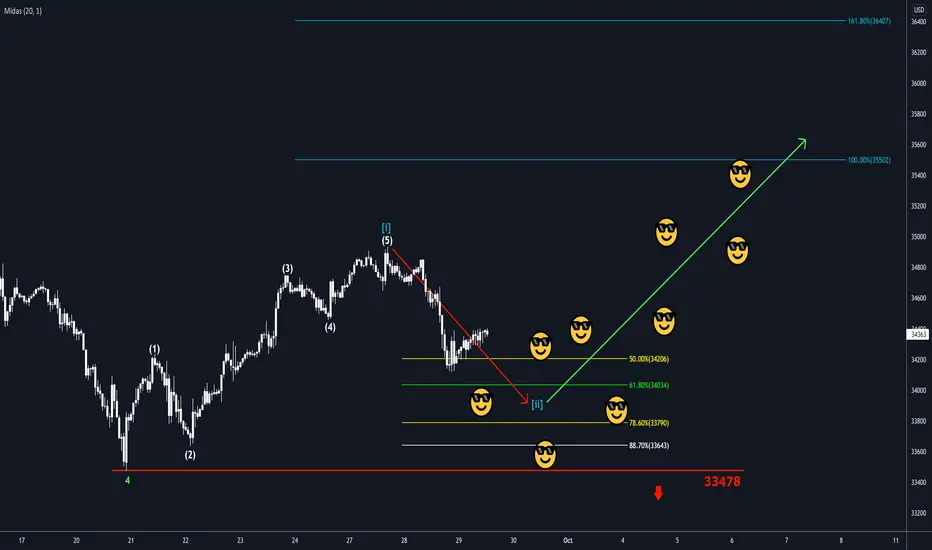
Dow Jones: Good Boy! 😎😎😎Who is a good boy? The Dow Jones is! Here, the top was perfectly hit and the following correction also evolves as planned – so far. We expect the course to drop below 34034 points and then attack new all-time highs.
Let’s gooooo!
US30 - Can we get another sell off? (Buy/Sell zones)🙂Technical Overview: - Dow Jones
We like to see price react to our buy zones providing intraday/scalps as they are not meant to be strong as the lower zone marked :)
Simple, whoever tells you short is selling you lies, you want to be on the safe side? stay bullish on US markets simple as that.
Wait for dips if they happen don't chase the market :)
Analysis is only 1 piece of the puzzle 🧩
Our analysis is a sentiment for the upcoming week, month.
Use this as a weather forecast, you are the person that has to put on a jacket when it’s raining.
Trade this sentiment based off your own entry strategy at the right time.
Flow with the Devil 😈
Trade with the manipulation👾

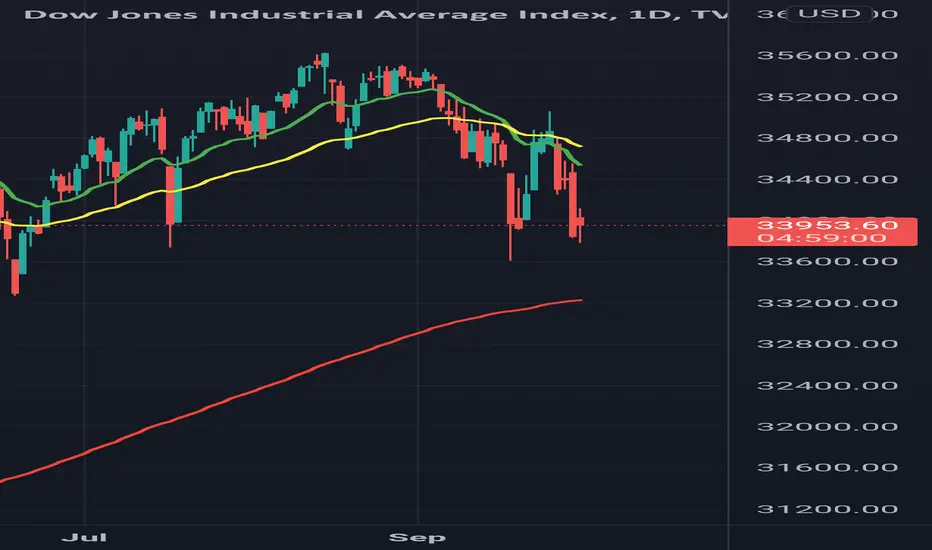
Dow Jones Index completed its 5% correctionDow Jones broke the first main support line on 34600 and reached to the second one on (33600-33700) zone. Touched it two times but didn't break it.
35600 was the highest point then it started its correction. It almost completed its 5% correction when touched 33600.
A strong bullish movement based on inflation rate, and monetary policies is most likely possible.

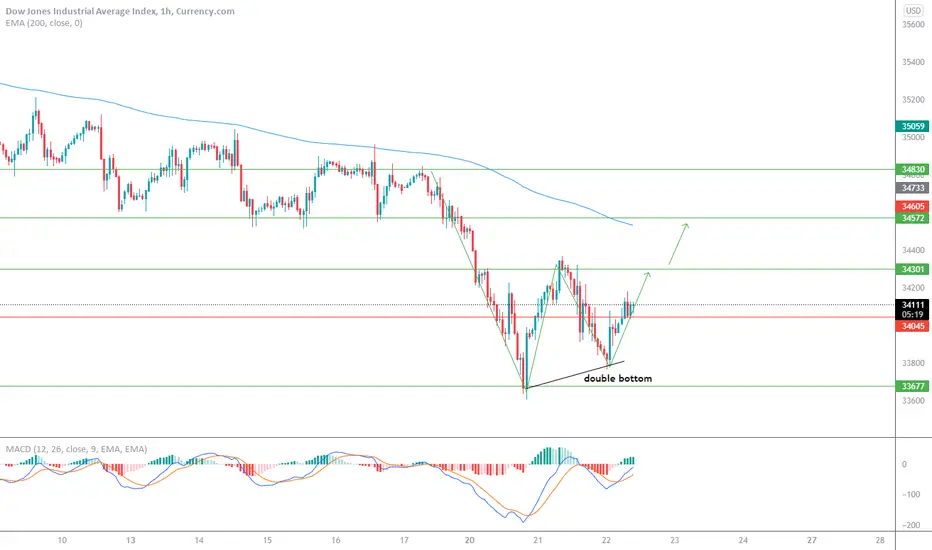
us30 create a pattern price moving to create a double bottom pattern and return to touch the moving average
the first target will be in 34300
the second target will be in 34550
stop-loss stabilize price below 33770
Dow Jones: It’s going down!With the bears remaining strong, we adapted our expectations and foresee a decline until somewhere close to around 34035 points. After establishing a low there, the Dow Jones should gain strength again and surpass the resistance at 35547 points.
Be patient!
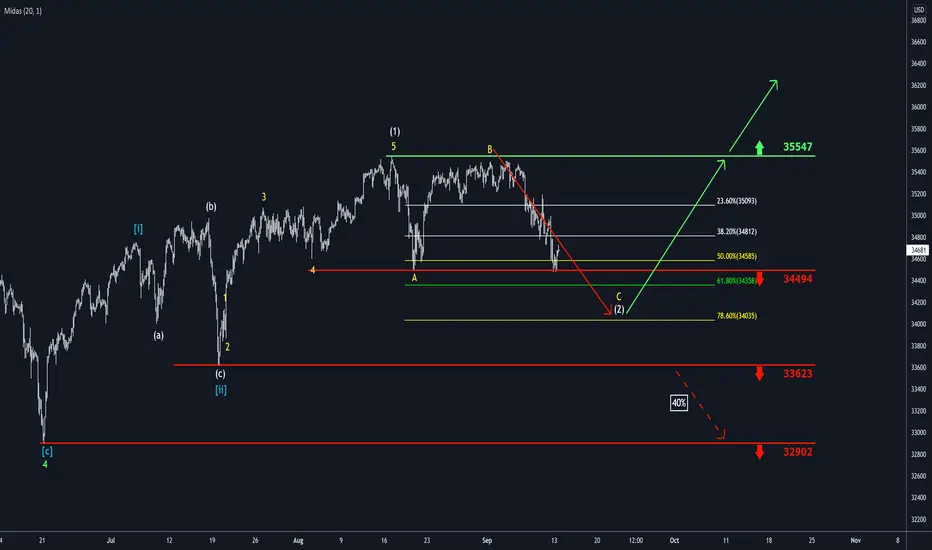
Dow: Aaaaand Action! 📽📽📽The Dow Jones has a hard time pushing for an offensive to overcome the resistance at 35547 points. However, sooner or later we see the course moving above that resistance and gradually build up new all-time highs until the area around 37607 points is reached.
Good times coming!

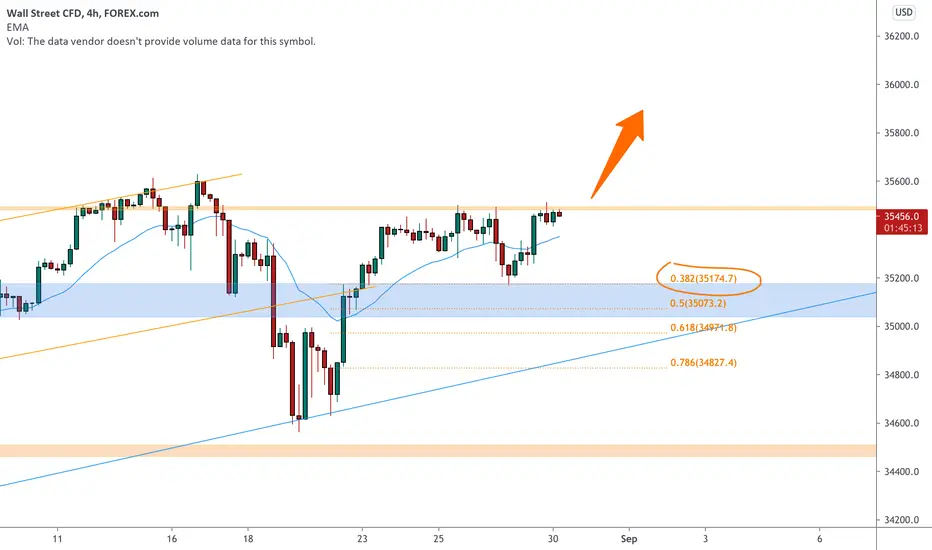
DOW an unstoppable bull? 🦐DOW after the recent retracement is consolidating below a minor resistance.
The price retraced and perfectly tested the support structure at the 0.382 Fibonacci level.
According to Plancton's strategy if the price will break above we will set a nice long order.
–––––
Follow the Shrimp 🦐
Keep in mind.
• 🟣 Purple structure -> Monthly structure.
• 🔴 Red structure -> Weekly structure.
• 🔵 Blue structure -> Daily structure.
• 🟡 Yellow structure -> 4h structure.
• ⚫️ Black structure -> >4h structure.
Here is the Plancton0618 technical analysis , please comment below if you have any question.
The ENTRY in the market will be taken only if the condition of the Plancton0618 strategy will trigger.
DOW JONES:FUNDAMENTAL ANALYSIS+PRICE ACTION & NEXT TARGET|LONG🔔U.S. stock indices rose in Monday trading after a volatile previous week. The Dow Jones Industrial Average gained 0.61% to 35335.71 points by close of trading on Monday.
Welcome back Traders, Investors, and Community!
Check the Links on BIO and If you LIKE this analysis, Please support our Idea by hitting the LIKE 👍 button
Traders, if you like this idea or have your own opinion about it, please write your own in the comment box . We will be glad for this.
Feel free to request any pair/instrument analysis or ask any questions in the comment section below.
Have a Good Day Trading !