DOW JONES - Wave Revision - Tracking Wave iiIn this idea I break all the waves since the March low to form a picture of what is coming next.
I believe we may be seeing the start of Wave 3 down in a larger C Wave.
The recovery since those lows looks corrective.
Please LIKE and FOLLOW to get notification of updates and future posts.
Dowjonesanalysis

DOW JONES - Tracking Minor Waves - Wave D In ProgressFollowing on from my previous DOW JONES Idea I am starting to see evidence that the bearish scenario is in play.
If you would like to learn how AriasWave works with regards to understanding corrections visit my website.
Please LIKE and FOLLOW to get notification of updates and future posts.

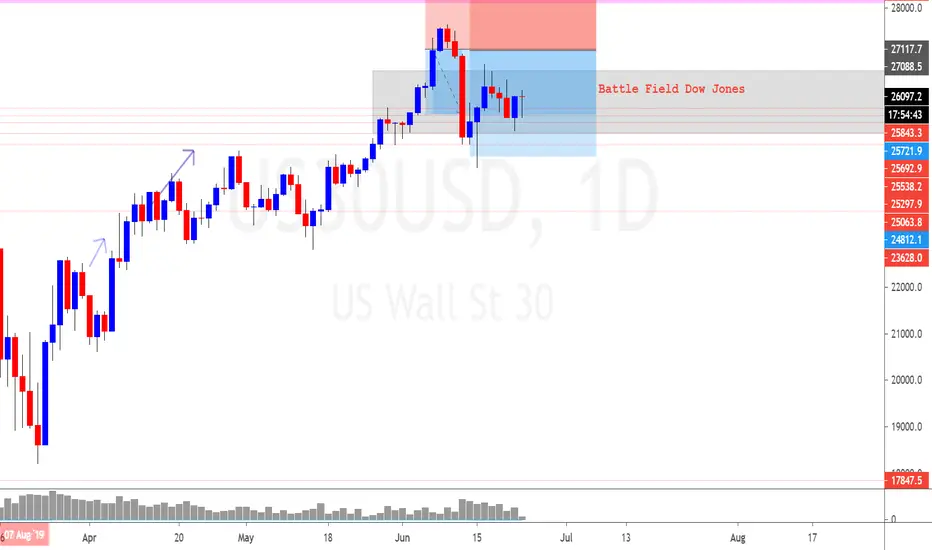
DJ30 Long Idea , Zones analysisWhen Technical Analysis Says Start Worrying and go short there where you shoud be smart and find Zones where big Players are waiting to buy .
Good Luck .

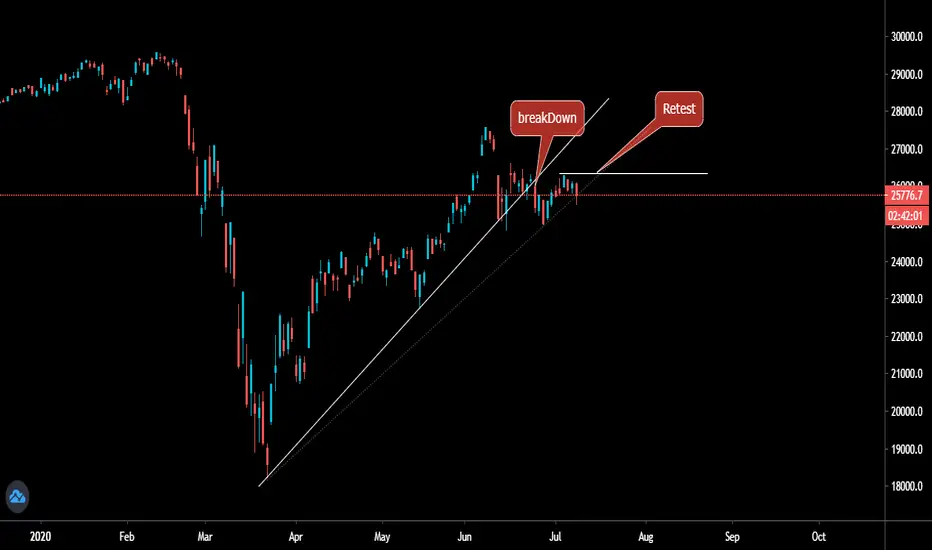
Dow Jones Bearish Setupif we see breakdown than price almost retest at the breakdown and going down is actual low coming
Dow Jones... Trading Setup for July 2020Last Close : 25746 (03 July 2020)
For the Month of July 2020
For the month July 2020 Super Bullish above 26455 only.
Bulls will loose some ground whenever trades below 25690 levels.
Trading Levels for the Week 06 - 10 July 2020
Bulls in control above 25690 levels....
Below 25690 levels.. likely to drift down to 25380 - 25320 levels...
Below 25320 super bearish.....
Every week will try to update trading levels to this study...
Like... Share... Follow... Lets Make wealth together..

DOW JONES - Wave Revision - Bearish ScenarioThe recovery since the March low has been largely choppy and corrective so it's hard for me to maintain a bullish view.
I am however seeing Red A-B-C in place and working within Red Wave D.
Wave (A) is a weird impulsive move which I have no choice but to label it as is.
That means we are working in the (C) Wave of Magenta Wave A.
I am not fully convinced on the validity of Wave (C) however at this stage this is purely an idea until we see confirmation.
We need to see price action head towards 27100 area to confirm that this is a zig zag.
I cannot think of another possible count for these waves at this stage so lets see what happens next.
Please LIKE and FOLLOW to get notification of updates and future posts.

DOW JONES GOOD LUCK .Here are some ideas to get the most out of it and also to give good results,
I sincerely hope you enjoy it and give you good ideas and lots of things. ... Besides, do not hesitate to like and share this analysis & thank you the winning investors .

DOW 15MIN TIME FRAMEHello traders, here is the analysis from our team :
We need a pullback above 25945 before entry.
Let us know in the comment section below if you have any questions.😉

Dow aka US30 Possible swings in upcoming weeksHey everyone,
Dow looks weak at this point. Trend line resistance is on 26352 and price can give a short term down move from here. The index major support is on 24800.

DOW JONES - Tracking Minor Waves - E Wave Still UnfoldingCheck out the latest update for the DOW JONES.
We are still working within (B) wave of Red Wave A.
Please LIKE and FOLLOW to get notification of updates and future posts.

Dow Jones US Stock Market (Is US-China trade deal over?)View On Dow Jones US Stock Market (23 June 2020)
Is US-China trade deal over?
It doesn't really matter. Market Makers will eat retail traders anyway.
Why? It is because retail traders usually buy into a pipe dream such as 1:5 Risk: Reward ratio with 30 pips SL in the hope to get 150 pips TP.
This is exactly just happened. The Market just made a blip on the early Asian session to eat both long and short positions with tight stop loss (SL).
The Morale of the story: Always Watch You Risk Management and Trade Expectation.
As for Dow Jones, I see 25k as good support while 26300 as a good resistant.
We shall see more movement as the week develops.
Let's see.
DYODD, all the best and read the disclaimer too.
Feel Free to "Follow", press "LIKE" "Comment".
Thank You!
Legal Risk Disclosure:
Trading foreign exchange or CFD on margin carries a high level of risk, and may not be suitable for all investors.
The high degree of leverage can work against you as well as for you.
Before deciding to trade foreign exchange you should carefully consider your investment objectives, level of experience and risk appetite.
The possibility exists that you could sustain a loss of some or all of your initial investment and therefore you should not invest money that you cannot afford to lose. You should be aware of all the risks associated with foreign exchange trading, and seek advice from an independent financial advisor.
DISCLAIMER:
Any opinions, news, research, analyses, prices or other information discussed in this presentation or linked to from this presentation are provided as general market commentary and do not constitute investment advice.
Sonicr Mastery Team does not accept liability for any loss or damage, including without limitation to, any loss of profit, which may arise directly or indirectly from use of or reliance on such information.
DOW JONES - Tracking Minor Waves - Wave (B) Looks CompleteI am expecting a move down in Wave (C) of Red Wave A.
In this video I outline some evidence for your consideration.
Target: 23782
See bigger picture below in related ideas.
Please LIKE and FOLLOW to get notification of updates and future posts.

US 30/Dow Jones - AnalysisHello traders, here is the analysis from our team : We need price to push above 26024, pullback above this area. Then re break for nice run. Good luck today.
Let us know in the comment section below if you have any questions.😉


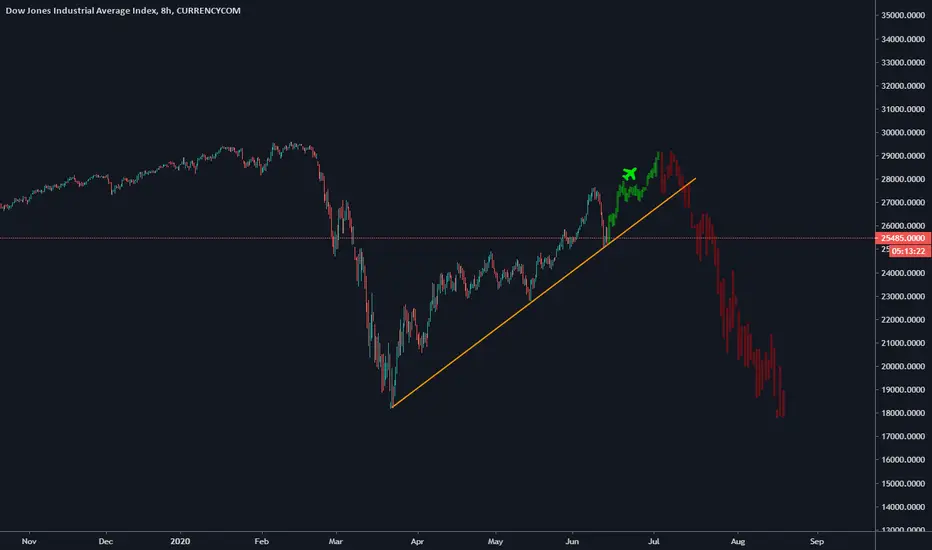
DOW JONES - WAVE 3 SINCE 1950 ENDING JUNE\JULY 2020If my extensive DOW JONES analysis is anything to go by then it tells me that we are now at the end of the fifth wave of the Green Wave 5 of the Blue Wave 3 which started in 1950.
If you have not seen my ULTIMATE DOW JONES ANAYLSIS VIDEO I suggest you check it out below.
According to my knowledge and observation on waves, the correction at the end of 5 waves always falls back to the 4th wave of the previous 3rd wave.
In the DOW JONES this is would be the GFC low of approximately 6456.
I predict this top will occur some time before or right at the end of the month.
Waves tops and bottoms tend to coincide with the start or end of months or quarters or in this case financial year.
I believe this is an especially important time to review your investment portfolio.
I am not about doom and gloom, I do believe after this correction is over we will see a major bull market.
I do not have biases I just use the evidence provided by strategic wave analysis.
Please LIKE and FOLLOW to get notification of updates and future posts.

DOW JONES - Wave Revision - Tracking Minor WavesCheck out THE ULTIMATE DOW JONES ANALYSIS VIDEO below to see the bigger picture.
So we are working within Blue Wave 2 in Red Wave A.
Red Wave A will likely be the largest so this has all the signs of a Wave 1 - 2 set-up .
We are way ahead of this so we have time to prepare for the move up in Blue Wave 3.
For now expect the move up to be the magenta E wave of wave (B).
Some will likely think this is the move up coming thanks to the classic Wave E fake out trick .
After this I expect the C Wave to take us down to the where most corrections fall back to which is:
The fourth wave of the previous third wave.
This also has confluence with the 50% retracement level so keep an eye out for that one.
Getting too ahead of yourself by being impatient is a sure fire way to kill your account.
Wave knowledge helps but so does money management.
Please LIKE and FOLLOW to get notification of updates and future posts.

Dow aka Us30 possible trade setup for July MonthHi,
US30 is not our trading script but it can affect the world market. Just tracking DOW to get an idea for our Market. Here is the July Month Possibility.

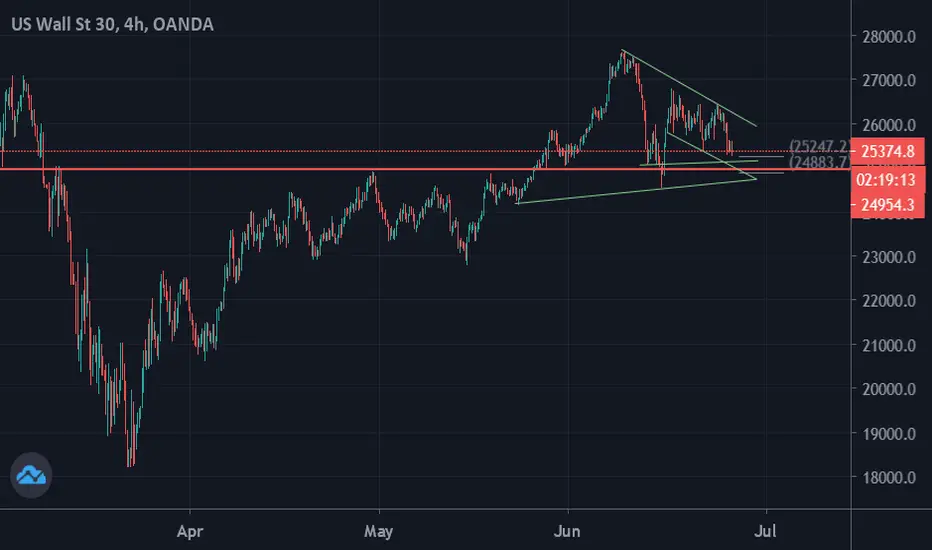
Dow ... are bears in control yet ???Observations : as suggested in the last study .... Dow weak below 26000...
Cmp 25350.......
Now we are staring at 25247 levels which is important support...
if breaks 25247 we slowly drift down to 25130/ 24960 levels....
Below which all hell break loose for Bulls.... (Closing basis)
Buliish only on any close above 25737....
😯 Uh Ohhhh! (DJI)💰 LET'S GET INTO SOME DOW JONES ANALYSIS!💰
1️⃣ First off SMASH that LIKE BUTTON & Give us a FOLLOW for DAILY ANALYSIS! 👍
- The 3 day is starting to show signs of blood as it is the first start to red since the bottom.
- I've been bearish on a lot of my post for the longterm approach.
- DJI been short since 26,990. The close at the end of this week will tell us a lot on how the 3 day wants to lead us into the weekly chart.
Best of luck to you and all of your trades this week! 🤜
Drop your charts and comments down below, share with us what you think is going on in the markets! ❤❤❤
Thanks for checking out our analysis! ✌😁✌
🥇MLT | MAJOR LEAGUE TRADER

🤔 Long-term View Still Early To Call. (DJI)💰 LET'S GET INTO SOME DOW JONES ANALYSIS!💰
1️⃣ First off SMASH that LIKE BUTTON & Give us a FOLLOW for DAILY ANALYSIS! ❤❤❤
(Overall Market Sentiment) 🤷 Neutral
- If you've been keeping up with the MLT Trades then you know that we got short avg. Price 26,990 on a shorter timescale.
- Overall based off the 3 day chart you can see that the candles are still green, no crossover and that the ema dots have not completely lined up just quite yet.
- We are in a more aggressive position on the wallet timeframe and for now will continue to hold and get a feel for how this week wants to start out.
- For a longer term confirmation we are going to want to see the ema dots align red, candles shift red and crossover.
- On the shorter timeframes based off my previous post on a lot of the market you know that we are leaning bearish. We won't know until long term confirmation.
Best of luck to you and all of your trades this week! 🤜
Drop your charts and comments down below, share with us what you think is going on in the markets! ❤❤❤
Thanks for checking out our analysis! ✌😁✌
🥇MLT | MAJOR LEAGUE TRADER


US30 (DOW JONES) BIG DROP NEXT WEEK. WAIT FOR BIG DROPBig incoming drop next week as we see $ is start recovery on Friday
best and safe entry if it break 25200 with low risk and higher rewards
we appropriate ur likes & comments
Follow us for more updates !!!!
