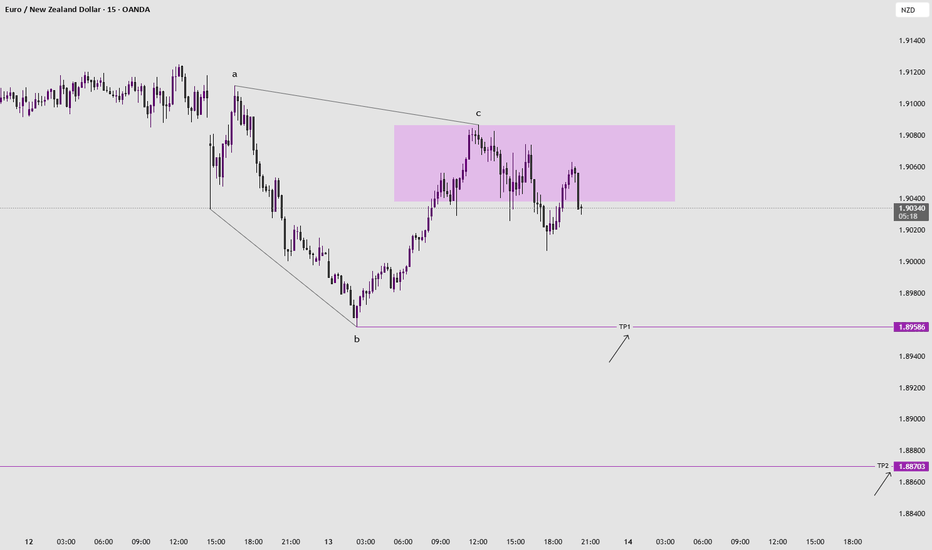
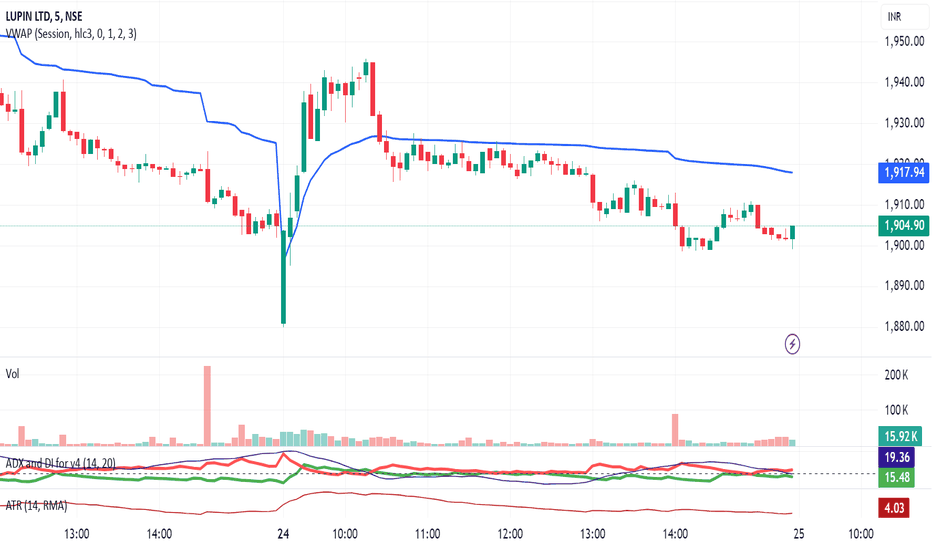
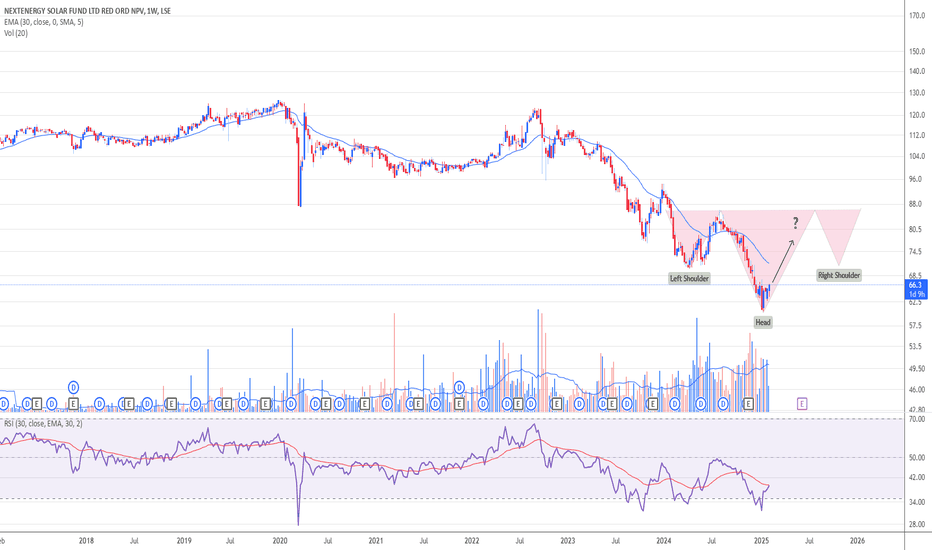
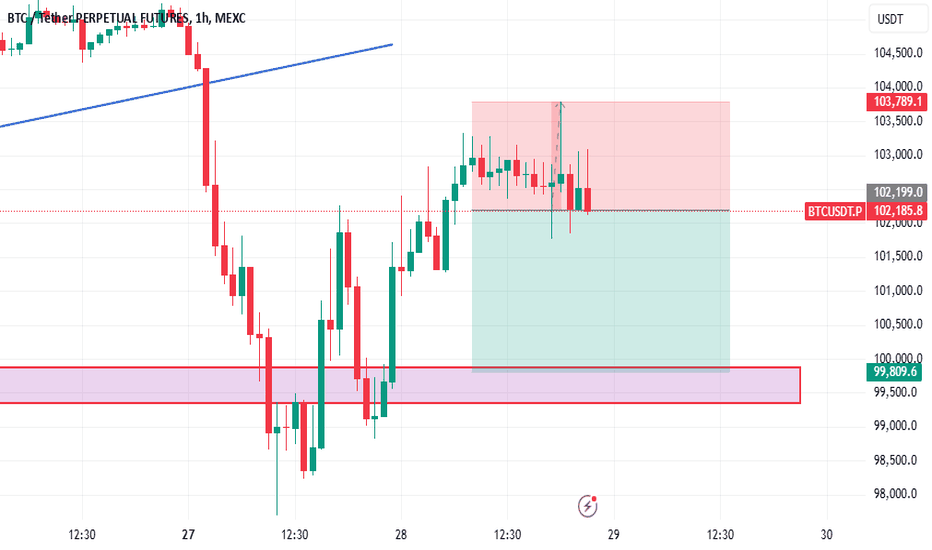
Downtrend
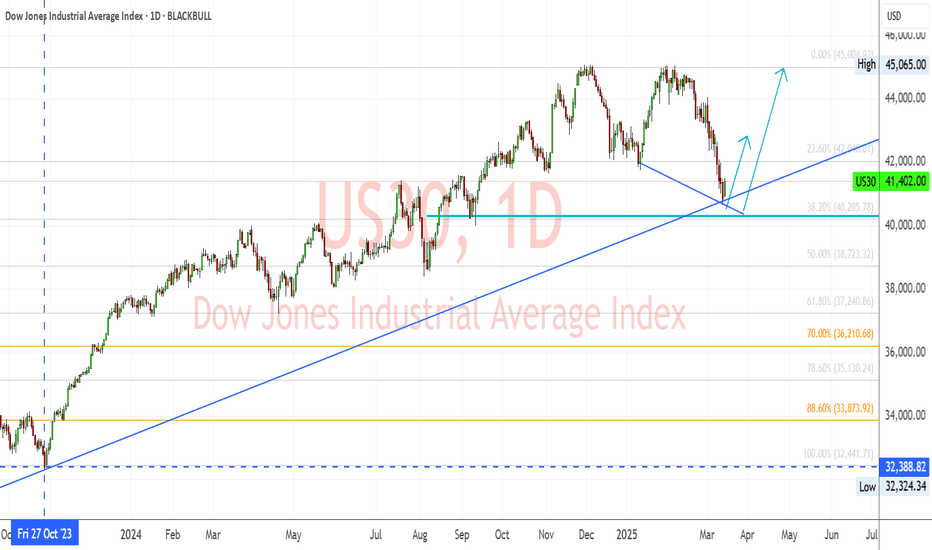
US30 Rebounds from Key Support – Bulls Eyeing New HighsKey Support & Trendline Confluence:
The price recently bounced off the long-term ascending trendline, which has been a strong support level since late 2023.
The 38.2% Fibonacci retracement level ($40,205) provided additional confluence for a potential reversal.
Resistance Levels & Breakout Potential:
Immediate Resistance: $42,000 – A break above this level could confirm a bullish continuation.
Major Target: $45,065 – If momentum sustains, this all-time high could be tested soon.
Bullish Scenario:
A successful breakout above $42,000 could lead to an accelerated move toward $45,065 and beyond.
The trendline’s support indicates that bulls remain in control, and the recent rebound suggests renewed buying interest.
Risk Management & Confirmation:
Bullish confirmation: Sustained price action above $41,500 with strong volume.
Invalidation level: A breakdown below $40,000 could indicate a potential trend reversal.
Conclusion & Strategy:
Short-Term: Monitor price action around $42,000 for breakout confirmation.
Mid-Term: Expect a bullish move toward $45,000+ if the trendline holds.
Long-Term: If price breaks all-time highs, further upside potential is possible.
🚀 Bullish Confirmation Above $42,000 | ⚠️ Caution Below $40,000
BITCOIN MARKET ANALYSIS: CRASH OR NEXT BIG MOVE?BITCOIN MARKET ANALYSIS: CRASH OR NEXT BIG MOVE
Expert Insights and Key Trends
Is Bitcoin poised for a significant downturn or a major upward swing? In this in-depth analysis, we examine:
- Current Market Trend: A thorough review of Bitcoin's present market trajectory.
- Critical Support and Resistance Zones: Identification of key levels that may influence future price movements.
- On-Chain Analysis and Whale Movements: Expert analysis of on-chain data and whale activity.
- 2024 Bitcoin Price Prediction: Insights from industry experts on Bitcoin's potential price trajectory.
Stay Informed, Stay Ahead
Whether you're a trader or long-term investor, this analysis provides crucial information to help you navigate the Bitcoin market.
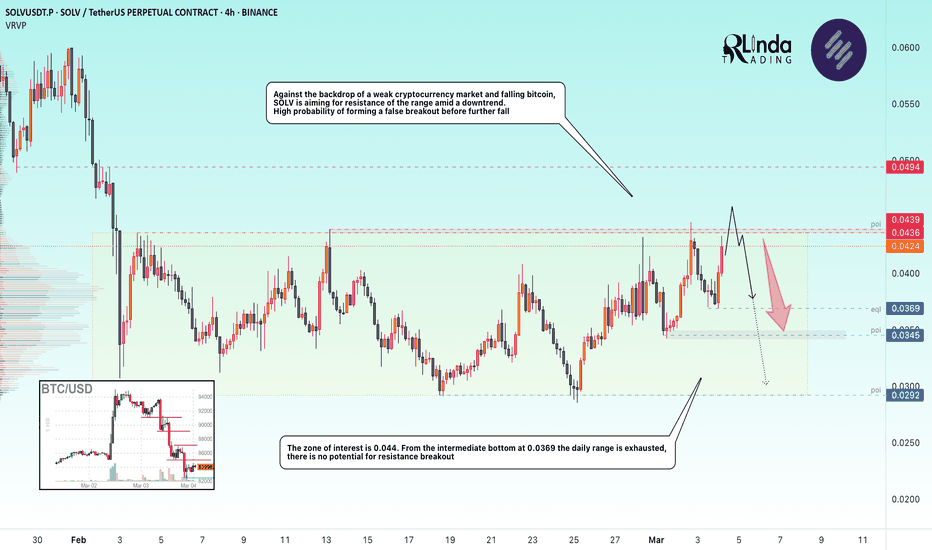
SOLVUSDT → Retest of resistance in a bearish trendBINANCE:SOLVUSDT is strengthening within a neutral range, which is formed amid a downtrend. Cryptocurrency market quickly sells off potential after Sunday's news
Bitcoin is back to the selling zone, under the 90K area. A subsequent decline in the flagship could negatively impact the entire market.
SOLV is forming a range of 0.044 - 0.0292. The price is strengthening and tends to the zone of interest and liquidity. Against the background of key preconditions (downtrend, weak market, absence of driver, falling bitcoin) we can assume that the coin has no potential for further growth and the current maneuver may end up with a false break of resistance followed by a fall.
Resistance levels: 0.0436, 0.0439, 0.0494
Support levels: 0.0369, 0.0345
From the opening of the session, the daily ATR will be exhausted by the time resistance is reached, thus there will be no potential for resistance breakout. High probability of a bounce from 0.0436-0.0439 with the purpose of further fall to the key zones of interest located below.
Regards R. Linda!
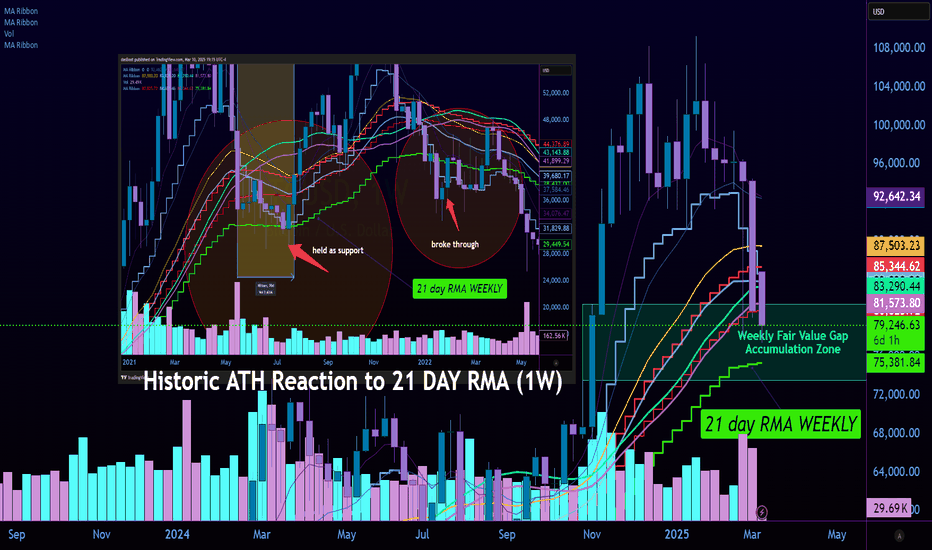
Bottom Still Not in, Drop could hit low 70kBTC is falling due to markets and investor fear. The Bottom still hasn't travelled the length of the the FVG on the Weekly Chart that will be attractive to smart money and institutional investors
When looking at the Historical Data it shows that the price had a pullback and found resistance at the Weekly 21 day RMA .
Currently that looks like a point where Resistance once again will be established when combined with the FVG on the Weekly, Price will likely fall below and recover to hold the 21d RMA
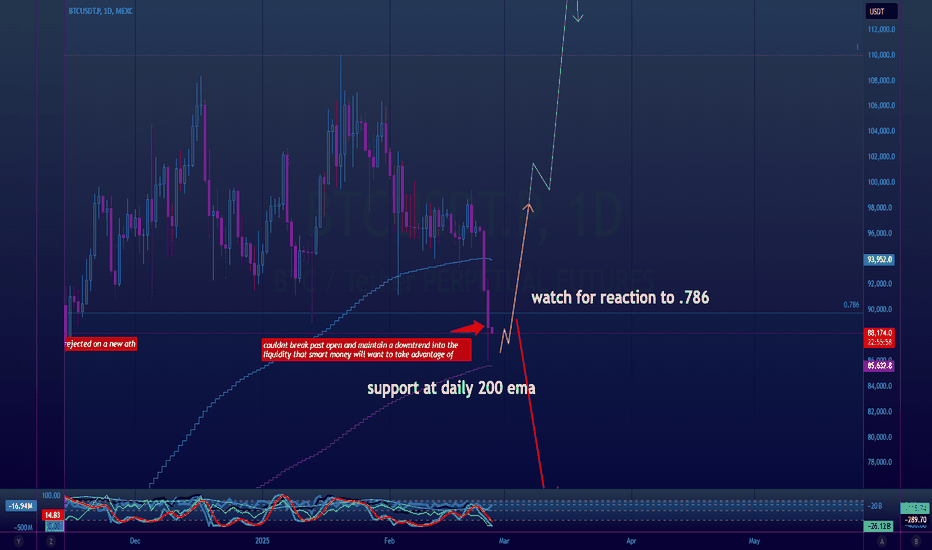
btc finds 200 ema support, whats next?As I have been posting in these "Ideas" for the past few weeks about market direction and where the price for BTC will go. It now has come to pass where the 200 EMA has been tested and support has been found, It however has not generated any relief among buyer sentiment unable to push price above the previous days close leaving the digital asset to continue to bleed out and cause positions from all the 93k Bulls to liquidate.
Its a shame people cannot make the connection that the only way price can go higher is to go lower in a market. That Is why I am going to warn people about where we may go , I believe the 200 EMA will be tested again and if support is broken it will send is into the low 70k area where there are open orders and It is possible this may happen. The Bull market support band is the 200EMA however there may be institutional money that may drive us down to cause massive liquidations and fear and panic among those holding bags while greed causes big players to push more into the fringe of where we can maintain a recovery.
Watch for a retest of the 200EMA . which is a bit of a fuzzy zone , use the high and low to denote the area for support as well as keep an eye on the RSI and CCI , we are also watching on balance volume drop off which is not a great sign that there is market confidence however this will play out over the weekly and the weekly candle will start to materialize in the next few days.
Review and plan for 25th February 2025 Nifty future and banknifty future analysis and intraday plan.
This video is for information/education purpose only. you are 100% responsible for any actions you take by reading/viewing this post.
please consult your financial advisor before taking any action.
----Vinaykumar hiremath, CMT
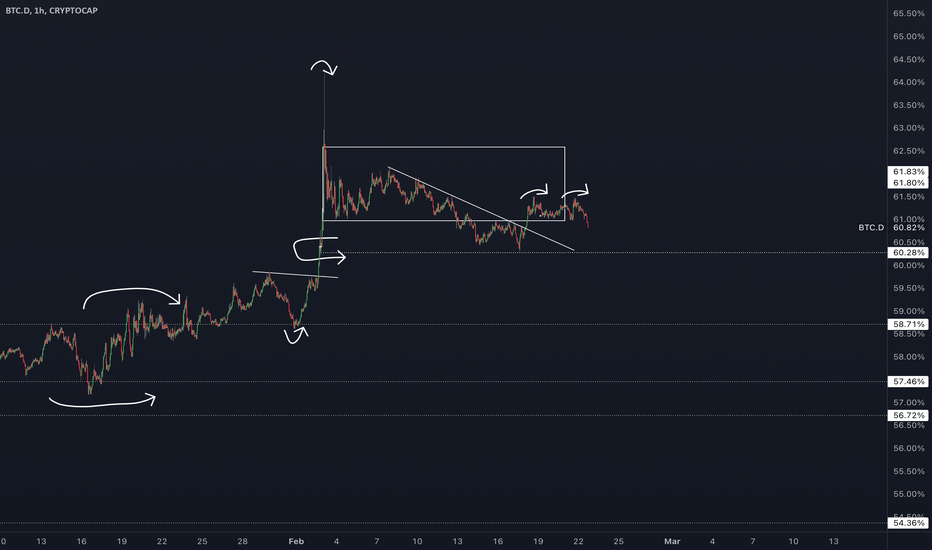
Bitcoin Dominance Likely to Drop – Key Levels to WatchBitcoin dominance is showing signs of weakness and may be heading for a drop. The dominance chart suggests a potential reversal as key resistance levels are being tested and rejected.
Should monitor price action closely. If BTC.D falls further, altcoins might experience a strong relief rally. Stay prepared!
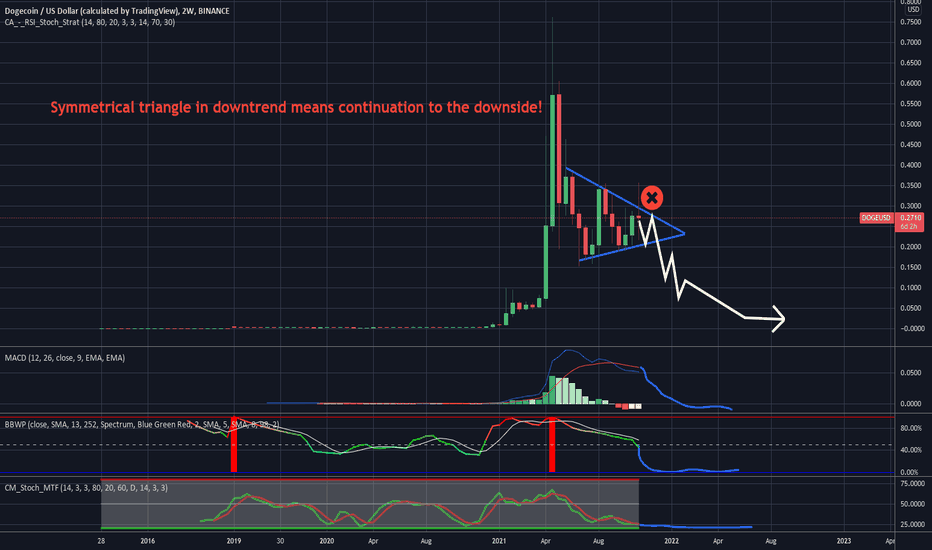
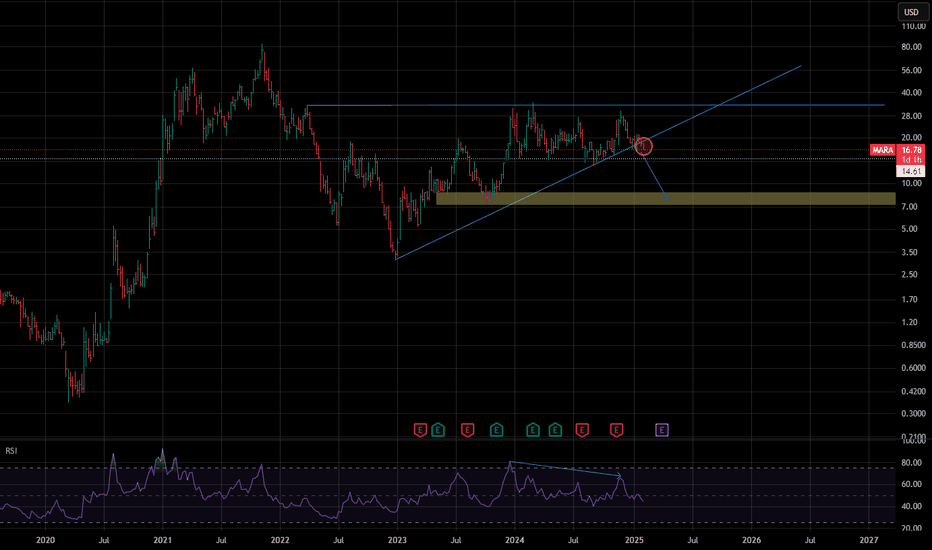
DOGE RALLY IS OVER Multi Year Correction/Consolidation ComingDOGE was fun if you knew how to trade it. The run and hype is over. The retail FOMO investors that completed wave 5 blow off top are the only ones holding the bags now. Indicators are showing real weakness and heavy selling pressure. The symmetrical triangle in a downtrend means continuation to the downside. Not financial advice. Have fun and don't lose your shirt.
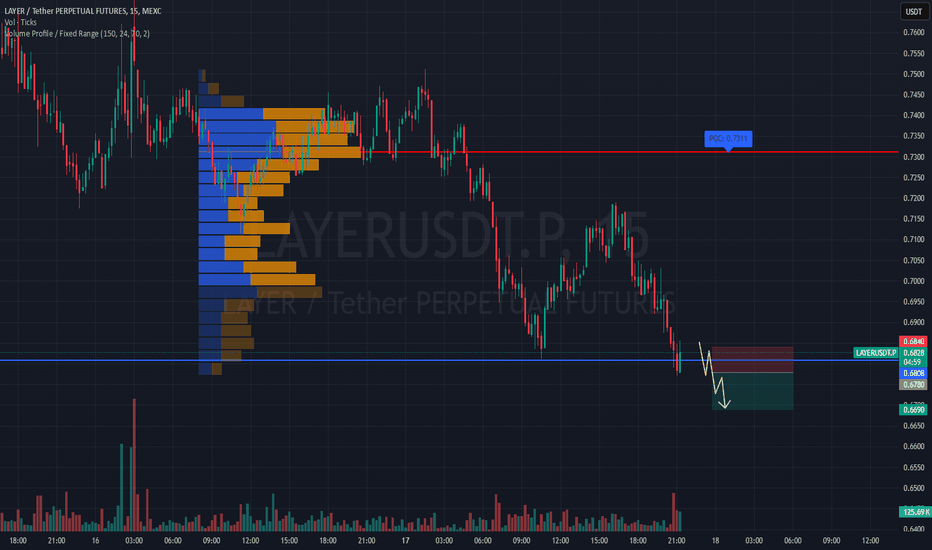
#LAYERUSDT remains weak — expecting further downside!This is a quick trade designed for a fast entry and exit with profit.
📉 SHORT #LAYERUSDT from $0.6780
🛡 Stop Loss: $0.6840
⏱ 15M Timeframe
✅ Overview:
➡️ #LAYERUSDT remains in a downtrend, trading near $0.6780, which could act as a short entry point.
➡️ POC (Point of Control) at $0.7316 confirms a high liquidity zone above the current price, indicating strong selling pressure.
➡️ The price failed to hold above the previous consolidation zone and continues downward.
➡️ If the price breaks below $0.6780, a further decline is expected, targeting lower support levels.
⚡ Plan:
➡️ Enter short upon breaking $0.6780, confirming the downward trend.
➡️ Risk management via Stop-Loss at $0.6840, protecting against a false breakout.
🎯 TP Targets:
💎 TP1: $0.6690
🚀 #LAYERUSDT remains weak—expecting further downside!
📢 #LAYERUSDT is under strong selling pressure. If the price breaks $0.6780, increased momentum may push it toward $0.6690. However, if it reclaims $0.6840, a short-term rebound could occur.
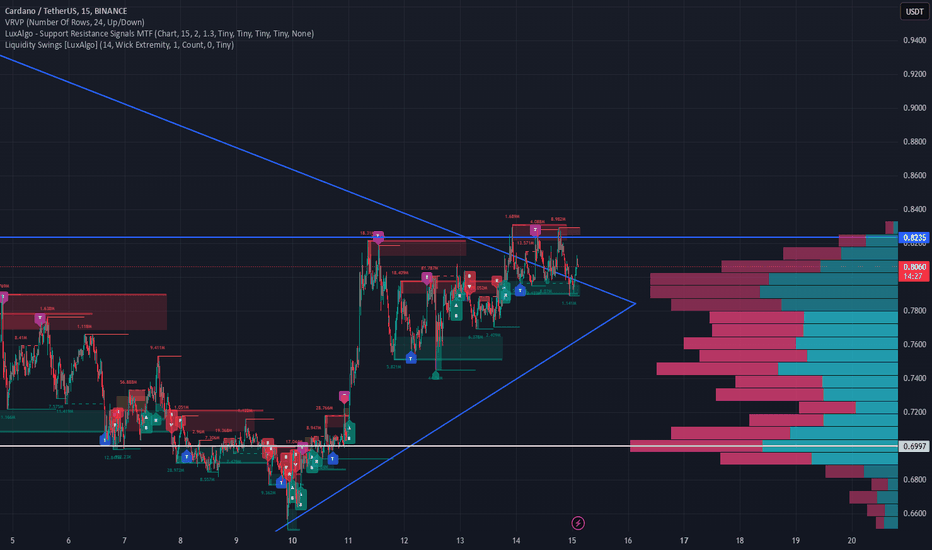
Fake Breakout Alert: Don't Be Fooled by the Deceptive Move!Hi Everyone,
While ADA looks bullish in a small time, in a daily chart still looking bearish ,
Do not get fooled by this fake move and the reason is , the market still need to get the longs as they are LOTs.
If you wish to open a short position make sure you don't use all your capital at once, spread it as it will bring you more gains and minimise your risk.
For sure we do not suggest you open long position , but the decision is up to you.
Market at the moment looks a bit manipulated ,so be extra cautious!
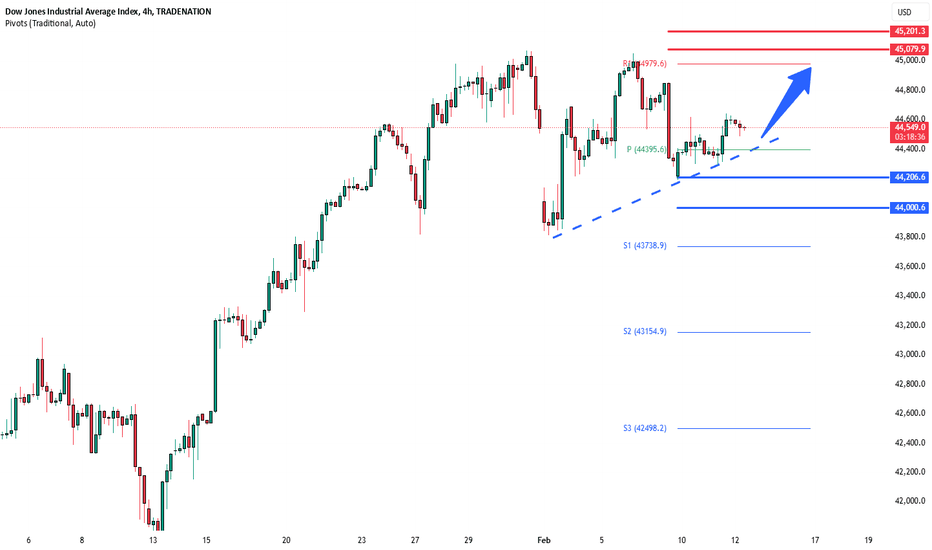
Dow awaits US inflation reportThe Dow (US30) index price action sentiment appears bullish, supported by the longer-term prevailing uptrend. However, since reaching an all-time high on 04th December 2024 the Dow index price action is consolidating in a sideways trading range.
The key trading level is at 44206, which is the current swing low. A corrective pullback from the current levels and a bullish bounce back from the 44206 level could target the upside resistance at 44980 followed by the 44080 and 44200 levels over the longer timeframe.
Alternatively, a confirmed loss of 44206 support and a daily close below that level would negate the bullish outlook opening the way for a further retracement and a retest of 44000 support level followed by 43740.
This communication is for informational purposes only and should not be viewed as any form of recommendation as to a particular course of action or as investment advice. It is not intended as an offer or solicitation for the purchase or sale of any financial instrument or as an official confirmation of any transaction. Opinions, estimates and assumptions expressed herein are made as of the date of this communication and are subject to change without notice. This communication has been prepared based upon information, including market prices, data and other information, believed to be reliable; however, Trade Nation does not warrant its completeness or accuracy. All market prices and market data contained in or attached to this communication are indicative and subject to change without notice.
GBP-JPY Will Keep Falling! Sell!
Hello,Traders!
GBP-JPY is trading in a
Downtrend and the pair
Broke the key horizontal
Level of 189.000 and the
Breakout is confirmed so
We will be expecting a
Further bearish continuation
Sell!
Comment and subscribe to help us grow!
Check out other forecasts below too!
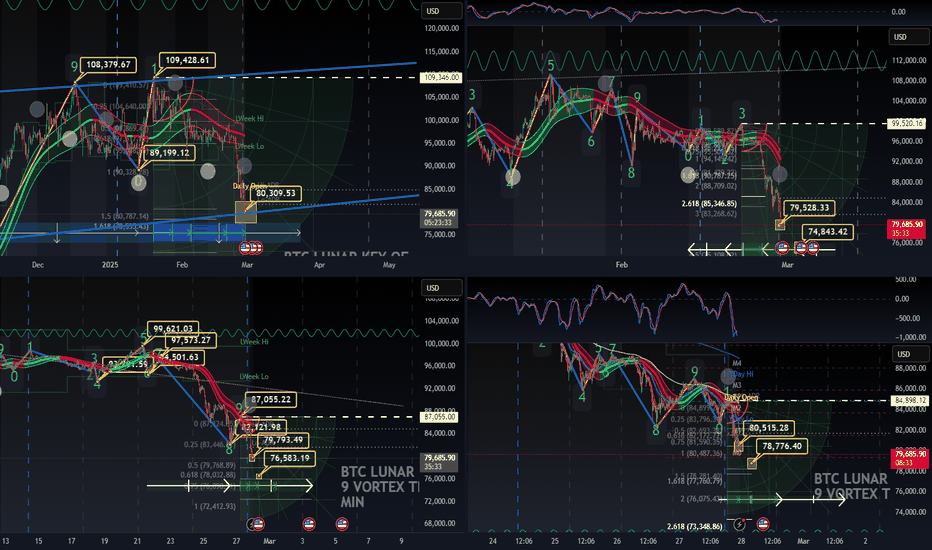
BTC BOTTOM 81500 ? Liquidity Hunting
BTC has been in a recent downward trend leaving traders dazed after our recent bonanza in price movement on the king crypto, alts have also made gains however we are seeing some winners emerge out of the pack.
BTC will always dominate market cycle and this continues to drive market price direction in all digital assets leaving bitcoin as our compass if you are trading. Investment is and can be unbound by btc on larger market cycles for long term hodl'rs
There is Liquidity in them there hills someone shouted as everone made there way to the PC for the Digital GoldRush, AI algos, Bots, Copy Trades, Big institutional cash injections and ETF's , it is a new day but liquidity will always be where the smart money trys to move the market on your dime.
We have overhead FVG from a 4hour, a large one that if we bounce off soft resistance at ~101,500 we may see smart money Sell into that area and if we do it seems to reason the whales are after all those unfilled orders in the 80k zone. Will we see BTC swing towards 90k - 81500? If we get movement into the bearish FVG above and cannot make new high market structure and a trend reversal we will ride this down trend into the 80's
Happy Trading
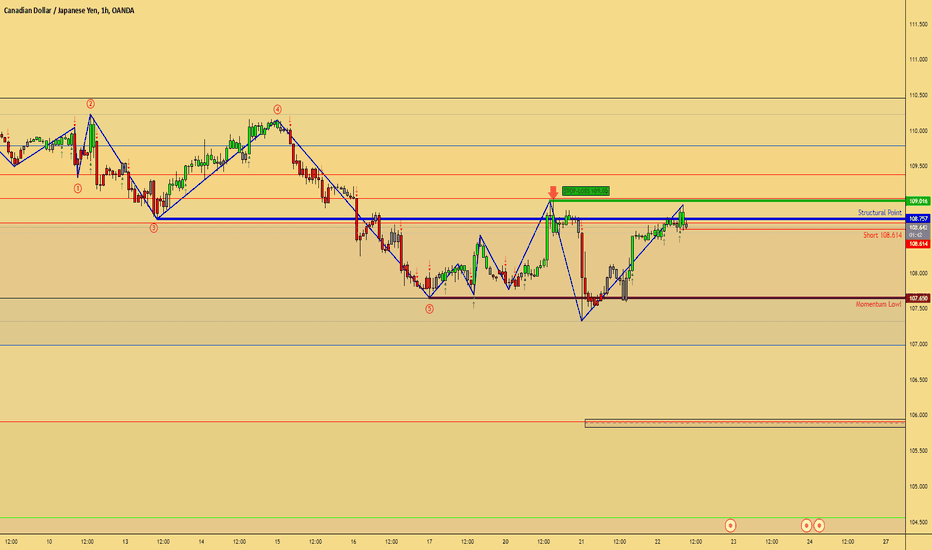
CADJPY Downtrend Analysis: Bearish Momentum ContinuesThe CADJPY remains in a strong downtrend after completing its first wave structure to the downside. The corrective wave offered no signs of a trend reversal, confirming the sellers’ dominance.
Yesterday, during the Tokyo session, a new bearish wave structure began, breaking below the first wave's momentum low. Wave 2 formed as a correction to Wave 1, creating an opportunity to look for short trades below 108.614. A break below 107.65 (momentum low) is expected, with a Fibonacci target of 61.8% as a likely end for the current wave.
Key levels to watch:
Entry: Below 108.614
Target: 107.65 and Fibonacci 61.8% level
Stop Loss: Above 109.05
Selling above 109.05 is not recommended.
Like, comment, and share your thoughts. Happy trading!
GBP_NZD MOVE DOWN AHEAD|SHORT|
✅GBP_NZD is trading in a
Local downtrend and the pair
Made a pullback and a retest
Of the horizontal resistance
Of 2.1900 and is going down
Already so we are bearish
Biased and we will be expecting
A further bearish move down
SHORT🔥
✅Like and subscribe to never miss a new idea!✅
