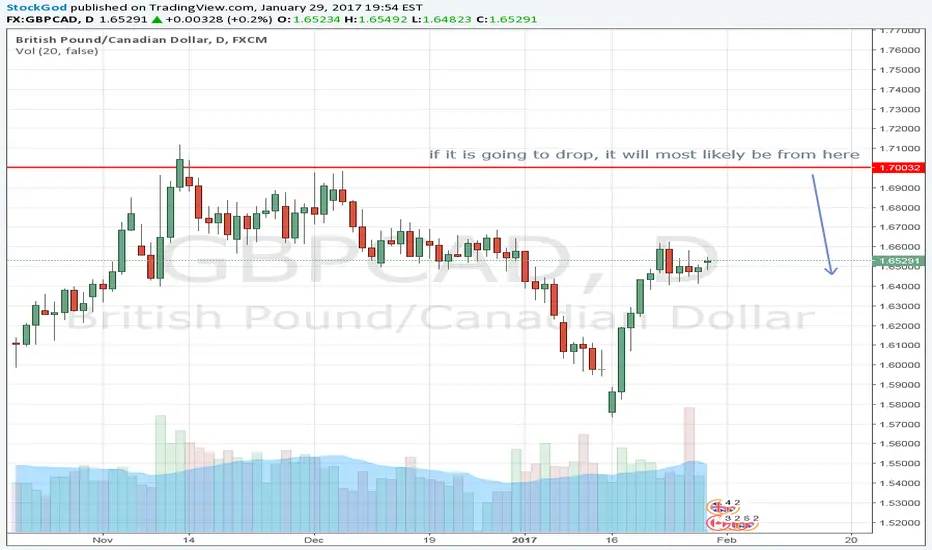
DROP
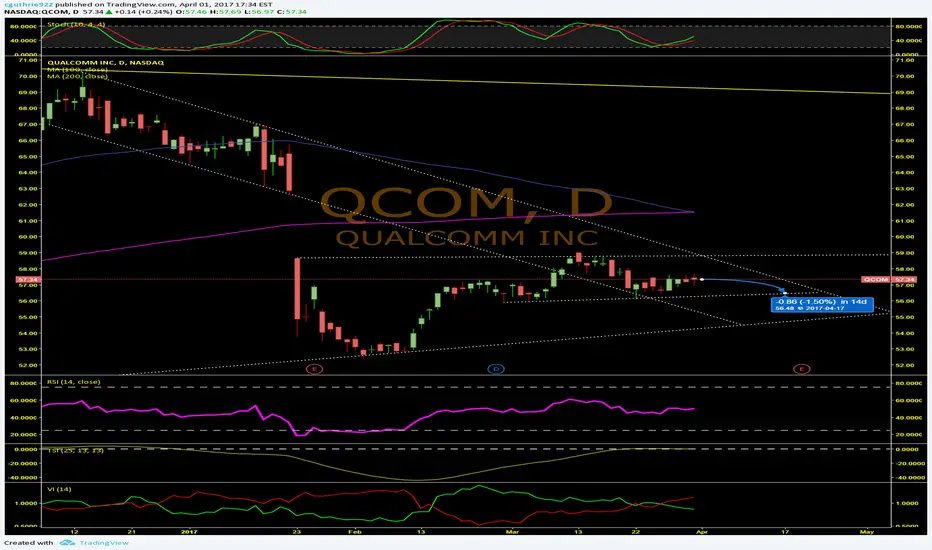
QCOM Treading Water For NowOn March 31, 2017 the Qualcomm Incorporated ( QCOM ) 100 day moving average (MA) crossed below its 200 day MA. Historically this has occurred 19 times and the stock drops at least 0.235%, with a median loss of 3.023% and maximum loss of 16.621 % over the next 10 trading days.
When we take a look at other technical indicators, the relative strength index (RSI) is at 50.3856. RSI tends to determine overbought and oversold levels. I personally use anything above 75 as overbought and anything under 25 as oversold. The current reading declares the stock is neutral.
The true strength index (TSI) is currently -0.0481. The TSI determines overbought/oversold levels and/or current trend. I solely use this as an indicator of trend as overbought and oversold levels vary. The TSI is double smoothed in its calculation and is a great indicator of upward and downward movement. The current reading declares the stock is neutral and has been floating there for almost two weeks.
The negative vortex indicator (VI) is currently 1.1147. The VI determines current trend and direction. When the positive level is higher than 1 and higher than the negative indicator, the overall price action is moving upward. When the negative level is higher than 1 and higher than the positive indicator, the overall price action is moving downward. The current reading declares the stock is trending downward.
The stochastic oscillator K value is 50.5088 and D value is 39.3695. This is a cyclical oscillator that is highly accurate can be used to identify overbought/oversold levels as well as pending reversals. I personally use anything above 80 as overbought and below 20 as oversold. When the K value is higher than the D value, the stock is trending up. When the D value is higher that the K value the stock is trending down. The current reading declares the stock has been trending up but is currently neutral on direction which will not last long.
Considering the moving average crossover, RSI, TSI, VI and stochastic levels, the overall near-term stock direction appears to be indiscernible. Based on historical movement compared to current levels and the current position, the stock could drop 1.5% over the next two weeks. The minimum drop the last five times this MA crossover occurred was around 2%.
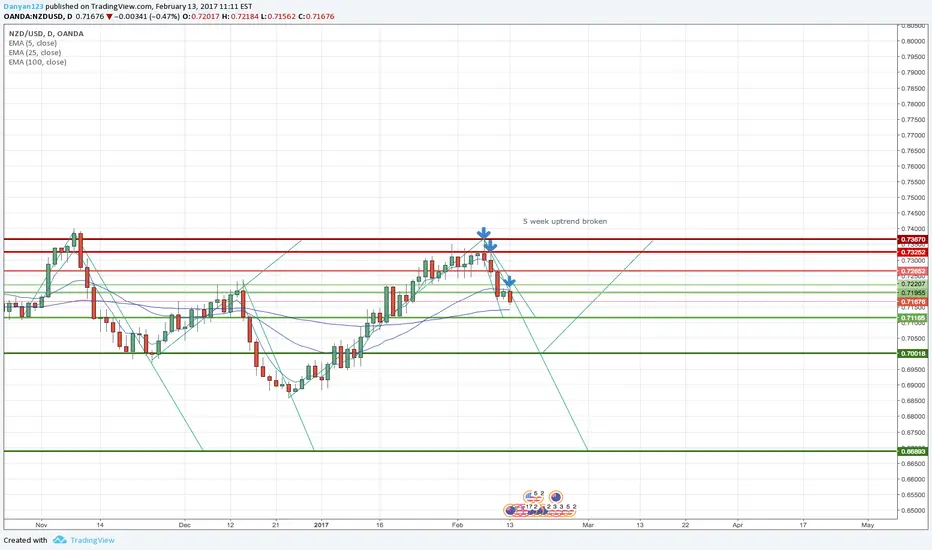
Reversals are always stronger than continuations 5 week uptrend broken when RBNZ announced they would keep interest rate the same.
This was followed by bad news and the RBNZ officials saying they want a weaker kiwi.
Could drop more so keep eyes open !
- Happy Trading !
"who da fuck are you" by Dillz Banks on spinrillaSell it, not much more to say than that.
#livefast #lol #bigbank
GBPJPY Low Risk High Reward ShortGBPJPY is bound to retest the downward channel, as it did when it broke out of the bottom last time. It is also right on the 200 4-HR SMA, which is acting as a tough resistance, as well as the supply zone.
My last short idea did hit my original stop, but I moved my stop up because I think this will be a huge move.
As always, use proper money management

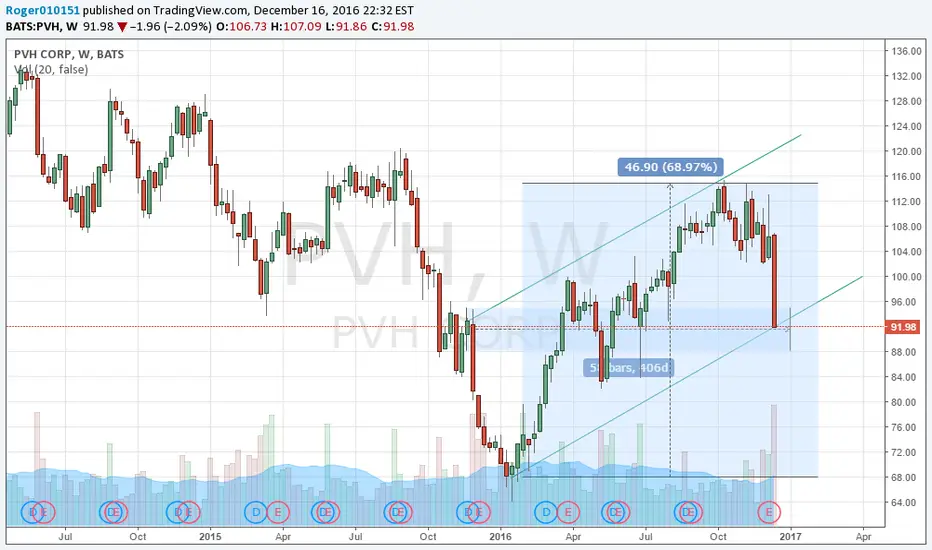
PVH monthly pattern, anyone else picking up on this big drop?This pattern has shown itself in a couple of stocks lately, think it wil hold for PVH? Has anyone seen any negative news for PVH?
LPI will drop in the twelve dollars Their is a very strong resistance level and it seems like LPI can't get passed it. I mean the stock tried several times and it didn't work. Now, it's losing momentum and its going to go back in the area of twelve dollars, where i drew the up channel's trendline. What do you guys think ?
Buying at twelve dollars may be a good thing.

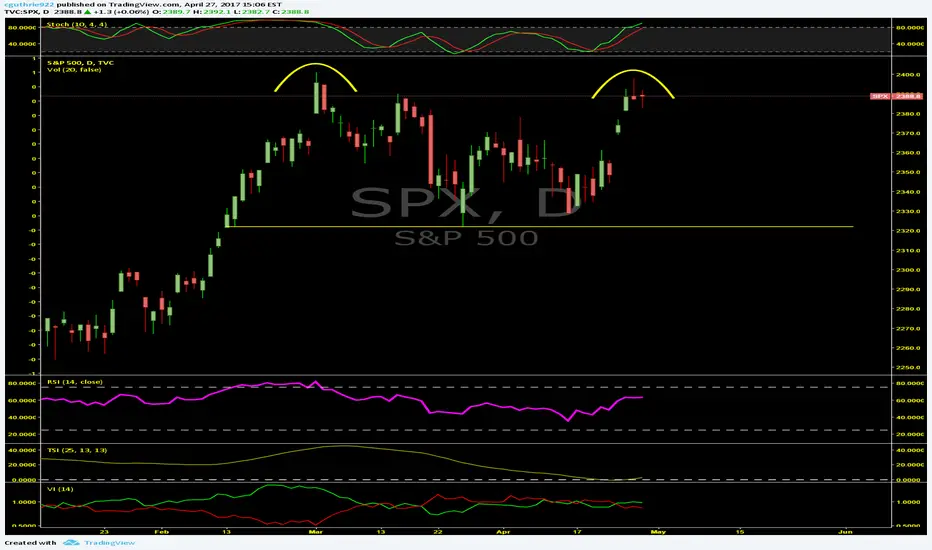
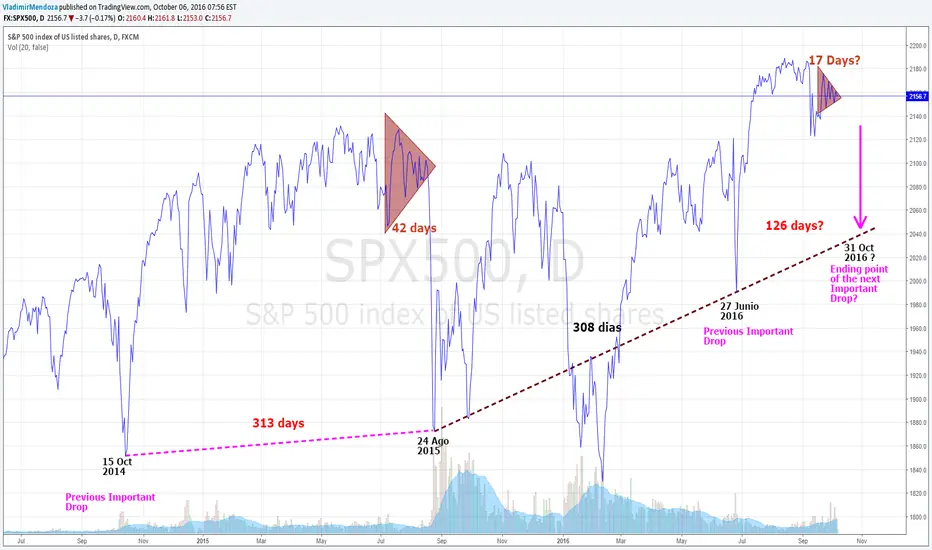
NEXT IMPORTANT DROP? - S&P500I find a possible similitary in two triangles. First triangle in July and August, second triangle is rigth now in process. First triangle was for 42 days and broke out and drop. Second triangle is in process. Will be a very soon break out in this triangle? I think that is possible.
I count the number of days from deep drop (Oct 15, 2014) to the end of first triangle (August 24, 2015) there is 313 days. Then I divided 313 days/ 42 days = 7,4523
If the new triangle stay for 17 days before begin drop, then 17 days x 7.45 = 126.65 days
June 27, 2016 + 126.65 days = OCTOBER 31, 2016 (Monday) (date of the deep point of next drop)
If we divide the numbers of days between October 15, 2014 and August 24, 2015 we have:
313/126 = 2.48
If we divide the numbers of days between August 24, 2015 and June 27, 2016 we have:
308/126 = 2.44
Very similar proportion.
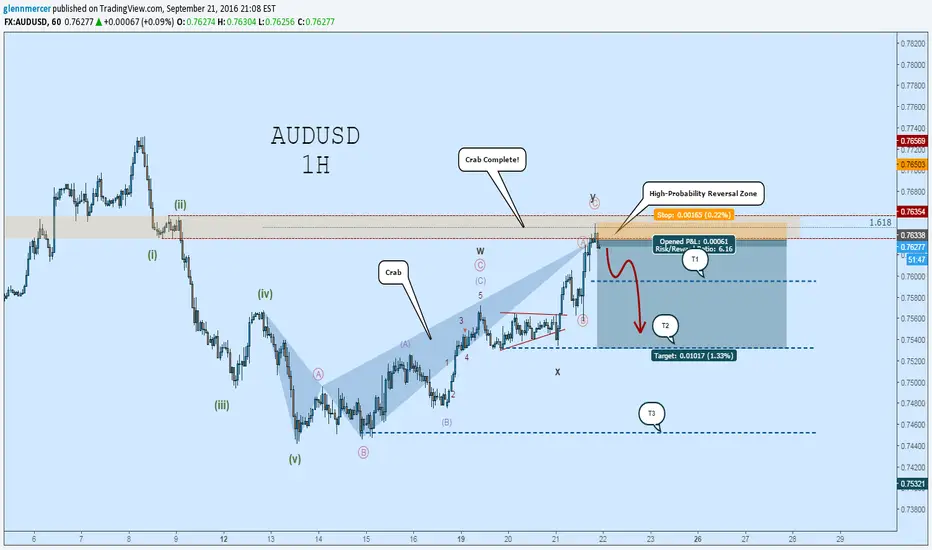
AUDUSD Short: Drop The Bass!Hey traders! A crab is complete on the 1H in addition to (possibly) the corrective wave structure. The bearish impulse suggests a potential turning point, so any price action above the beginning of the drop will invalidate the trade; hence Sl is placed at this level. ALSO, this reversal is occuring in a special zone, the wave-(ii) s/r zone, which adds to the probability of reversal here. Happy trading!
the KIWI to go short post NFP resultslooking at the current levels of resistance we may see an opportunity to short this pair on any pullback on a 4 hourly to 1 hourly timeframe after a strong sell off yesterday with a fully engulfing bearish candle.However
I would remain cautious until post NFP announcements .

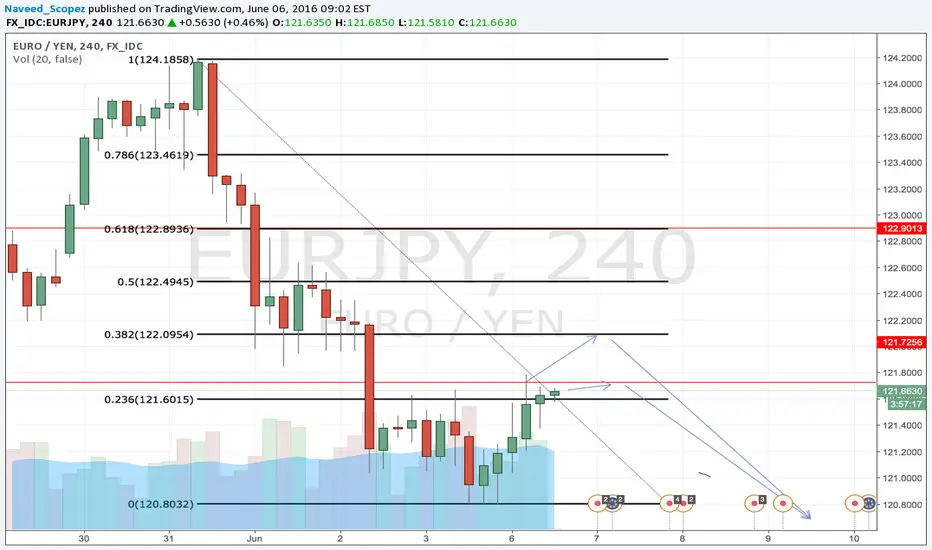
Eur/Jpy will Bounce and short!!High probability with many confluences to the naked eye, 4 hour price action will bounce of the 38.2 FIB zone or the daily resistance if broken the 238 FIB and then continue the downtrend, creating a short opportunity.

EURCHF Spike Short termI see a spike, and the EUR is supposed to be getting weaker. Be expecting a drop of 60 pips

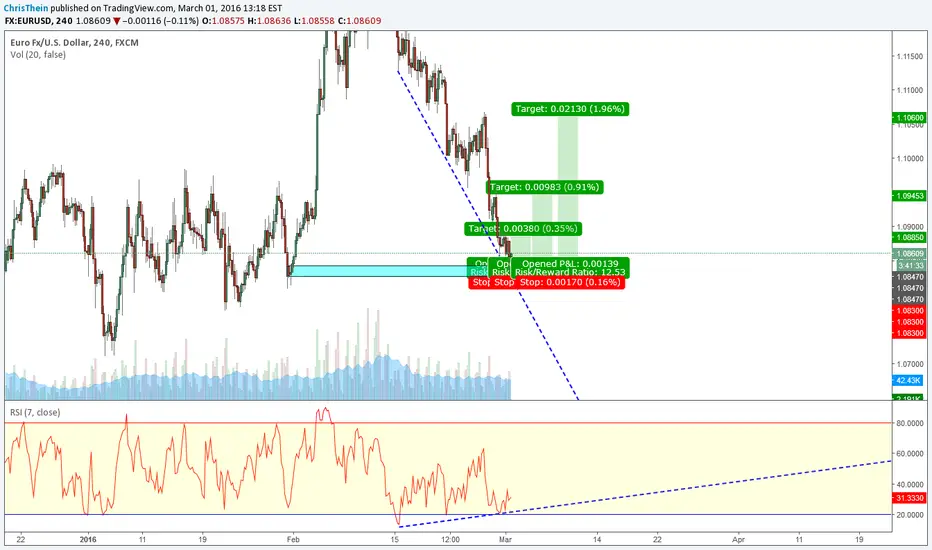
EUR/USD 240 Divergence with a Hammer at a Demand ZoneThere is some divergence on the 240 min chart between price and the RSI. Price rejected the Drop-Base-Rally around 1.0840's. I'm looking to get long at the 50% retracement of the Hammer candle wick at 1.0847 (check your data.) My stops will be just below the swing low at around 1.0830. I have a few targets at each of the swing highs (1.0885, 1.0943, and 1.1060) Good luck trading.
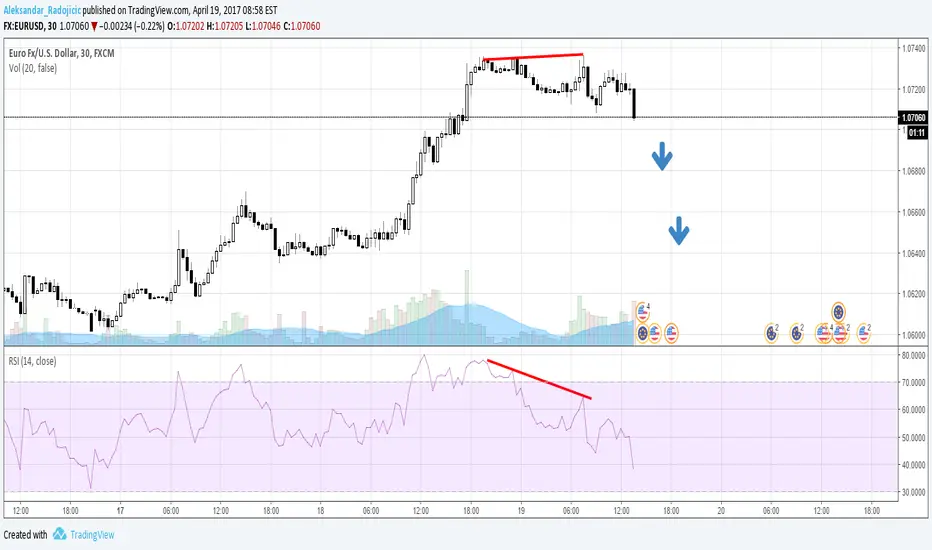
Bad news for shorts?Volume means activity. These volume spikes concern me - something happened. While I will never find out what exactly that was, judging by the fact that the first spike occured almost on the very top (left shoulder, even before I was bearish on this pair - which makes sense) and that we have just had the second spike at the bottom, after the pair fell considerably, I suppose... someone made a lot of money. Now why this someone has just closed his/her profitable short here? I guess he/she knows something. But what?
Actually I really want cable to drop to 1.35 and below, if possible. Sorry, good people of the UK. Hi, Mr. Soros!
P.S. Spikes like these can also be found of other pairs. And put together they make little sense ;)

It looks like a big drop ahead!!!Just my own thought on BTCUSD. It is very risky to enter long or short here anyway.

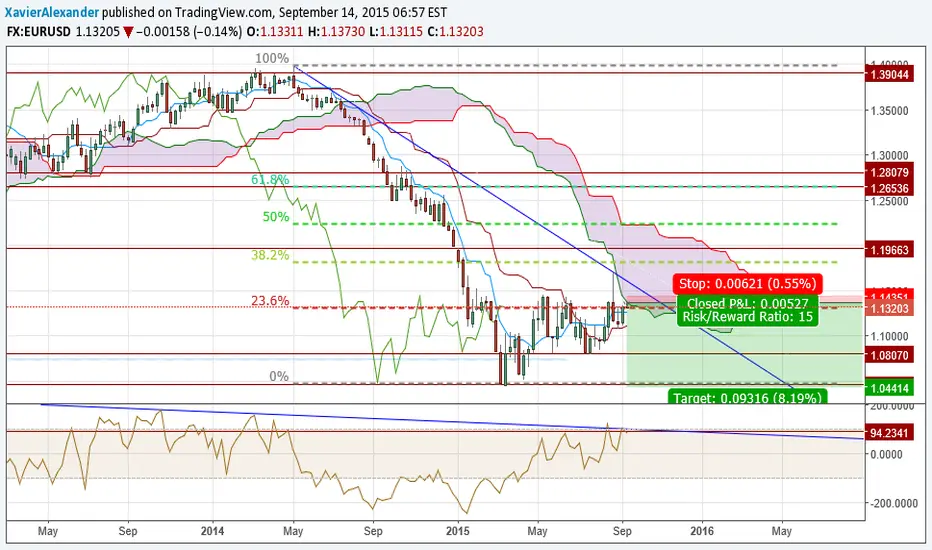
EURUSD SHORT LONG TIME FANTASTIC POTENTIAL STRONG LEVELS £$ Drawn S/R horizontal lines on W1 very strong levels coincide with diagional ray and key Fibonacci levels.
Fib retrace shows 23.6% reversal occurring, Ichimoku suggesting a bounce off kumo -
Channel Commodity Index reverse also respecting diagonal channel.
First target 0% on Fib retrace, trailing stop from then on -
Stop based on historical kijun-sen flat line, slightly above visual red stop level on short position target
Good luck and happy trading!
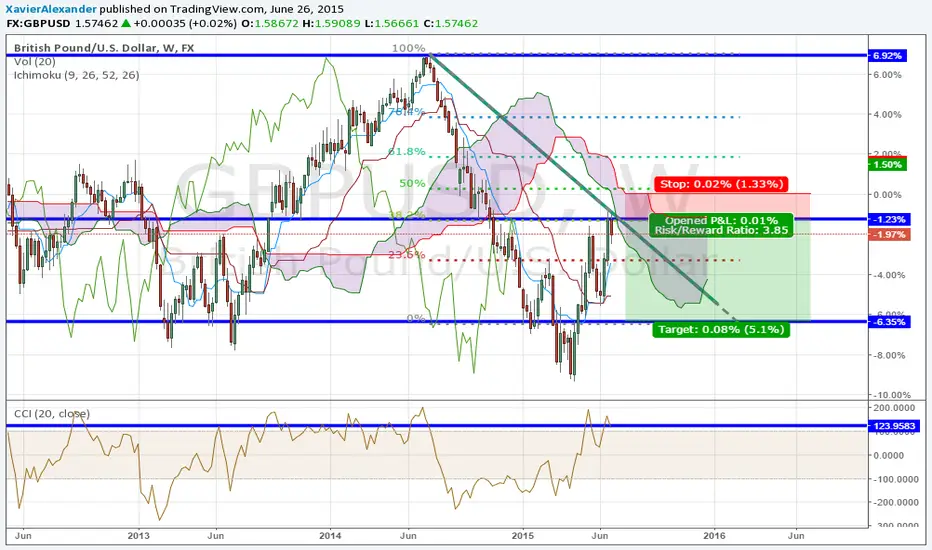
GBPUSD CABLE SHORT LONG TERM BIG DROP COOKING £$Drawn S/R on W1 very strong levels, Fib retrace shows 38.2% reversal occuring CCI Dropping. First target 23.6% - Second 0% - Stop on kumo support but will we test it at all? who knows :)
Stochastic Pop and Drop Strategy - Jake BernsteinHere is another strategy code for Jake Bernstein's Stochastic Pop and Drop.
Follow the link -
Unfortunately, I do not have any videos on how to use these, The Link for reference posted with the Script will give you enough information to trade.
Enjoy...
UCSgears
