USDCHFHello Traders! 👋
What are your thoughts on USDCHF?
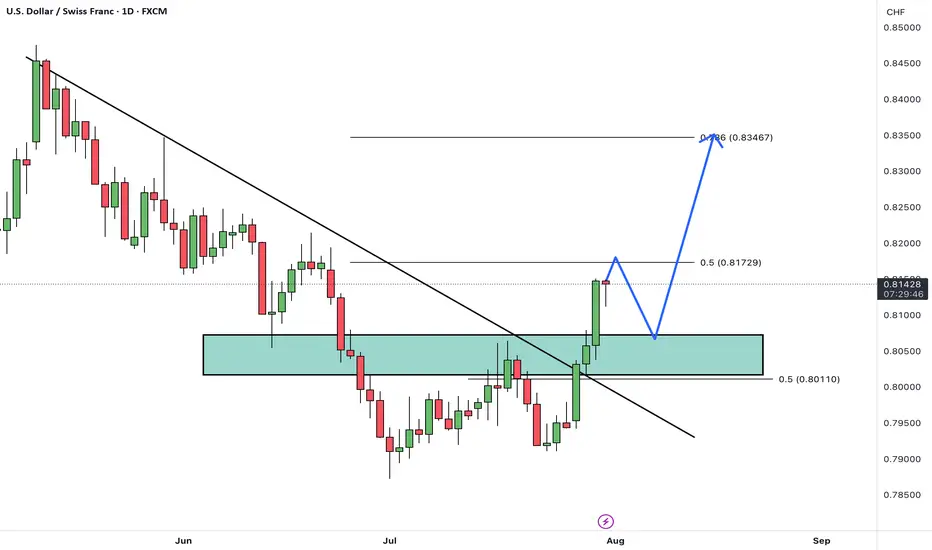
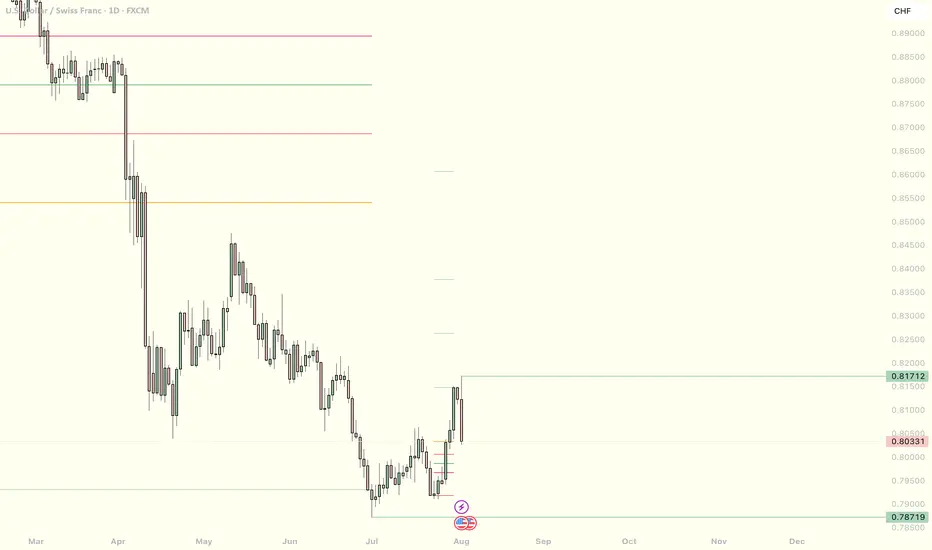
USD/CHF has broken above its descending trendline and cleared a resistance zone, signaling a potential trend reversal and growing bullish momentum.
After some minor consolidation and a pullback to the breakout zone, we expect the pair to continue its rally toward the next identified targets.
The broken resistance now acts as new support, and as long as price remains above this area, the bullish outlook remains valid.
Is USD/CHF ready to extend higher toward its next targets? Share your view below! 🤔👇
Don’t forget to like and share your thoughts in the comments! ❤️
DXY
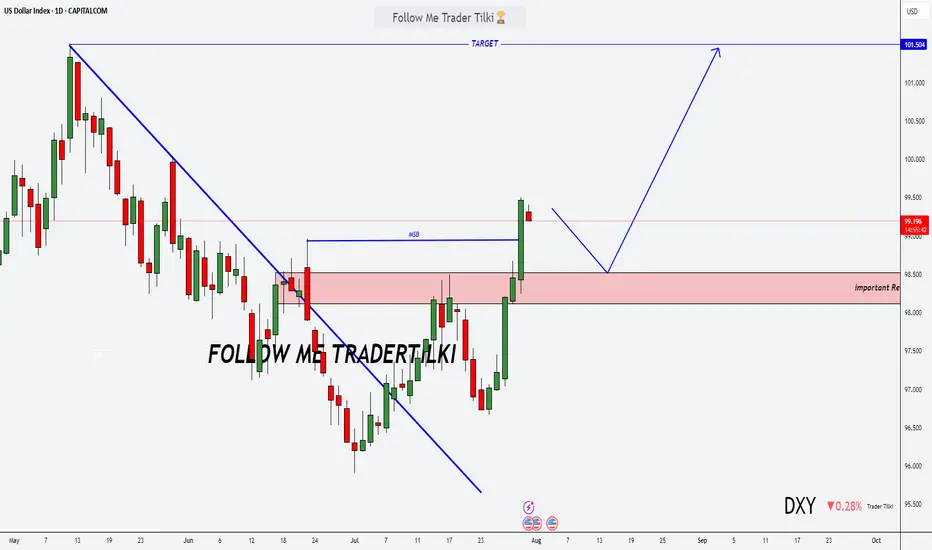
DXY Just Broke Through the Lock… Where’s the Market Headed Now?🌅 Good Morning, Friends!
A few days ago, I marked 98.950 as a key threshold for the DXY index. As of today, that level has officially been broken—and the bullish momentum we anticipated is now kicking in. 📈
The next target? 101.000.
That said, it’s crucial to remember: DXY is heavily influenced by fundamental data. Stay alert and keep a close eye on key economic developments—they’re essential for navigating this move.
This breakout validates the analysis I shared with you all. And it wasn’t just about charts—it was about discipline, precision, and timing.
Every single like from you is a huge boost to my motivation. Thanks from the heart—your support drives me to keep sharing these insights! 💙
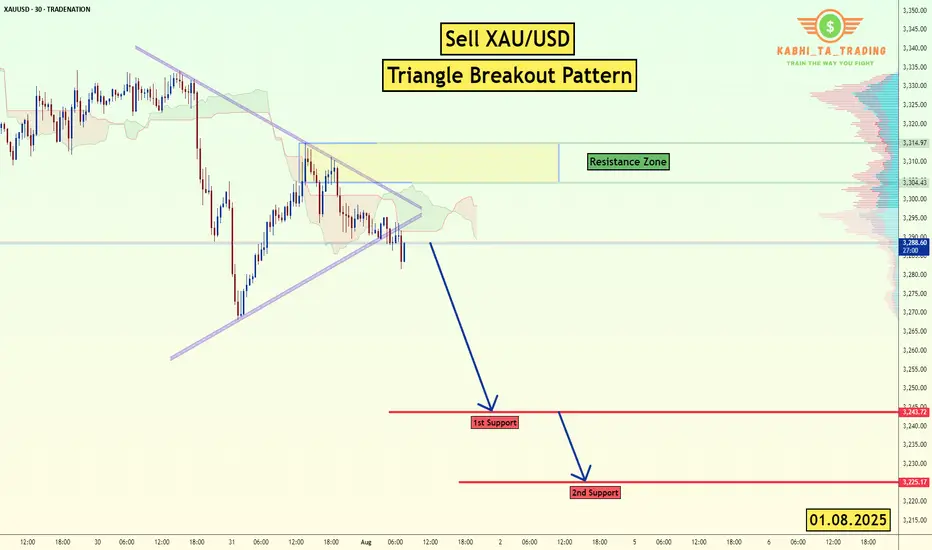
XAU/USD (Gold) - Triangle Breakout (1.08.2025)The XAU/USD Pair on the M30 timeframe presents a Potential Selling Opportunity due to a recent Formation of a Triangle Breakout Pattern. This suggests a shift in momentum towards the downside in the coming hours.
Possible Short Trade:
Entry: Consider Entering A Short Position around Trendline Of The Pattern.
Target Levels:
1st Support – 3249
2nd Support – 3225
🎁 Please hit the like button and
🎁 Leave a comment to support for My Post !
Your likes and comments are incredibly motivating and will encourage me to share more analysis with you.
Best Regards, KABHI_TA_TRADING
Thank you.
Disclosure: I am part of Trade Nation's Influencer program and receive a monthly fee for using their TradingView charts in my analysis.
NFP Volatility Ahead – Is the Dollar Ready to Break Higher?🟢 DXY Outlook – A Key Day for the Dollar Index
Yesterday’s monthly candle closed with strong bullish momentum, marking a powerful start to August. Today, on the first trading day of the month, we’re expecting three major U.S. economic releases:
NFP, Average Hourly Earnings (m/m), and the Unemployment Rate.
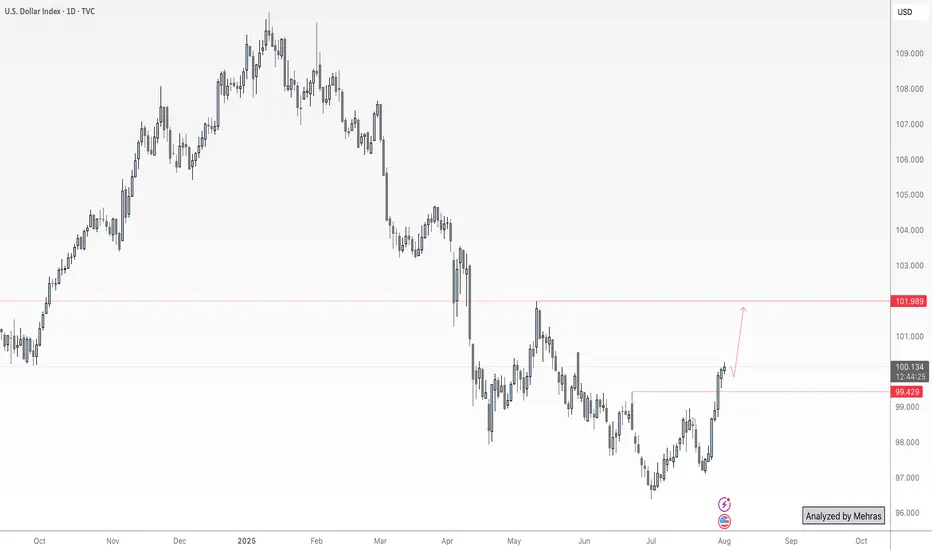
As discussed in last week’s outlook, DXY has successfully broken above the key 100 level and confirmed a monthly close above it — a significant technical development. With no major order blocks or visible resistance in the way, the path toward the 102 target appears technically clear.
That said, I anticipate mixed data from today’s releases — which means we could see both sides of liquidity being taken during the initial reaction. Price might dip toward lower zones temporarily to collect liquidity before resuming its bullish move toward 102.
📌 In summary:
From a swing perspective, I believe the direction remains bullish for the Dollar Index as long as we hold above the 100 level.
When I say the data might be “mixed,” I mean the market could show an initial drop toward lower zones at the time of release — not because of a reversal, but to grab liquidity before continuing higher toward the 102 target.
Unless we see something unexpectedly extreme in the numbers, I expect the DXY to remain on track to reach the 102 level in the coming days or next week.
🔁 This analysis will be updated whenever necessary.
Disclaimer: This is not financial advice. Just my personal opinion.
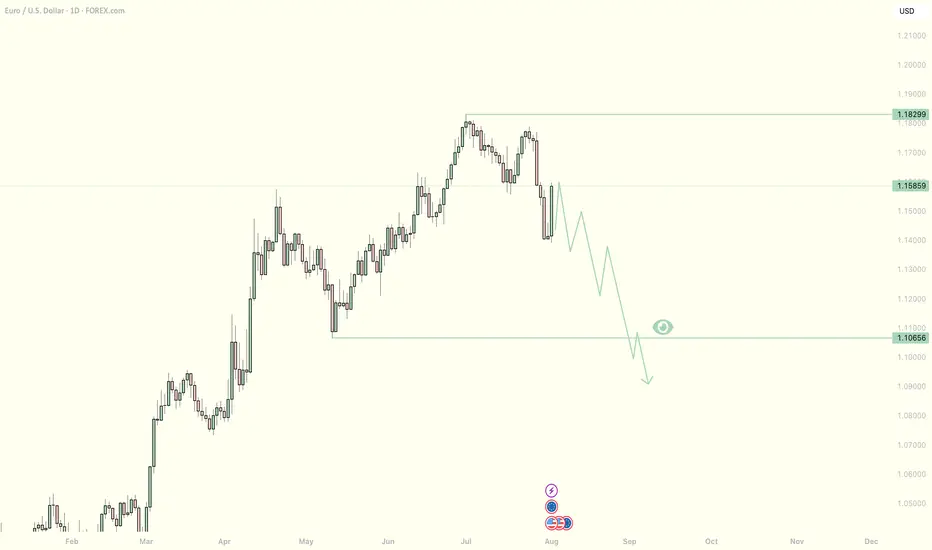
EURUSD Down Trend As dxy is bullish Eurusd will be bearish. I need price to go to my eyeing level in the next couple weeks. we wait and see what price we want to do next week, Wednesday.
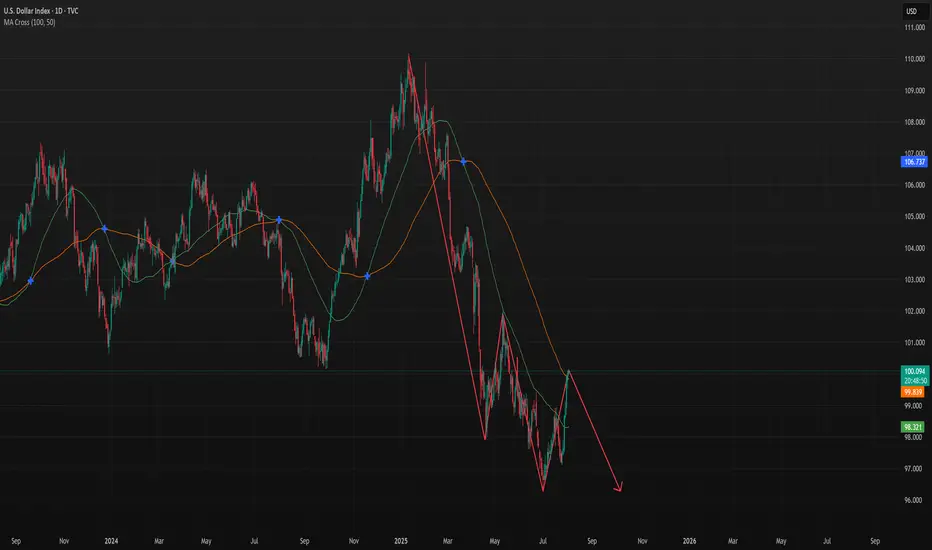
DXY - Possible Down Swing to continue furtherTVC:DXY
CMCMARKETS:USDCAD
OANDA:NZDUSD
CMCMARKETS:EURUSD
We may have a further down swing pattern forming let's continue to see if it passes the resistance area.
Dollar Falls as Traders Price In Two 2025 Rate Cuts on Weak JobsDollar Falls as Traders Price In Two 2025 Rate Cuts on Weak Jobs Data
Introduction
In a significant turn of events for the global currency markets, the U.S. dollar has taken a sharp tumble as traders brace for a more dovish Federal Reserve. A weaker-than-expected U.S. employment report for July 2025 has prompted market participants to price in two interest-rate cuts by the Fed before the end of the year. This shift in monetary policy expectations comes during a time of heightened global uncertainty, much of it triggered by President Donald Trump's aggressive trade policies, which have already disrupted the $7.5 trillion-a-day foreign exchange market.
The Bloomberg Dollar Spot Index, a key gauge of the dollar’s strength against major currencies, plunged as much as 1%—marking its worst single-day performance since April 21, 2025. The greenback’s decline was mirrored by strong gains in rival currencies, with the Japanese yen appreciating 2.2% and the euro climbing more than 1% against the dollar.
This article delves into the recent developments surrounding the U.S. dollar, the implications of weak jobs data, the Federal Reserve’s likely response, and how Trump’s trade policies are shaping the broader economic landscape.
________________________________________
Weak Jobs Data Sparks Policy Shift
The July 2025 employment report came in well below expectations. Non-farm payrolls growth fell short, and revisions for May and June showed fewer jobs were added than previously reported. These figures suggest that the U.S. labor market is cooling more rapidly than anticipated, raising concerns about the sustainability of the post-pandemic economic recovery.
According to Helen Given, a foreign exchange trader at Monex Inc., “It’s now clear that the U.S. labor market is cooling fairly sharply. There’s a good chance that Trump’s crusade against Chair Powell ratchets up further in the coming days, and there could be further losses for the dollar to come as a result.”
The disappointing employment data has led traders to adjust their expectations for U.S. monetary policy. Futures markets are now pricing in two 25-basis-point rate cuts by the end of 2025, a stark reversal from the earlier outlook that suggested the Fed would remain on hold or even consider tightening if inflation remained sticky.
________________________________________
The Federal Reserve’s Dilemma
The Federal Reserve now finds itself in a precarious position. On one hand, inflation has moderated in recent months, giving the central bank more room to maneuver. On the other hand, a weakening labor market could indicate a broader slowdown that might require immediate action to prevent a recession.
Fed Chair Jerome Powell has come under increasing political pressure from President Trump, who has publicly criticized the Fed for keeping rates too high. Trump argues that rate cuts are necessary to support U.S. exporters and counteract the negative effects of his own tariffs and trade restrictions.
Historically, the Fed has maintained its independence from political influence, but in an election year, the pressure to act can become intense. If the Fed moves to cut rates, it will be seen as responding to both economic data and political dynamics—a delicate balancing act.
________________________________________
The Global Currency Market Reacts
The ripple effects of the dollar’s decline are being felt across the globe. The $7.5 trillion-a-day foreign exchange market, already under strain from geopolitical uncertainty and shifting central bank policies, has seen increased volatility in recent weeks.
The Japanese yen, often viewed as a safe-haven currency, surged 2.2% against the dollar following the release of the jobs data. Meanwhile, the euro gained over 1%, reflecting investor sentiment that the greenback’s era of dominance may be waning—at least for now.
Emerging market currencies also found some relief, as a weaker dollar generally eases pressure on countries with large dollar-denominated debts. However, the overall picture remains complex, as trade tensions and capital flow volatility continue to weigh on risk sentiment.
________________________________________
Trump’s Trade Policies: A Double-Edged Sword
President Trump’s trade strategies have been a central feature of his second term in office. From imposing tariffs on Chinese imports to renegotiating trade agreements with the European Union and Canada, Trump has sought to reshape the global trading system in favor of American manufacturers.
Yet these policies have produced mixed results. While some sectors have benefited from protectionist measures, others—particularly those reliant on global supply chains—have suffered from rising costs and retaliatory tariffs. The uncertainty generated by these policies has also dampened business investment, slowed global trade, and disrupted financial markets.
“The dollar had tumbled this year as Trump’s aggressive trade policies rocked the $7.5 trillion-a-day currency market, weighing on global growth outlook,” Bloomberg reported.
Investors are increasingly concerned that continued trade friction, combined with growing political pressure on the Fed, could lead to policy missteps that undermine the U.S. economy and erode confidence in the dollar.
________________________________________
Market Implications
The dollar’s recent decline has far-reaching implications for various asset classes:
1. Equities
U.S. equities have shown mixed reactions. While lower interest rates are typically supportive of stock prices, the underlying reason—economic weakness—has investors on edge. Sectors such as technology and consumer discretionary are expected to benefit from cheaper borrowing costs, but cyclical sectors may struggle if growth slows further.
2. Bonds
Treasury yields have fallen sharply as traders anticipate rate cuts. The 10-year yield dropped below 3.8%, its lowest level in months. The yield curve has also flattened, a potential warning sign of slowing economic momentum.
3. Commodities
A weaker dollar typically supports commodity prices, as most are priced in dollars. Gold, oil, and industrial metals all saw gains in the wake of the jobs report. However, demand-side concerns stemming from a global slowdown could limit the upside.
4. Emerging Markets
For emerging markets, a softer dollar offers both relief and risk. On the positive side, it reduces debt servicing costs and can attract capital flows. On the negative side, if the dollar’s weakness reflects a broader global slowdown, risk appetite could remain subdued.
________________________________________
Looking Ahead: What to Watch
As markets digest the latest economic data and policy signals, several key developments will be closely monitored:
1. Upcoming Fed Meetings
The Federal Open Market Committee (FOMC) will meet again in September. Markets will be keenly watching for any changes in tone or new forward guidance. A rate cut in September now appears increasingly likely, especially if subsequent data confirms a labor market slowdown.
2. Inflation Trends
While inflation has moderated, it remains a key concern for policymakers. If inflation rebounds unexpectedly, it could complicate the Fed’s ability to cut rates without stoking price pressures.
3. Geopolitical Risks
Trade tensions, particularly with China and the EU, remain unresolved. Any escalation could further destabilize markets and weigh on the dollar. Additionally, developments in the Middle East, Eastern Europe, and Southeast Asia could add to the uncertainty.
4. U.S. Presidential Politics
With the 2026 presidential election campaign already underway, Trump’s rhetoric and policy decisions will continue to influence market sentiment. His ongoing criticism of the Fed could erode confidence in U.S. institutions, particularly if it leads to perceived politicization of monetary policy.
________________________________________
Conclusion
The sharp fall in the U.S. dollar following weak July jobs data marks a pivotal moment in 2025’s economic narrative. With traders now pricing in two Federal Reserve rate cuts by year-end, the stakes have never been higher for policymakers, investors, and political leaders.
While a softer dollar can provide some temporary relief to exporters and boost inflation expectations, it also reflects deeper concerns about the strength of the U.S. economy and the unintended consequences of aggressive trade policies. President Trump’s confrontational approach to global trade, combined with mounting pressure on the Fed, is creating a complex and potentially volatile environment for markets.
As the year progresses, all eyes will be on the Federal Reserve’s response, the resilience of the U.S. labor market, and the evolving political landscape. In a world where headlines can move markets in seconds, clarity, stability, and sound policy have never been more critical.
________________________________________
Disclaimer: This article is for informational purposes only and does not constitute financial or investment advice.
S&P Correction Window is official - VOLATILITY AHEADIt's that time of year where the pre-summer push wraps and the summer lull and potential
pause gets underway.
July 31 finished on a bit of a sour note with over 67% of stocks declining today and US indexes finishing RED despite the big gaps and bullish pops on MSFT and META post earnings.f
SPX Key Levels
-watch the 21 day moving average
-watch the 50 day moving average
-more dynamic support in the 100/144/200 moving average cluster
I'll be taking bites at the 5/10/15% correction levels with options and looking for this dip
to be bought by retail and institutions.
Will August 1 US Tariff Deadline matter? After Japan and Eurozone came in and said a deal is being done, I was thinking this would be a dud. BUT, Dr. Copper says "maybe" on the global
tariff deadline with the largest single day move in history (bearish). Being the perfect time of year for a correction (the other being Feb-Apr), and the technicals looking so clean for an
orderly pullback, VIX may float higher and make things more interesting in the next 30-60 days.
Strategies matter, I'll be trading risk defined, but there are great opportunities ahead. A pullback is sure better than literally watching all-time highs every single day.
Thanks for watching!!!

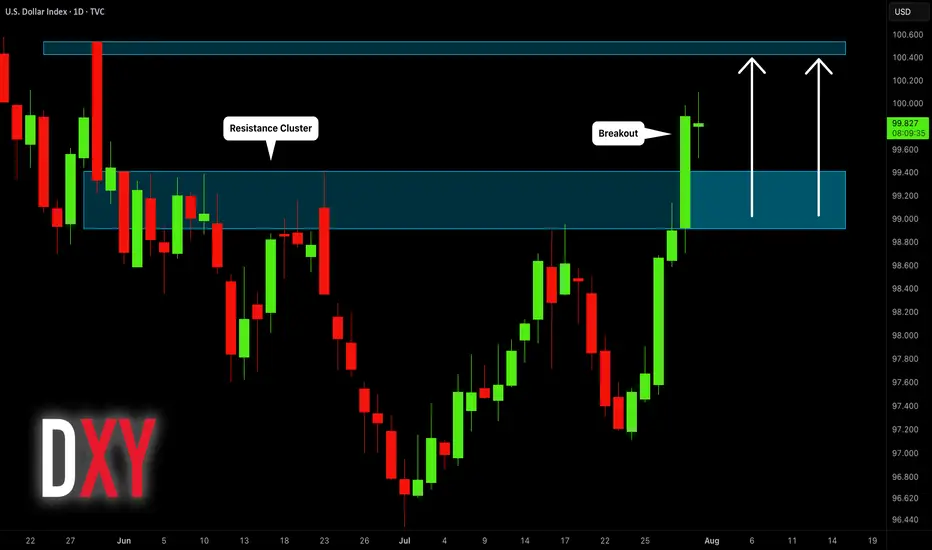
Dollar Index (DXY): Will It Rise More?!
Dollar Index is on its way to 100.4 resistance.
A breakout of a major supply cluster on a daily after FED meeting
yesterday indicates a strong bullish pressure.
I think that growth will continue soon.
❤️Please, support my work with like, thank you!❤️
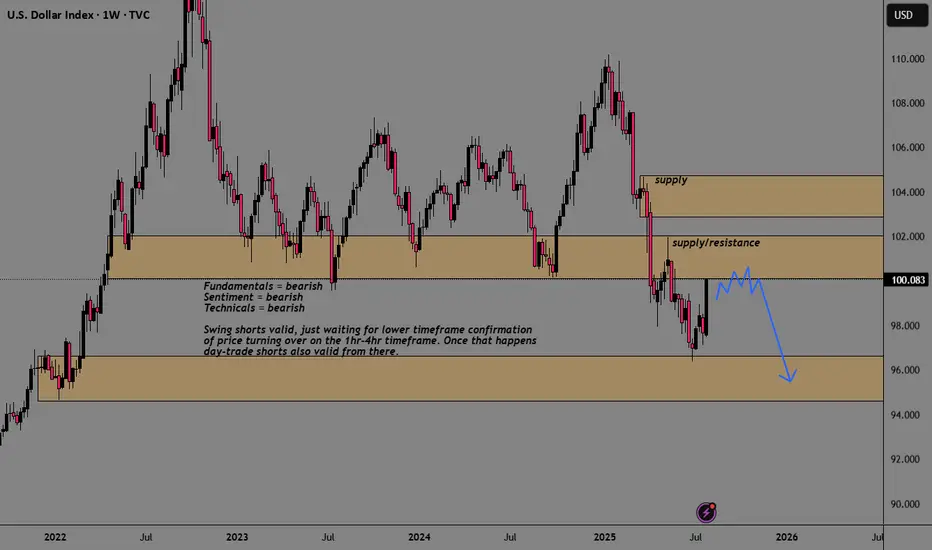
DXY USDOLLAR CRASH Incoming!Long-term fundamentals are bearish
Long-term sentiment = bearish
Long-term technicals = bearish
Trump wants a weaker dollar + FED injecting endless amounts of cash into the markets
driving stocks/ gold up, and the dollar down, losing purchasing power.
My plan is to look for shorts on the 1hr-4hr timeframe with lower timeframe confirmation.
Once price starts turning over, day-traders can join in.
Agree or disagree?
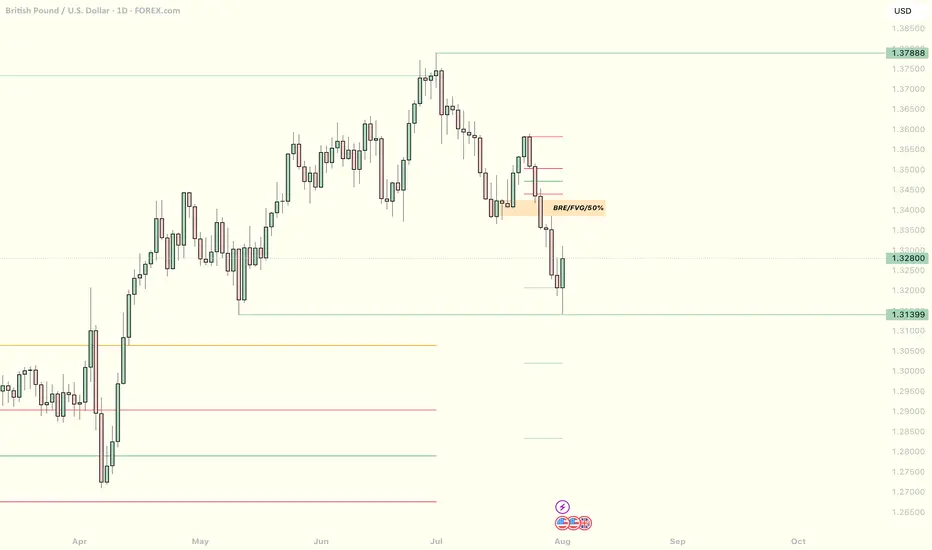
What now for the dollar after a poor NFP report?It is difficult not to link the bad US data to the impact of tariffs. Indeed, it certainly looks that way, especially given that the slowdown in jobs started in early Q2 when reciprocal tariffs were announced. Companies expecting margins to be squeezed by higher duties probably thought twice about hiring workers in order to keep costs down. So, the US labour market has been losing steam fast, undoubtedly due to tariff concerns. Unless the data surprises on the upside soon, the Fed may have no choice but to cut—and cut again. Against this backdrop, the recovery in the dollar is going to a long bumpy road.
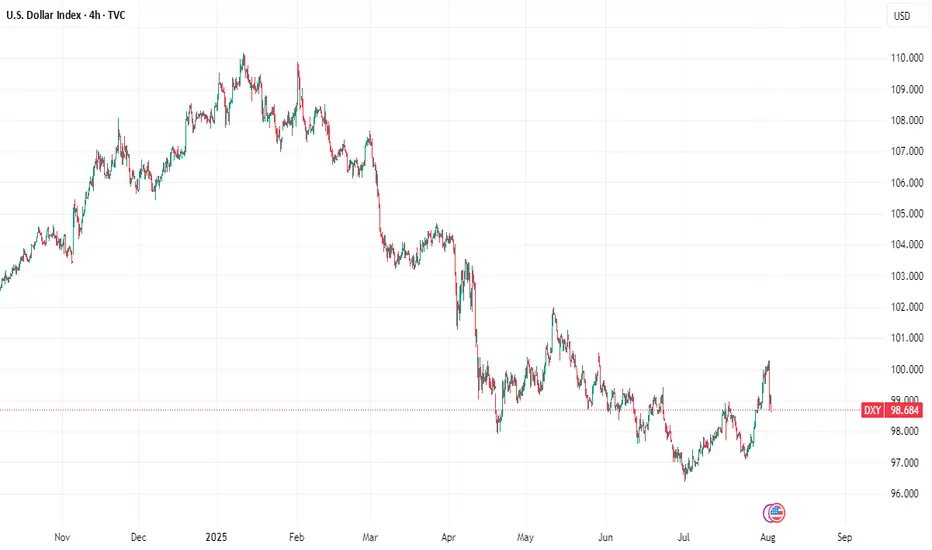
We noted the area around 100.00 to be resistance in the previous update, and that level has held, thanks to the weak jobs report (and ISM survey that was released later). The DXY was testing potential support around 98.95 at the time of writing. Will it be able to bounce there? Break that on a closing basis and next week could bring more technical dollar selling.
By Fawad Razaqzada, market analyst with FOREX.com
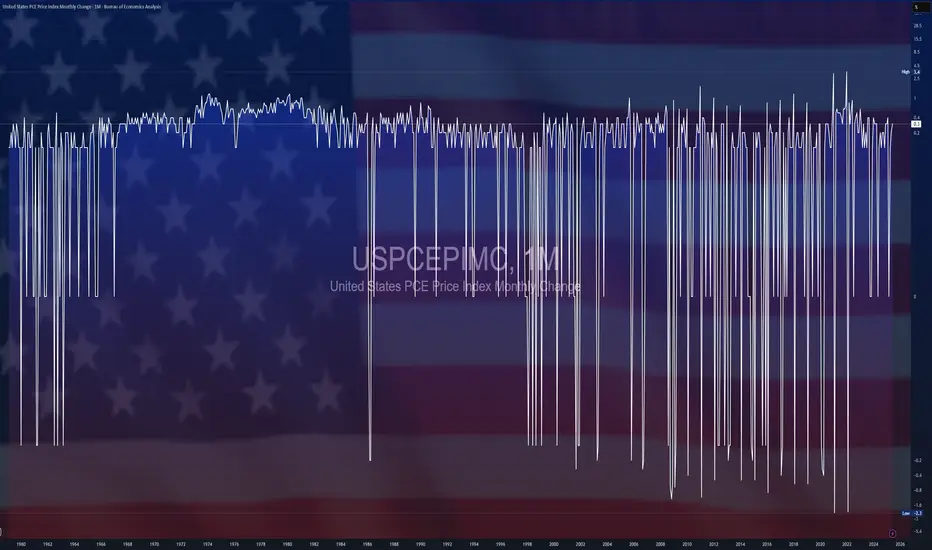
$USPCEPIMC -U.S PCE Prices Rise (June/2025)ECONOMICS:USPCEPIMC
June/2025
source: U.S. Bureau of Economic Analysis
- The US PCE price index rose by 0.3% mom in June, the largest increase in four months, and in line with expectations, led by prices for goods.
The core PCE index also went up 0.3%, aligning with forecasts.
However, both the headline and core annual inflation rates topped forecasts, reaching 2.6% and 2.8%, respectively.
Meanwhile, both personal income and spending edged up 0.3%.
Close out the Week STRONGLooks like price has found its bottom and is ready to push from here. We are looking for a strong forceful break out from this zone so we can go for the higher levels. Everything looks right from here and value keeps shifting up. I know we should get a solid entry but waiting for it to line up with time.

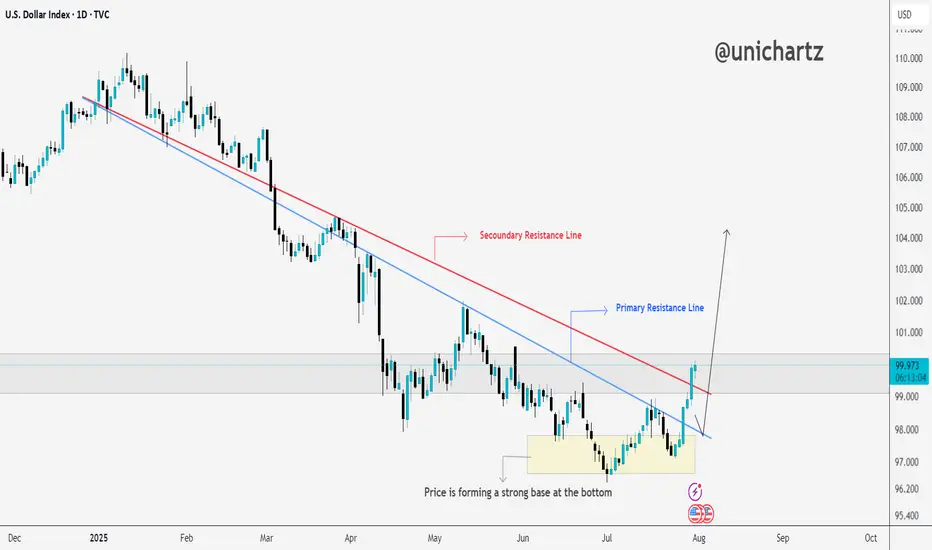
DXY Just Broke Resistance – Is This the Start of a Dollar Rally?As per our analysis, DXY has successfully broken above the primary and secondary resistance line.
If the price manages to close above the marked resistance zone, we could see further upside momentum ahead.
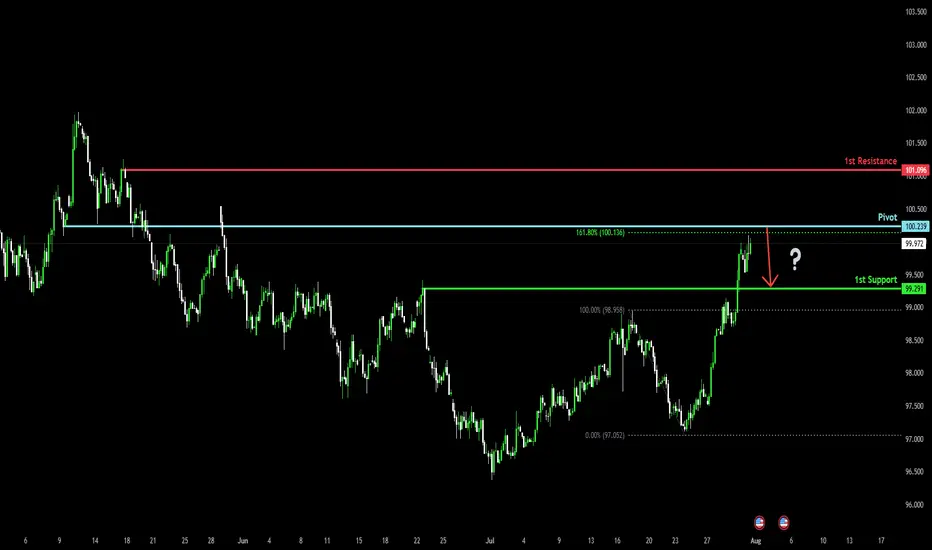
Bearish reversal off overlap resistance?The US Dollar Index (DXY) is rising towards the pivot and could reverse to the 1st support.
Pivot: 100.23
1st Support: 99.29
1st Resistance: 101.09
Risk Warning:
Trading Forex and CFDs carries a high level of risk to your capital and you should only trade with money you can afford to lose. Trading Forex and CFDs may not be suitable for all investors, so please ensure that you fully understand the risks involved and seek independent advice if necessary.
Disclaimer:
The above opinions given constitute general market commentary, and do not constitute the opinion or advice of IC Markets or any form of personal or investment advice.
Any opinions, news, research, analyses, prices, other information, or links to third-party sites contained on this website are provided on an "as-is" basis, are intended only to be informative, is not an advice nor a recommendation, nor research, or a record of our trading prices, or an offer of, or solicitation for a transaction in any financial instrument and thus should not be treated as such. The information provided does not involve any specific investment objectives, financial situation and needs of any specific person who may receive it. Please be aware, that past performance is not a reliable indicator of future performance and/or results. Past Performance or Forward-looking scenarios based upon the reasonable beliefs of the third-party provider are not a guarantee of future performance. Actual results may differ materially from those anticipated in forward-looking or past performance statements. IC Markets makes no representation or warranty and assumes no liability as to the accuracy or completeness of the information provided, nor any loss arising from any investment based on a recommendation, forecast or any information supplied by any third-party.
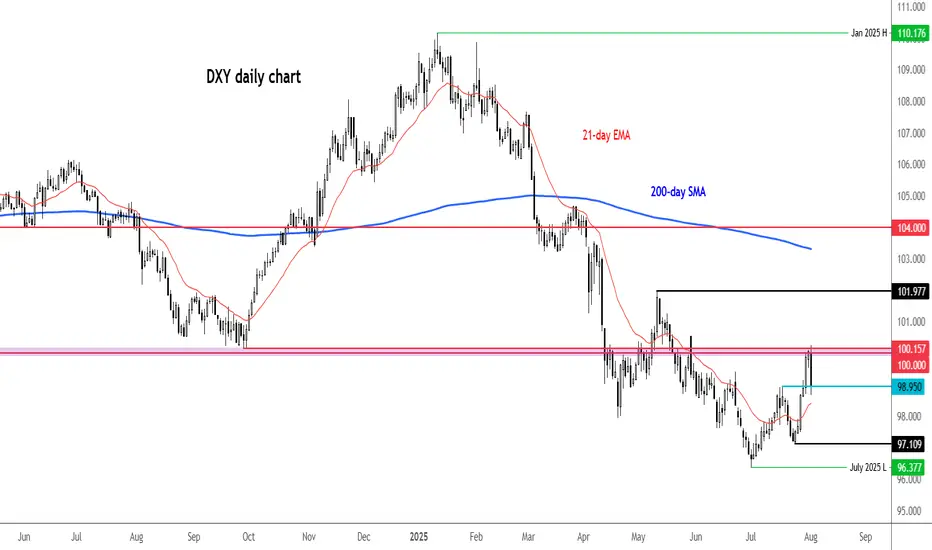
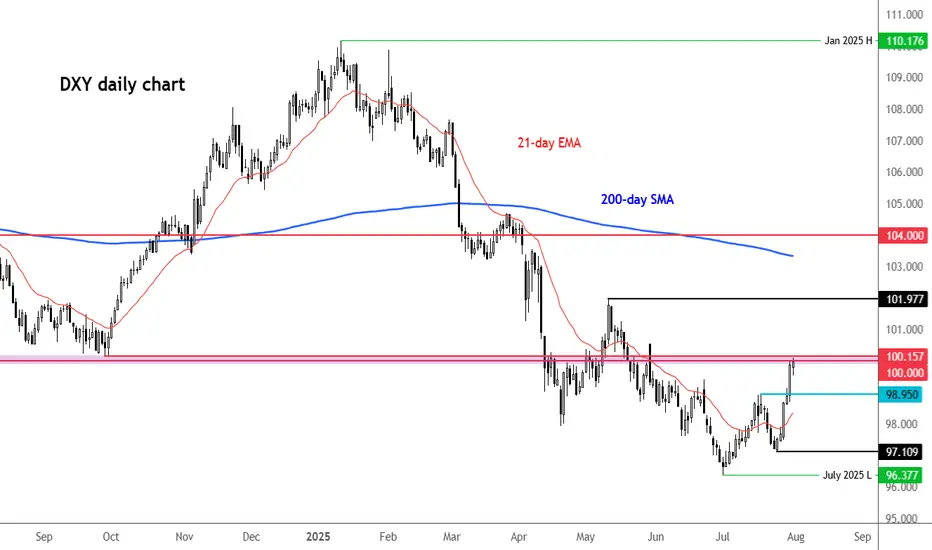
DXY testing 100.00 resistanceThe US dollar index has risen to rest a key resistance area around the 100.00 level. Previously a key support and resistance zone, what happens here could determine the near-term technical direction for the US dollar.
Key support below this zone is at 98.95, marking a prior resistance. Given the short-term bullish price structure, I would expect this level to hold if the greenback were to ease back from here.
If the bullish momentum gathers pace, then 101.00 could be the next stop, followed by the recent high of 101.97.
From a macro point of view, resilient economic data and persistent core inflation concerns continue to support the Federal Reserve’s cautious policy approach. Today’s core PCE inflation reading came in slightly above forecast, at 2.8% year-over-year versus the expected 2.7%. In addition, jobless claims were better than anticipated, registering 218,000 compared to the 224,000 forecast. The Q2 Employment Cost Index also surprised to the upside, rising 0.9% quarter-on-quarter.
These figures follow yesterday’s stronger-than-expected GDP report and a solid ADP private payrolls release, further underscoring the strength of the U.S. economy.
Attention now turns to Friday’s nonfarm payrolls report, which could have a meaningful impact on rate expectations. Fed Chair Jerome Powell has emphasized the importance of the unemployment rate as a key metric, so any upside surprise could reinforce the Fed’s current position.
However, expectations are not very high for the non-farm payrolls report. Current forecasts suggest an increase of 106,000 jobs, with average weekly earnings rising 0.3% month-over-month, and the unemployment rate edging up to 4.2%. Yet, the scarcity of strong leading indicators this month adds a layer of uncertainty to the outlook.
By Fawad Razaqzada, market analyst with FOREX.com
Bitcoin’s Game Has Changed: Fresh Support Zone, Targets Sky-HighHey Dear Friends,
Until recently, Bitcoin had been stuck in a range between 112,331 and 105,344 for quite some time. But that range has now been clearly broken. So, what does this mean? This zone, which used to act as resistance, is now expected to flip and act as support.
According to my weekly trading model, the long-term target levels I’m tracking for Bitcoin are: 127,818 – 137,000 – 146,000.
Since this is a weekly setup, it might take a while for these targets to play out. Even if we see pullbacks to the 112K, 105K, or even 100K levels, I expect to see strong buying pressure from that zone.
I’ll keep sharing regular updates as this setup develops.
To everyone who’s been supporting and appreciating my work—thank you, truly. Your encouragement means the world to me and keeps me motivated to keep showing up. Much love to all of you—I’m grateful we’re in this journey together.

USDCHF Short term bullish?As dxy looks like it wants to run higher, USDCHF will likely also go higher for a short-term buying for a retracement to then continue its down trend. this pair looks good.
DXY BULLISH coming weeks Dxy is oversold, and what goes down must go up. Price did a nice retracement, setting up for next week to go higher or the week after, depending on consolidation. For me, DXY will go higher, leaving its cross pairs like EURUSD to go lower.

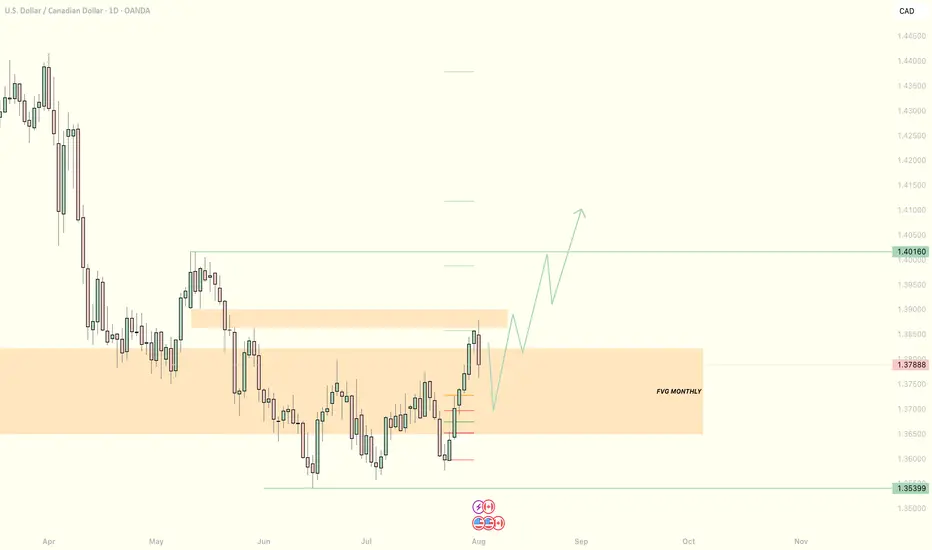
My USDCAD bullish senarioAs dxy looks like it wants to retrace higher, I would expect the same outcome with USDCAD . Ive outlined what im looking for as price retrace from a key area back into 50% of daily fib to look for long side buys. Let's see how this pans out
U.S. Dollar Index (DXY) – Pro Analysis | 1H Chart |1. Strong Bullish Momentum
DXY broke out sharply above the 99.41 resistance, showing clear strength from bulls with minimal pullbacks during the rally.
2. Short-Term Rejection at Supply
Price was rejected from the 99.978 zone — a key supply area. This indicates the presence of active sellers near the psychological 100 level.
3. Retesting Breakout Structure
Currently hovering just above 99.669, the DXY is retesting the previous breakout level. This could act as short-term support if bullish momentum resumes.
4. Next Key Zones
Resistance: 99.978 → 100.534
Support: 99.411 → 98.92
Break below 99.411 may invalidate the breakout.
5. Outlook
Bias remains bullish above 99.41. However, failure to reclaim 99.978 soon may signal temporary exhaustion or consolidation before next leg up.

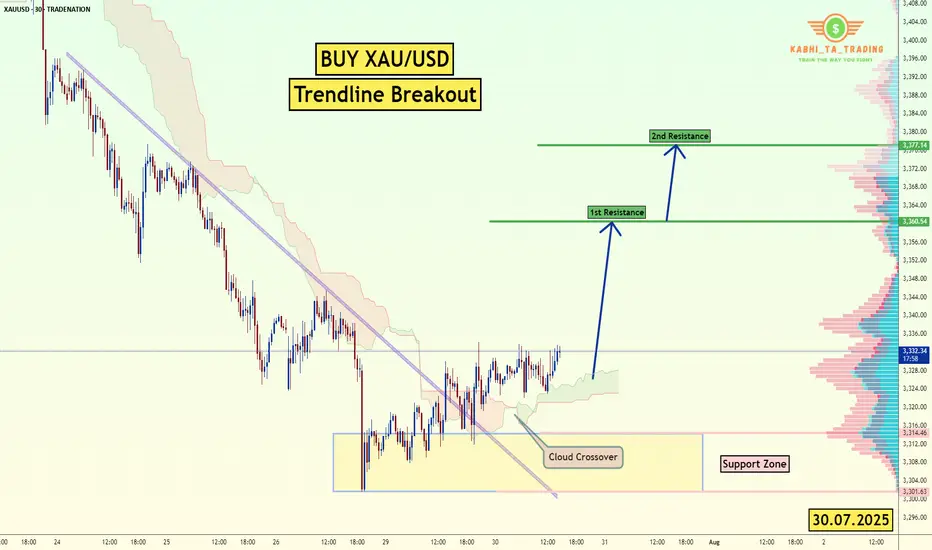
XAU/USD Trendline Breakout (30.07.2025)The XAU/USD pair on the M30 timeframe presents a Potential Buying Opportunity due to a recent Formation of a Trendline Breakout Pattern. This suggests a shift in momentum towards the upside and a higher likelihood of further advances in the coming hours.
Possible Long Trade:
Entry: Consider Entering A Long Position around Trendline Of The Pattern.
Target Levels:
1st Resistance – 3360
2nd Resistance – 3377
🎁 Please hit the like button and
🎁 Leave a comment to support for My Post !
Your likes and comments are incredibly motivating and will encourage me to share more analysis with you.
Best Regards, KABHI_TA_TRADING
Thank you.
Disclosure: I am part of Trade Nation's Influencer program and receive a monthly fee for using their TradingView charts in my analysis.