XAU/USD - Trendline Breakout (14.05.2025)The XAU/USD pair on the M30 timeframe presents a Potential Buying Opportunity due to a recent Formation of a Breakout Pattern. This suggests a shift in momentum towards the upside and a higher likelihood of further advances in the coming hours.
Possible Long Trade:
Entry: Consider Entering A Long Position around Trendline Of The Pattern.
Target Levels:
1st Resistance – 3321
2nd Resistance – 3364
🎁 Please hit the like button and
🎁 Leave a comment to support for My Post !
Your likes and comments are incredibly motivating and will encourage me to share more analysis with you.
Best Regards, KABHI_TA_TRADING
Thank you.
DXY

DXY Sell this rally. Bearish until end-of-year.The U.S. Dollar index (DXY) has been trading within a Channel Down since the September 26 2022 High and is currently on a medium-term Bearish Leg. The last 3 weeks however have been a short-term rebound (all 1W candles green), but the price is still below both the 1W MA200 (orang trend-line) and the 1W MA50 (blue trend-line).
This doesn't alter the bearish trend as this is not the first time we've seen this price action. More specifically, DXY also made a short-term rebound during the first Bearish Leg of the pattern and rebounded on January 30 2023 back to the 1W MA50. This delivered a strong rejection which eventually completed the Bearish Leg with one last round of selling to complete a -13.30% Bearish Leg in total.
Before that, we also saw the same pattern (also on 1W RSI terms) in 2020, when on August 31 2020 the price again had a short-term rebound only to resume the bearish trend and finish the sequence again at -13.40% from the top.
As a result, as long as the price remains (closes) below the 1W MA50, the last sell signal is given when the 1W RSI breaks above its MA (yellow trend-line) and then we can expect the Bearish Leg to complete a -13.30% decline with a 96.000 Target.
-------------------------------------------------------------------------------
** Please LIKE 👍, FOLLOW ✅, SHARE 🙌 and COMMENT ✍ if you enjoy this idea! Also share your ideas and charts in the comments section below! This is best way to keep it relevant, support us, keep the content here free and allow the idea to reach as many people as possible. **
-------------------------------------------------------------------------------
💸💸💸💸💸💸
👇 👇 👇 👇 👇 👇

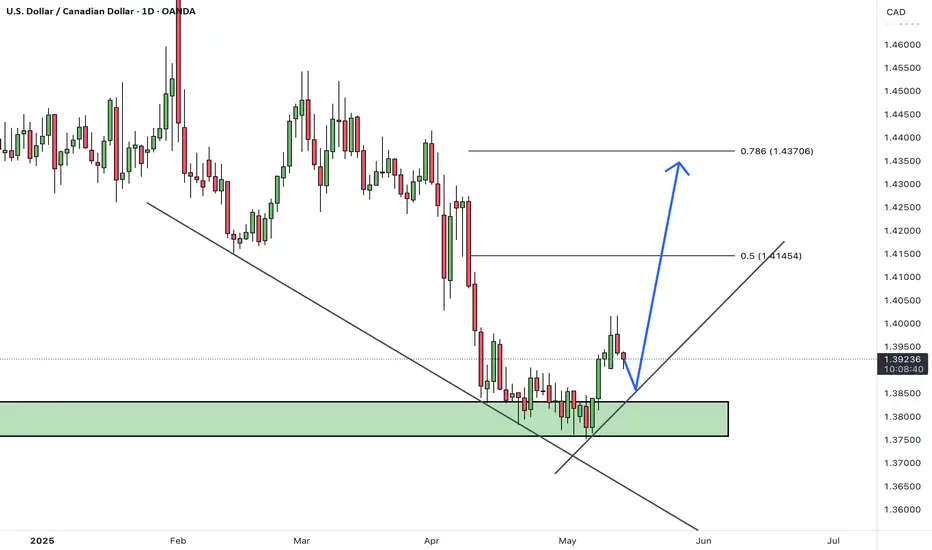
USDCADHello Traders! 👋
What are your thoughts on USDCAD?
This pair found support at the bottom of the channel and a key support zone, triggering the beginning of a bullish move.
We now expect the price to consolidate briefly within this support area, and then continue moving upward toward the specified targets.
Will this support hold and drive the next leg higher? Share your thoughts below!
Don’t forget to like and share your thoughts in the comments! ❤️
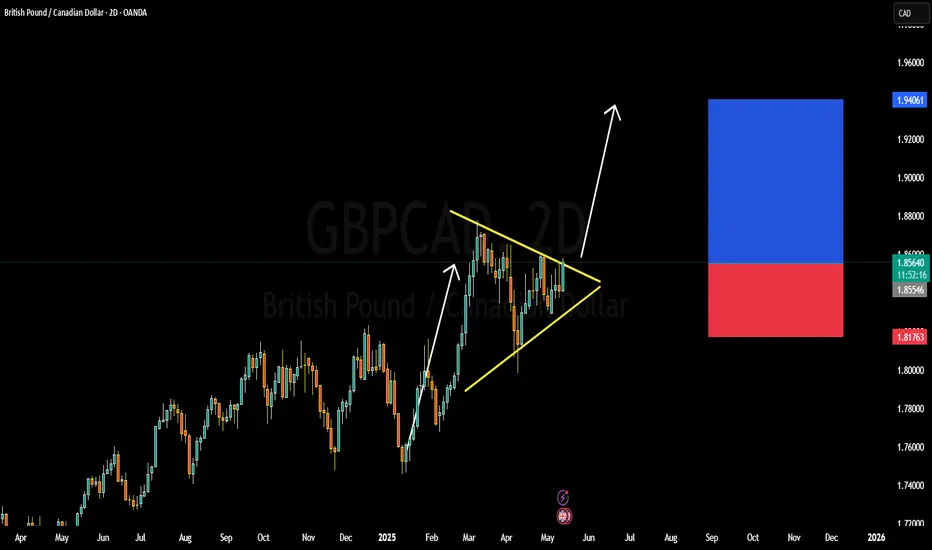
GBPCAD BULLISH OR BEARISH DETAILED ANALYSISGBPCAD is currently trading around the 1.85700 level, consolidating inside a well-defined bullish pennant on the 2-day chart. This pattern formation follows a strong impulsive rally from the 1.71000 region earlier this year, signaling that the pair is in a re-accumulation phase before its next leg higher. Price action is coiling tightly within converging trendlines, and recent volume spikes suggest increasing interest and momentum from the bulls, pointing toward a potential breakout to the upside.
On the fundamental front, the British pound is benefiting from rising wage inflation and a still-hawkish Bank of England tone, which keeps rate cut expectations muted compared to other G10 currencies. Meanwhile, the Canadian dollar remains under pressure due to softening oil prices and weaker-than-expected domestic data. The BoC has also signaled it may start easing in the coming months if inflation continues to slow, making CAD less attractive relative to GBP.
Technically, a breakout above the pennant resistance around 1.8600–1.8650 with strong bullish volume would confirm the continuation of the prior uptrend. The projected target from this pattern sits near the 1.95700 area, aligning with previous major resistance and psychological round numbers. Momentum indicators are building to the upside, and price remains above all key moving averages on the higher timeframes, reinforcing the bullish outlook.
With volume confirming accumulation, a breakout from this bullish pennant could accelerate quickly as trend-following strategies kick in. GBPCAD is well-positioned to capture the upside, and the current structure offers an excellent risk-to-reward opportunity in favor of bulls. In the context of macro divergence between GBP strength and CAD softness, the 1.95700 target looks highly achievable in the coming weeks.
Gold missing inverse relationship with DXYIn the earlier analysis, the expectation is for DXY to trade slightly lower to the round number level of 100.
With Gold's inverse relationship with the US Dollar, anticipating further downside for the DXY should mean that we expect to see some upside on XAUUSD.
However, the current price action on Gold is still signalling further downside.
The good thing is that the price is approaching the support area where the 3200 price level and the 61.8% Fibonacci retracement level align.
Look for a reaction in this area, for a possible rebound to the 3320 price level. Alternatively, if the support area is broken, there could be further downside to the 3000 price level.

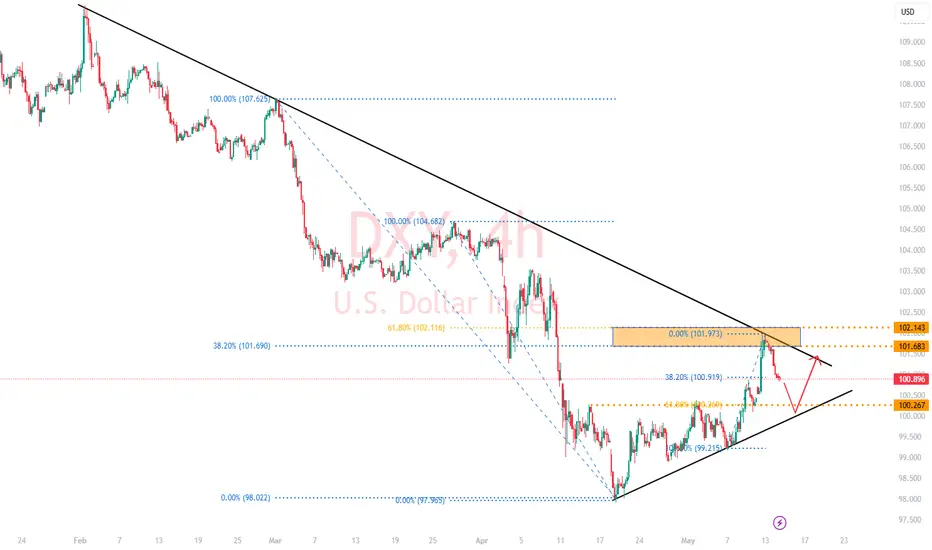
Slower Inflation Growth, Takes DXY lower.Overnight, the DXY traded lower, driven by 2 main factors.
1) The release of lower-than-expected CPI data at 2.3%
2) Rejection of the long-term bearish trendline and the area of confluence formed by the 61.8% and 38.2% Fibonacci retracement levels from the longer term.
If the DXY breaks below the 38.2% Fibonacci retracement level of the shorter term, we could expect to see further downside, toward the target level of 100.
This round-number level would align with the 61.8% Fibonacci retracement level and the short-term bullish trendline.
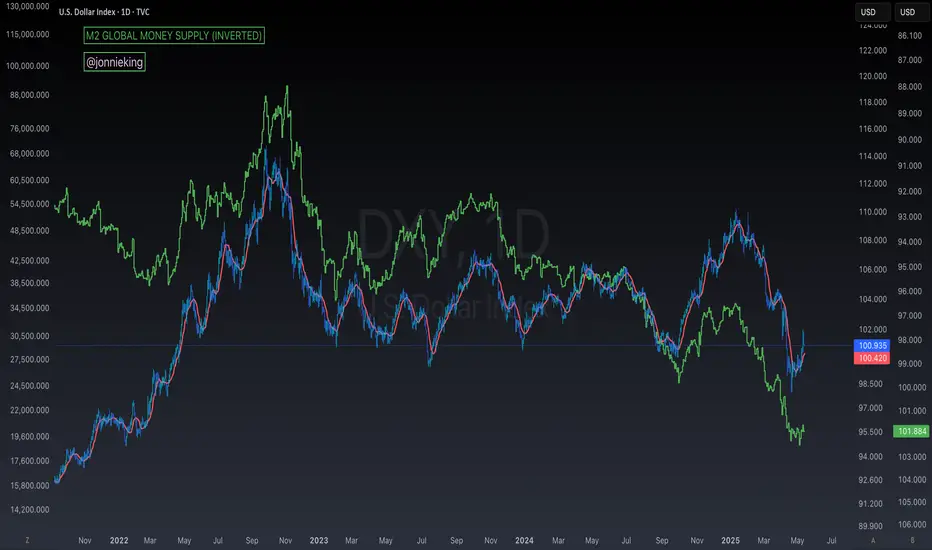
$DXY Up, M2 Money Supply DownWhen the DXY goes UP,
M2 Money Supply goes DOWN.
Remember the 12-Week Lead correlation with CRYPTOCAP:BTC
We need SWEEPS on Gold for a Bigger movePatiently waiting for gold to give us impulsive activity to indicate for a much bigger move. Need it to break outside of the current value first before I'm interested in a solid direction.

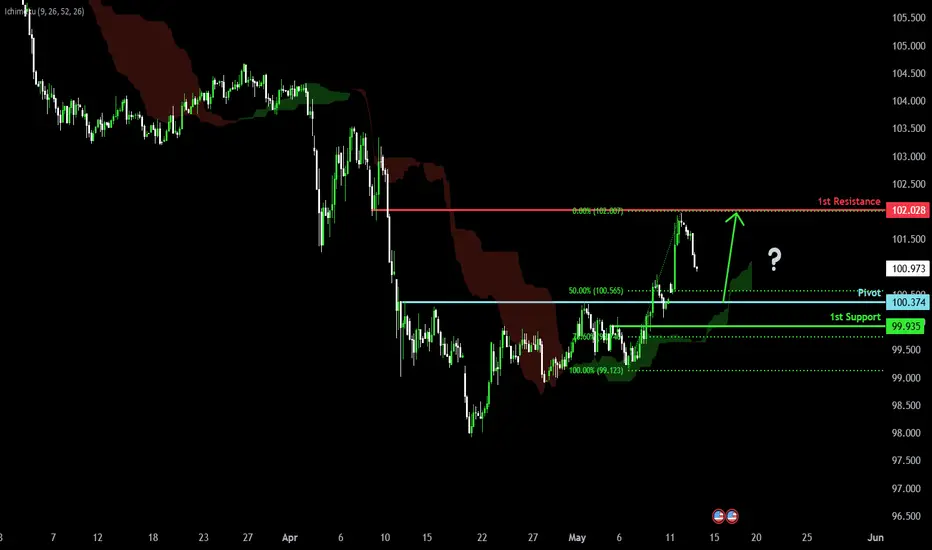
Bullish bounce?US Dollar Index (DXY) is falling towards the pivot and could bounce to the 1st resistance.
Pivot: 100.37
1st Support: 99.93
1st Resistance: 102.02
Risk Warning:
Trading Forex and CFDs carries a high level of risk to your capital and you should only trade with money you can afford to lose. Trading Forex and CFDs may not be suitable for all investors, so please ensure that you fully understand the risks involved and seek independent advice if necessary.
Disclaimer:
The above opinions given constitute general market commentary, and do not constitute the opinion or advice of IC Markets or any form of personal or investment advice.
Any opinions, news, research, analyses, prices, other information, or links to third-party sites contained on this website are provided on an "as-is" basis, are intended only to be informative, is not an advice nor a recommendation, nor research, or a record of our trading prices, or an offer of, or solicitation for a transaction in any financial instrument and thus should not be treated as such. The information provided does not involve any specific investment objectives, financial situation and needs of any specific person who may receive it. Please be aware, that past performance is not a reliable indicator of future performance and/or results. Past Performance or Forward-looking scenarios based upon the reasonable beliefs of the third-party provider are not a guarantee of future performance. Actual results may differ materially from those anticipated in forward-looking or past performance statements. IC Markets makes no representation or warranty and assumes no liability as to the accuracy or completeness of the information provided, nor any loss arising from any investment based on a recommendation, forecast or any information supplied by any third-party.
GBPUSD Brace for a Sharp Drop to 1.3000! Free signal!Hello everyone.
I want share my idea about GBPUSD.
The U.S.-China trade deal breakthrough has fueled USD strength, pressuring GBP/USD after a surge to 1.3330. BoE’s dovish stance, with a potential 25 bps rate cut priced in, contrasts with a hawkish Fed, favoring USD. Upcoming UK CPI and U.S. CPI data this week could drive volatility—soft UK inflation may weaken GBP, while high U.S. inflation could bolster USD further. UK wage growth (5.9%) offers GBP support, but weak PMI and employer sentiment cap gains. Watch U.S.-UK trade deal news for potential GBP upside.
With technical we can see last week we had some consolidation and this week started with high volatility and brake support. at the moment price testing resistance + 4h FVG.
Scenario 1 (Bearish – Primary View): Price rejects the 1.3200–1.3275 FVG/resistance zone and resumes its downtrend, targeting the next major support at 1.3000—a psychological and structural level. This aligns with USD strength from the trade deal and BoE’s dovish stance . Trade Setup: Short below 1.3200, target 1.3000, stop above 1.3300 (above FVG).
Scenario 2 (Bullish – Less Likely): Buyers break above the FVG (1.3275) and 1.3300, targeting 1.3350–1.3400. This would require a catalyst like soft U.S. CPI data weakening USD, but current fundamentals favor bears.
Trade Setup:
Entry below - 1.3190 (current price 1.32048) ensures confirmation of rejection.
Stop above - 1.3280 (above FVG) protects against a bullish breakout.
Target - I will follow trend with trail stop.
For collaboration text me private!
Always make your own research!!!

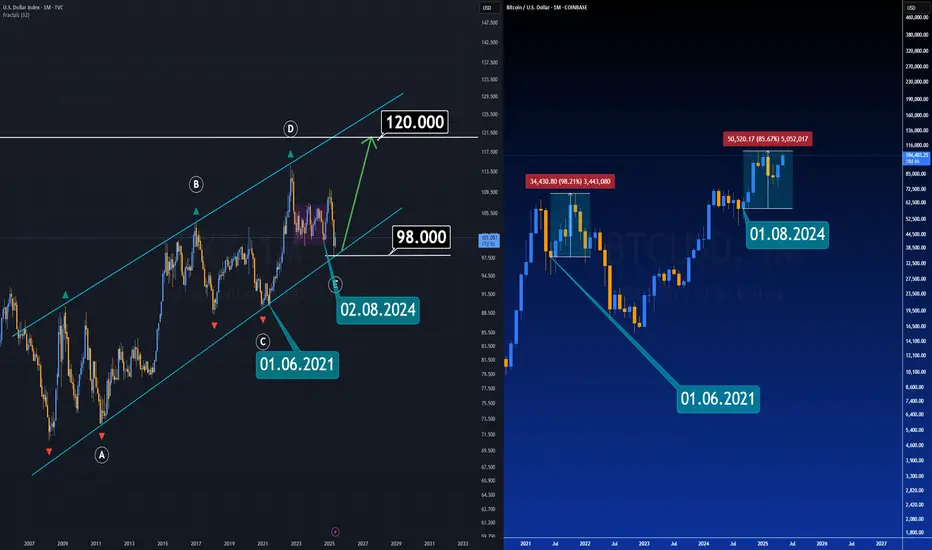
2 Charts in Monthly Time FrameThere’s a common misconception when it comes to the relationship between the U.S. Dollar Index (DXY) and Bitcoin — and it's time to take a deeper look.
While the short-term movements of DXY can create temporary pressure on Bitcoin, the broader correlation tells a different story. If you zoom out and analyze the larger structure, an interesting pattern begins to emerge.
Historically, when DXY enters a major rally within a wide-ranging diametric formation, Bitcoin doesn’t necessarily decline — in fact, it often follows the trend with a slight delay. This lag can vary between one to two months, but the eventual upward momentum in Bitcoin frequently aligns with DXY strength over extended periods.
So before drawing conclusions based on daily fluctuations, take a step back — compare the macro charts, connect the dots, and you'll start to see a bigger, more nuanced picture.
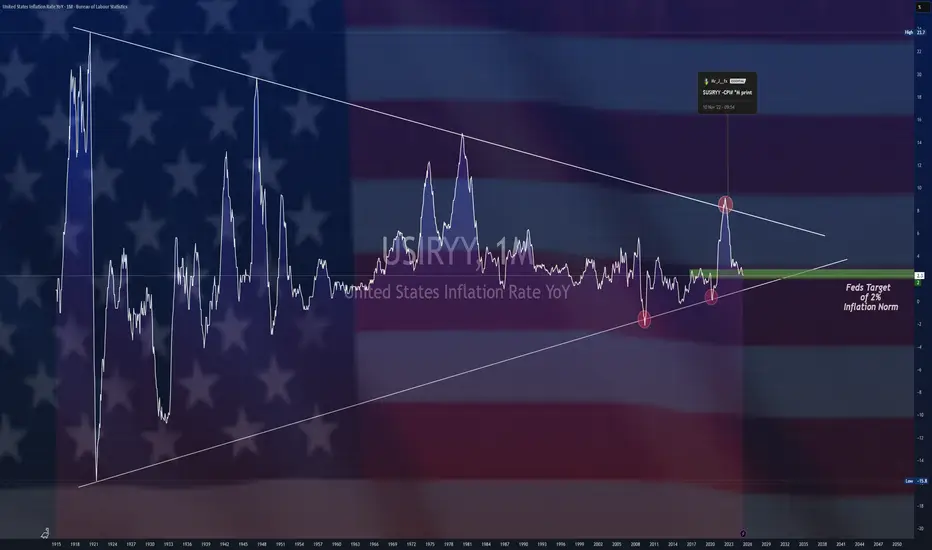
$USIRYY - U.S Inflation Rate Unexpectedly Slows (April/2025)ECONOMICS:USIRYY
April/2025
source: U.S. Bureau of Labor Statistics
- The annual inflation rate in the US eased to 2.3% in April, the lowest since February 2021, from 2.4% in March and below forecasts of 2.4%.
Prices of gasoline fell at a faster pace and inflation also slowed for food and transportation.
Compared to the previous month, the CPI rose 0.2%, rebounding from a 0.1% fall in March but below forecasts of 0.3%.
Meanwhile, annual core inflation rate steadied at 2.8% as expected, holding at 2021-lows.
DXY Dual Perspective: Smart Money OB Short vs. Mid-Term LongThis chart presents two perspectives:
My Perspective (Dipanshu - GreenFireForex):
Expecting a bearish reversal from the current Order Block (OB) between 101.9 – 103.2, possibly due to inefficiency and early liquidity sweep.
ChatGPT’s Refined Perspective:
OB refined to 102.4 – 103.0 zone, aligning with imbalance and previous H4 structure break. A rejection from there is more probable.
Target:
Both views expect a drop toward the Demand Zone at 96.4 – 96.3, with bullish reversal expected from that key support.
Let’s observe whether the DXY respects early inefficiency or reaches full OB.
Comment your bias below!
---

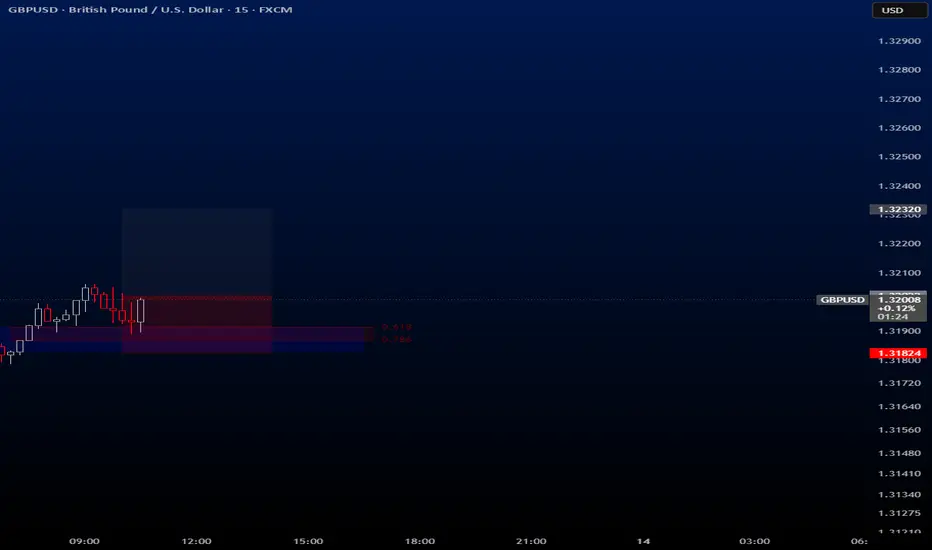
GBPUSDHello traders.
Today's first signal comes from GBPUSD. To be honest, I don’t feel entirely confident about this trade — but I’m still taking it, trusting my system and strategy.
🔍 Criteria:
✔️ Timeframe: 15M
✔️ Risk-to-Reward Ratio: 1:1.50
✔️ Trade Direction: Buy
✔️ Entry Price: 1.32022
✔️ Take Profit: 1.32320
✔️ Stop Loss: 1.31824
🔔 Disclaimer: This is not financial advice. It's a trade I’m taking based on my own system, shared purely for educational purposes.
📌 If you're also interested in systematic and data-driven trading strategies:
💡 Don’t forget to follow the page and subscribe to stay updated on future analyses.
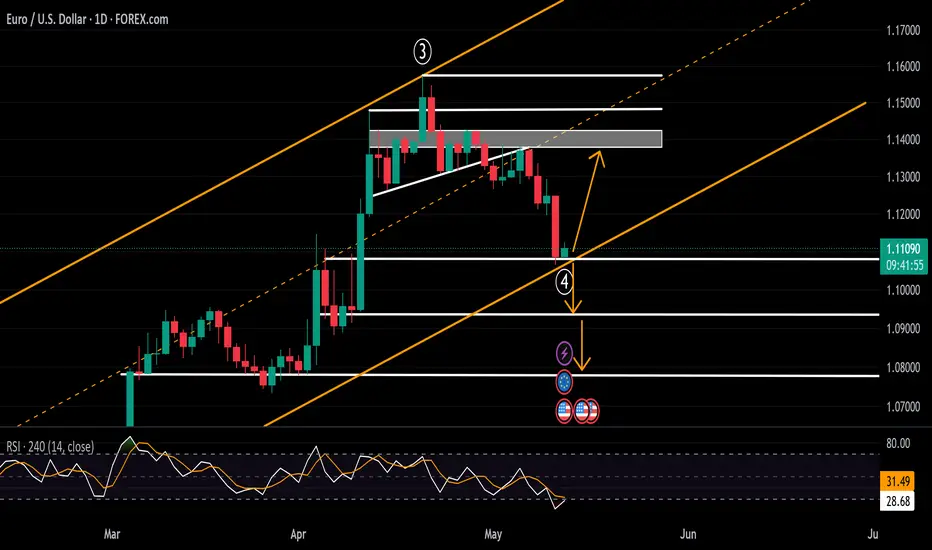
EURUSD Tests Head and Shoulders Target Ahead of CPIIn line with the inverted head and shoulders formation seen on the DXY from its 2025 lows, EURUSD has completed a breakout of its own head and shoulders pattern, reaching the 1.1070 target.
With the 4H RSI rebounding from oversold territory, a bullish bounce for EURUSD appears likely toward the 1.1140 level.
A clean hold above this resistance could extend gains to 1.1270, 1.1380, 1.1430, and eventually to the 2025 high at 1.1570.
If dollar strength resumes and EURUSD falls back below 1.1070, downside levels to watch include 1.1000, 1.0920, and 1.0760.
Written by Razan Hilal, CMT
DXY Rebound or Reversal? All Eyes on the Bearish OB Zone! Analysis:
As anticipated, DXY has now swept the major weekly/monthly sell-side liquidity (SSL) at 99.58, tapping deep into a high-probability reversal zone. This aggressive liquidity raid was followed by a sharp bullish reaction—marking the first signs of potential re-accumulation or a relief rally.
Currently, price is pushing back toward a bearish order block (OB) that aligns with a dense cluster of confluences:
A weekly FVG (Fair Value Gap)
A monthly FVG that’s been previously respected
Major supply resistance from previous highs around 108.40–109.39
This confluence zone is critical.
📍 Two Likely Scenarios:
Rejection from OB Zone: If price respects the OB, expect continuation to the downside—possibly targeting a deeper structural shift and breaking below the recent SSL.
Breakthrough & Reclaim: If price breaks and closes strongly above the OB zone, it opens the door for a move toward 114.60, the next major daily buy-side liquidity.
🧠 Either outcome offers a significant macro play, especially for risk-sensitive pairs (i.e., AUD, NZD, Gold, or equities inversely correlated to USD strength). Keep in mind, DXY's movement is heavily influenced by macroeconomic events, so dollar strength or weakness can cascade across global markets.
Key Levels to Watch:
Support: 100.215 / 99.58
Resistance: 108.40 → 109.39 OB zone
Upper Target if invalidated: 114.60
⚠️ DYOR. Let price confirm before bias is committed.

CADCHF watch the drop!!Good day traders, I recently share an Idea on CADCHF and if you go back and see what was outlined and how I ended the description. I highlighted that price might manipulate higher but as long as the overall bias remains we still on!!
How I look at the markets is I like to cross reference different pairs and GBPCAD confirmed my bearish outlook and so did AUDCAD. Study this setup till Sellside liquidity 🙏🏽

Final Flush Before 7000 - Gold & The DollarThe dollar should briefly correct while metals rally in the near term

news changed things. but we still bullish on GoldPrice pushed down a bit lower but it still makes since for it to take liquidity for gaps and continue with its push. We have to wait for the killzones to give us a better idea.

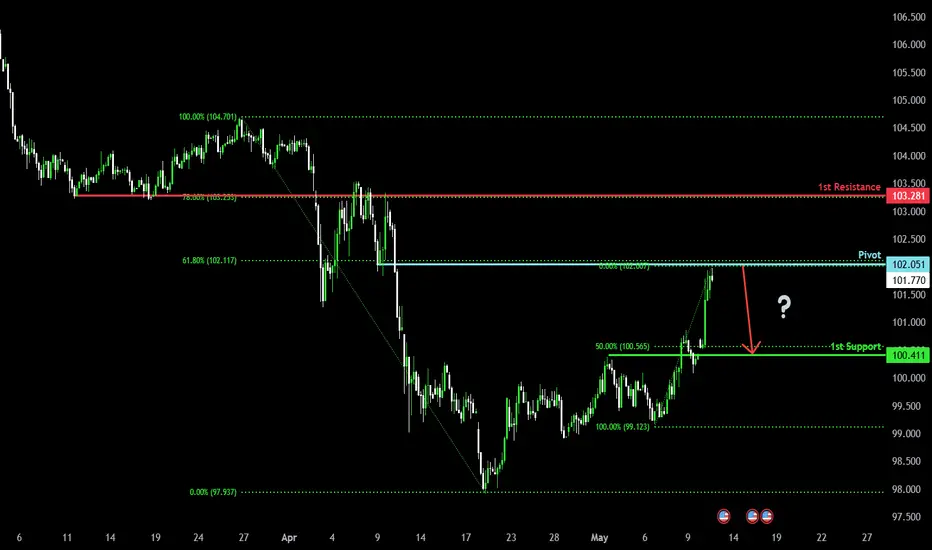
Bearish drop?US Dollar Index (DXY) is reacting off the pivot and could reverse to the 1st support.
Pivot: 102.05
1st Support: 100.41
1st Resistance: 103.28
Risk Warning:
Trading Forex and CFDs carries a high level of risk to your capital and you should only trade with money you can afford to lose. Trading Forex and CFDs may not be suitable for all investors, so please ensure that you fully understand the risks involved and seek independent advice if necessary.
Disclaimer:
The above opinions given constitute general market commentary, and do not constitute the opinion or advice of IC Markets or any form of personal or investment advice.
Any opinions, news, research, analyses, prices, other information, or links to third-party sites contained on this website are provided on an "as-is" basis, are intended only to be informative, is not an advice nor a recommendation, nor research, or a record of our trading prices, or an offer of, or solicitation for a transaction in any financial instrument and thus should not be treated as such. The information provided does not involve any specific investment objectives, financial situation and needs of any specific person who may receive it. Please be aware, that past performance is not a reliable indicator of future performance and/or results. Past Performance or Forward-looking scenarios based upon the reasonable beliefs of the third-party provider are not a guarantee of future performance. Actual results may differ materially from those anticipated in forward-looking or past performance statements. IC Markets makes no representation or warranty and assumes no liability as to the accuracy or completeness of the information provided, nor any loss arising from any investment based on a recommendation, forecast or any information supplied by any third-party.
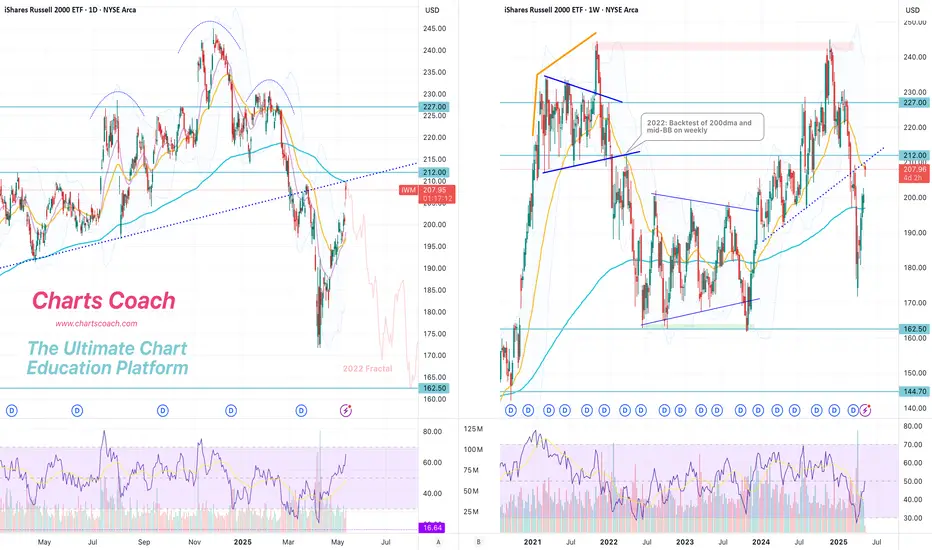
$IWM, small caps, not YET giving the "all clear"AMEX:IWM is the lone index still not in the clear 🚩 — backtesting its 200dma today and tagging the weekly mid-BB , just like in '22. Will it matter by week's end? If not, the bull is likely back across the board 🐂
This week's #CPI (Consumer Price Index) and #PPI (Producer Price Index) prints could significantly influence market direction across major indices — AMEX:SPY , NASDAQ:QQQ and AMEX:IWM — especially with rate cut expectations in flux. 🧵Here's how:
1. Hot CPI or PPI (above expectations):
AMEX:SPY : Likely to pull back as sticky inflation pressures broader S&P names, especially rate-sensitive sectors like real estate and utilities.
NASDAQ:QQQ : Could see sharper downside—tech stocks (many of which are high duration assets) are highly sensitive to interest rate expectations.
AMEX:IWM : Likely the hardest hit. Small caps suffer from tighter financial conditions and depend more on domestic borrowing costs.
🟥 Result: Bearish across the board, with small caps underperforming.
2. Cool CPI or PPI (below expectations):
AMEX:SPY : Broad lift, particularly in consumer discretionary and financials.
NASDAQ:QQQ : Strong rally—mega cap tech loves the prospect of lower yields.
AMEX:IWM : Outperforms if cooling inflation suggests easing ahead, since it's more leveraged to rate cycles and domestic growth.
🟩 Result: Bullish, with small caps possibly leading a relief rally.
3. In-line CPI/PPI :
Markets may stay choppy or consolidate, with AMEX:SPY and NASDAQ:QQQ more stable.
AMEX:IWM remains at risk of drifting lower unless there’s a strong dovish narrative from the Fed or other macro catalysts.
With small caps already lagging, this week’s inflation data could either validate its bearish divergence or spark a rotation rally if inflation
AMEX:SPY NASDAQ:QQQ TVC:VIX $ES_F $NQ_F $RTY_F TVC:TNX NASDAQ:TLT TVC:DXY #Tariffs #Stocks
EurUsd…Daily FVG fill.Good day traders, I’m back with another setup but this setup is based on the GBPUSD setup I posted yesterday…go and look at it, to get the ideological.
To be honest I don’t think the drop in price to start the week was unexpected because of the strength shown last week on the DXY and on the idea I posted on GBpUSD I highlighted that last week XXX/USD pairs did not perform as the USD/XXX pairs. Which explains why we open with a bearish move lower and now I believe price is gonna do as I expected it on GBPUSD before taking liquidity but strength was too strong.
EurUsd on this respective TF we can see that it has been on a downward movement, and if we take a look at that healthy bearish leg. Price has left imbalances but the most visible one is the volume imbalance that I have shown you on the chart. For the rest of the day should price closer above the VI than I believe we can expect it to move higher till Thursday before DXY continues moving higher.

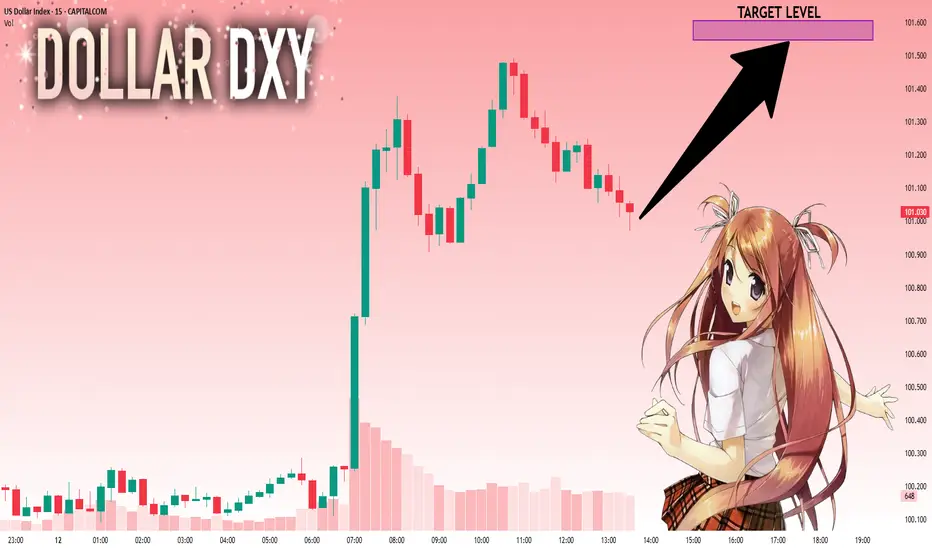
DXY: Strong Growth Ahead! Long!
My dear friends,
Today we will analyse DXY together☺️
The price is near a wide key level
and the pair is approaching a significant decision level of 100.977 Therefore, a strong bullish reaction here could determine the next move up.We will watch for a confirmation candle, and then target the next key level of 101.548.Recommend Stop-loss is beyond the current level.
❤️Sending you lots of Love and Hugs❤️