$DXY bullish from 96-98, massive bull flagDespite everyone calling for the death of the dollar, I think the dollar is in the process of bottoming and then will head higher.
Macron called for the Euro to replace the dollar (which is laughable) and likely marks a bottom.
Either we bounce here, or I could see the possibility of one more spike low down to the ~96 support level, but should we see a reaction there, it sets up a massive move higher in the dollar.
As you can see on the chart, we've been correcting inside of a bull flag, if we can form a low around $96-98, we will reverse and head higher to break the flag to the upside. Upside targets on the chart.
I think the bull market in the dollar is just starting, don't let the news scare you out of accumulating dollars over other fiat currencies.
DXY

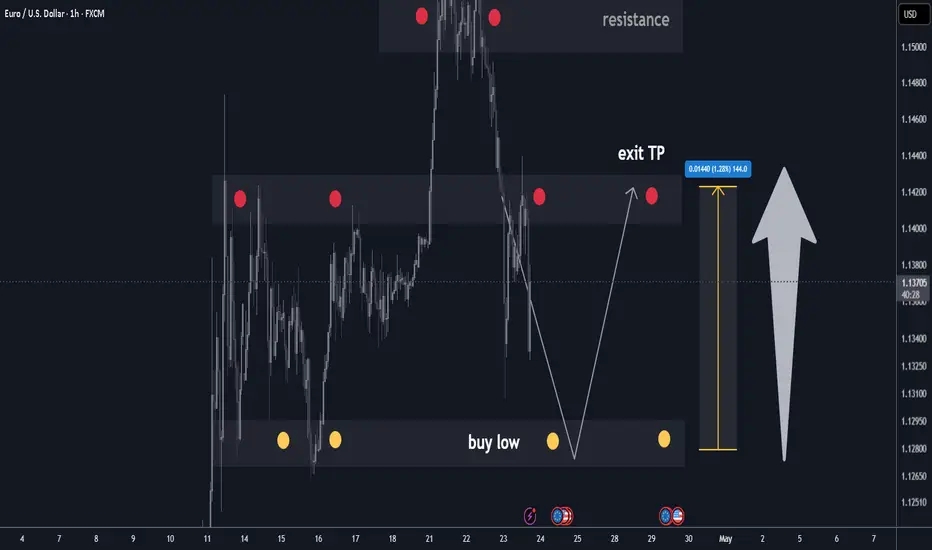
eurusd h1 best level to buy/hold +140 pips🏆 EURUSD Market Update
📊 Technical Outlook
🔸Short-term: BEARS 1280
🔸Mid-term: BULLS 1420
🔸Status: REVERSAL from S/R
🔸pullback in progress right now
🔸expecting bounce at key s/r
🔸Price Target Bears: 1280
🔸Price Target BULLS: 1420
🔸strategy: BUY LOW exit 1420
🔸+140 pips on BUY side
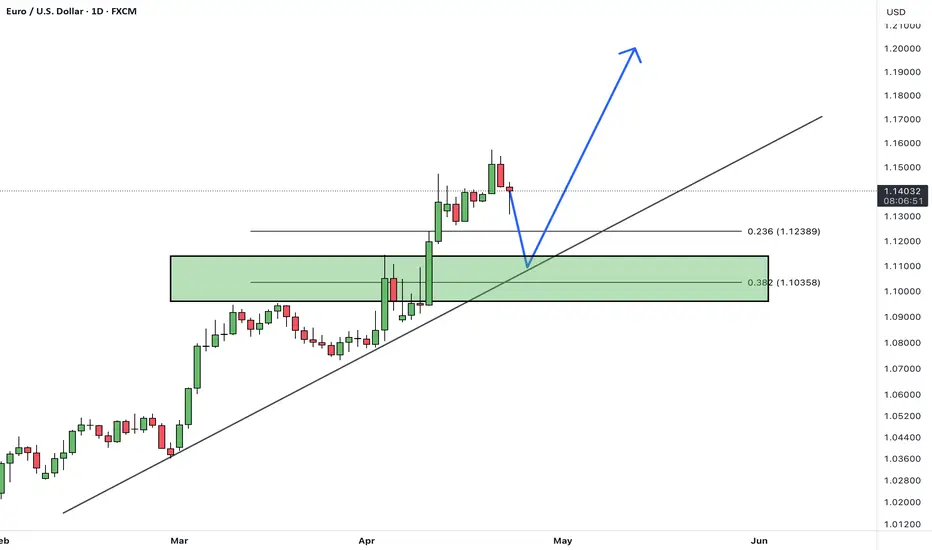
EURUSDHello Traders! 👋
What are your thoughts on EURUSD?
After a strong bullish rally that led to a breakout above the 1.12 resistance zone, EURUSD is now undergoing a correction.
We expect the price to pull back toward the identified support zone, where it may find demand and begin a new bullish wave.
As long as the price holds above the specified support zone and the ascending trendline, our outlook remains bullish. A successful retest of support could pave the way for the next leg higher.
Will the pullback offer a buying opportunity, or is a deeper correction ahead? Share your thoughts below!
Don’t forget to like and share your thoughts in the comments! ❤️
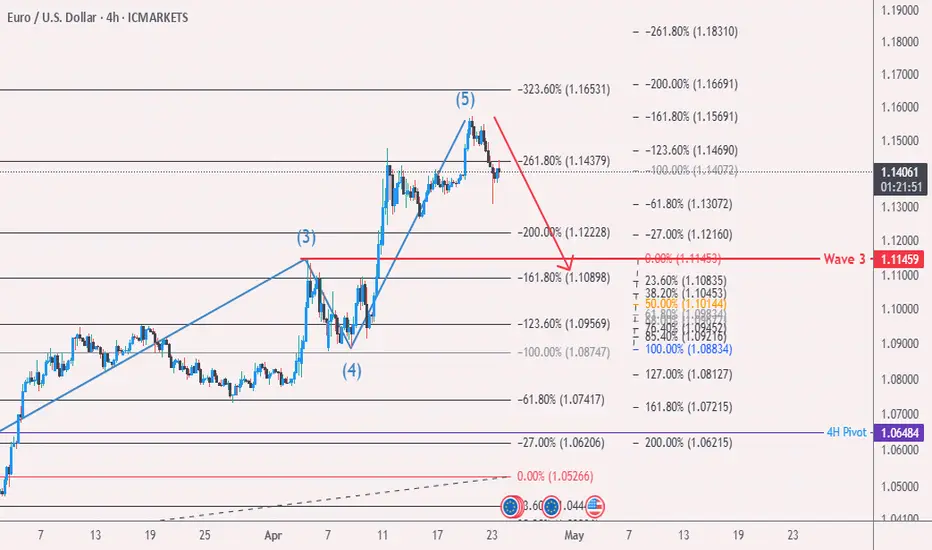
Eur/Usd Apr/23 Elliott wave AnalysisHello eveyone...
IMO 5th wave compelted...so i'm looking for Corrective Waves
USDCHF BULLISH OR BEARISH DETAILED ANALYSISWe are currently observing the USD/CHF pair, which is trading around 0.8225 as of April 23, 2025. The pair has recently experienced a slight uptick, driven by renewed demand for the US dollar following President Trump's decision to retract threats against Federal Reserve Chair Jerome Powell. This move has alleviated investor concerns regarding the Fed's independence, providing a temporary boost to the greenback.
Despite this short-term rally, the overall outlook for USD/CHF remains bearish. The pair is trading below the critical 100-day Exponential Moving Average (EMA), and the Relative Strength Index (RSI) is hovering near 36, indicating continued selling pressure. The immediate resistance level is identified at 0.8360, while the first support level to monitor is at 0.8121.
Fundamentally, the Swiss franc has appreciated significantly, surging approximately 9% against the US dollar in April alone. This appreciation is attributed to global uncertainties stemming from shifting US trade policies, which have increased demand for safe-haven assets like the franc. The Swiss National Bank (SNB) is under pressure to address this rapid rise, as it poses risks to their inflation targets and the competitiveness of Swiss exports.
In conclusion, while there may be short-term fluctuations influenced by geopolitical developments and central bank communications, the prevailing trend for USD/CHF appears bearish. Traders should remain cautious and monitor key support and resistance levels, as well as fundamental factors that could impact the pair's trajectory.

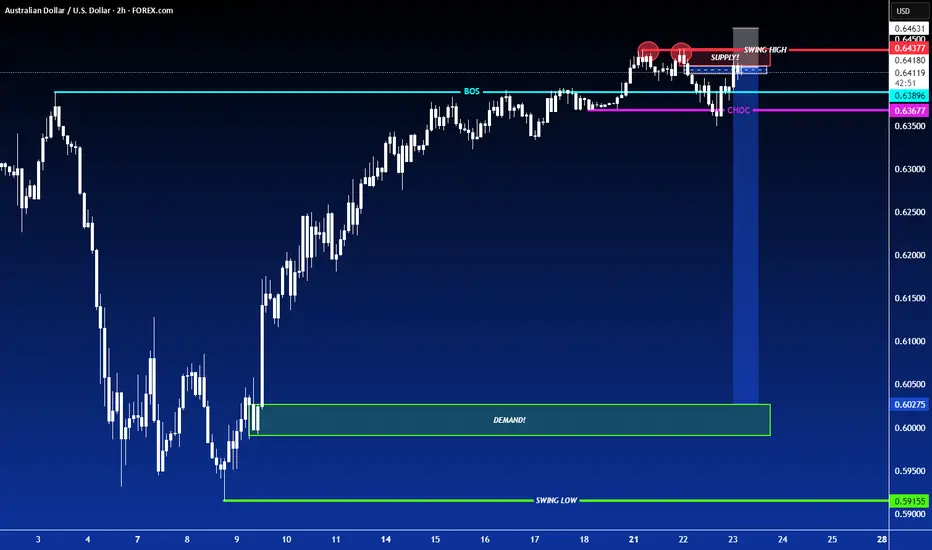
SHORT ON AUD/USDAUD/USD has given us a double top at a major resistance area/zone.
It has currently formed a lower high after giving us a change of character (choc) to the downside.
I expect price to drop to the next demand level for 200-300 pips.
Dxy News for the rest of the week should help fuel the move if positive for the dollar.
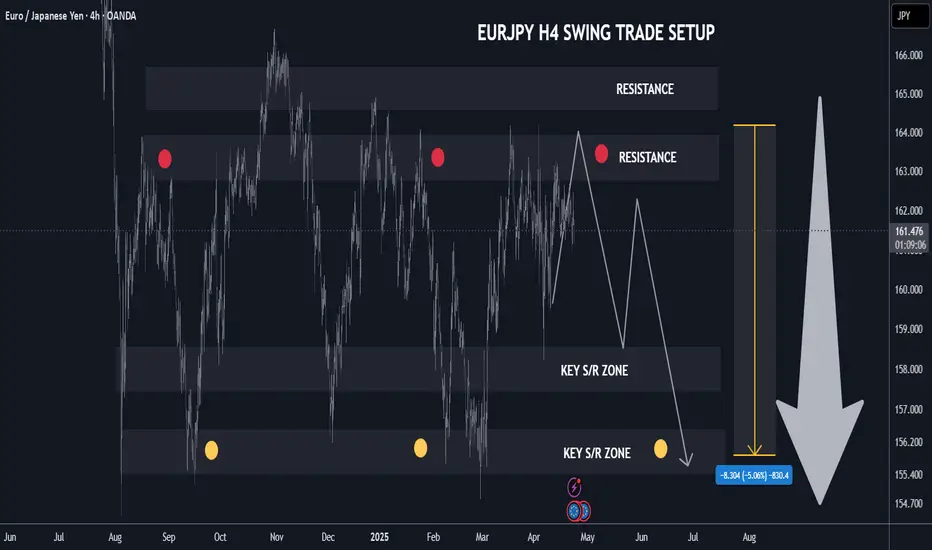
+300/+500 pips EURJPY Swing Trade Setup H4 TF🏆 EURJPY Market Update H4 chart
📊 Technical Outlook
🔸trading in well defined range
🔸Short-term: BULLS final pump
🔸Mid-term: BEARS 158.00
🔸Status: REVERSAL from S/R
🔸163.50/165.00 heavy resistances
🔸158.00/156.00 key s/r zones below
🔸Price Target Bears: 158
🔸Price Target BULLS: 1140/1160
🔸strategy: SHORT SELL 163.50
🔸SL 75 pips TP1 +300 pips TP2 +500 pips
🔸swing trade setup for patient traders
📊 Forex Market Update (April 23, 2025)
🇪🇺 EUR/USD
📉 Price: ~1.1380
💪 Pressure from strong USD
🔻 Weak German PMI; ECB may cut rates
⚠️ Key Levels: Support 1.1300 | Resistance 1.1400
🇬🇧 GBP/USD
📉 Price: ~1.3300 (Down from 7-month high at 1.3424)
🇺🇸 USD rebound on Trump's comments
🏦 Market cautious on BoE policy
⚠️ Key Levels: Support 1.3280 | Resistance 1.3420
🇺🇸 DXY (US Dollar Index)
📈 Price: 99.18 (Recovering from recent low 97.92)
🗣️ Boosted by Trump reassurance on Fed leadership
⚠️ Remains pressured by trade tensions & Fed concerns
📌 Key Levels: Support 95, 90 | Resistance 101, 107
🔔 Market Volatility Alert: Watch for geopolitical updates & central bank news closely!
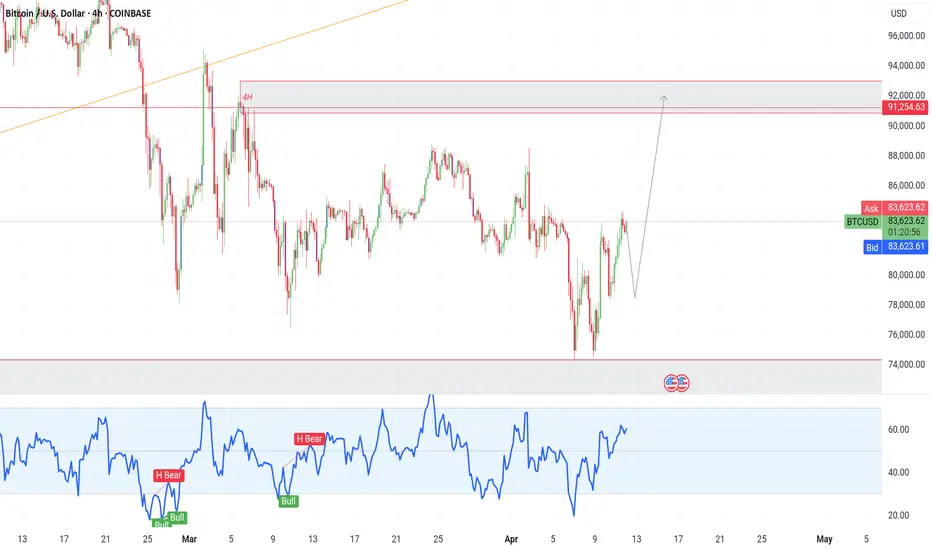
BTC on high time frame
"Hello traders, focusing on BTC on high time frames, the price is currently in a bearish trend on the weekly chart but is indicating potential movement towards $92,000 for the next scenario. Depending on your strategy as either a holder or trader, consider your approach for the short or long term.
In my view, $78,000 appears to be a favorable zone for buying."
If you need further assistance or have any specific questions, feel free to let me know!
BTCUSD Intraday Move 22-04-2025📊 BTCUSD Analysis – April 22, 2025
Price action is currently forming a rising wedge, typically a bearish pattern, indicating that a short-term correction may occur before the next bullish impulse. The structure shows consolidation with weakening momentum, suggesting that a pullback to demand zones is likely.
We have two strong support zones identified:
Zone 1: 86,400 – 86,800 — minor support from recent consolidation.
Zone 2: 84,700 – 85,100 — major demand area aligned with previous breakout and price reaction.
A retracement into either of these zones offers high-probability buy opportunities for continuation toward the upper resistance trendline and prior high near 89,700.
📈 BTCUSD Buy Signal:
Buy Entry #1: 86,400 – 86,800
Buy Entry #2: 84,700 – 85,100
Take Profit: 89,700
Stop Loss:
For Entry 1: Below 86,200
For Entry 2: Below 84,500
Trade Idea: Wait for bullish price action (engulfing candle, pin bar, or volume spike) before entering.

DXY: Strong Bullish Sentiment! Long!
My dear friends,
Today we will analyse GOLD together☺️
The price is near a wide key level
and the pair is approaching a significant decision level of 98.127 Therefore, a strong bullish reaction here could determine the next move up.We will watch for a confirmation candle, and then target the next key level of 98.393.Recommend Stop-loss is beyond the current level.
❤️Sending you lots of Love and Hugs❤️

DXY Bearish Pennant Breakdown | More Downside Ahead?The U.S. Dollar Index (DXY) has broken down from a well-defined bearish pennant pattern on the 4H chart, signaling continuation of the prevailing downtrend.
🔹 Technical Setup:
Pattern: Bearish Pennant
Breakdown Level: Below 99.00
Target: ~94.50 based on pennant pole projection
Confirmation: Clear follow-through after breakdown, low volume consolidation
🔹 Fundamentals:
Weak U.S. economic data and dovish Fed expectations continue to weigh on the dollar.
Rising gold and commodity prices further support DXY downside.
📌 Outlook: As long as DXY trades below 99.00 resistance, bearish momentum is likely to extend toward the 94.50 target zone.
NOTE: This is not financial advice. Trade at your own risk. Always do your own research.

Dollar Milkshake Theory: Will the US Dollar Suck the World Dry?Imagine a colossal milkshake party where every country brings its own flavor—sweet euros, tangy yen, spicy rupees—blended into a global liquidity shake. Now picture the United States, armed with a giant straw, slurping up every last drop while the rest of the world watches in dismay. 🍓🍫🍦 This vivid analogy isn’t just a quirky dessert dream—it’s the heart of Brent Johnson’s Dollar Milkshake Theory, a provocative economic idea that’s been shaking up financial circles since 2018. But is the US dollar really about to dominate the global economy, or will it choke on its own straw? Let’s dive into this creamy concoction of macroeconomics, recent trends, and global stakes—complete with a cherry of skepticism on top! 🍒
🥛 What’s the Dollar Milkshake Theory, Anyway?
Brent Johnson, CEO of Santiago Capital, isn’t just a wealth manager—he’s a financial storyteller who’s been stirring the pot with his Dollar Milkshake Theory. Picture this: the global economy is a giant milkshake, with frothy assets (stocks, bonds, commodities) floating on top, and the milk, cream, and sugar representing the cash flows between markets. The straw? That’s the US Federal Reserve’s monetary policy, sucking up liquidity when it tightens, leaving other economies parched.
Johnson’s core idea is simple yet bold: during global economic turmoil, the US dollar—thanks to its status as the world’s reserve currency—becomes a safe haven. Investors worldwide flock to it, driving its value skyward while other currencies wither. 🌎💰 Since 2008, global central banks have pumped roughly $30 trillion in liquidity into the system through quantitative easing (QE), creating a massive “milkshake” of money. But when the Fed raises rates, as it has in recent years, the US siphons that liquidity, leaving other nations scrambling to pay dollar-denominated debts.
Here’s the kicker: this isn’t a one-time sip. Johnson predicts a feedback loop where the dollar’s strength forces other countries to print more of their own currencies to buy dollars, further weakening their economies and reinforcing the dollar’s dominance. It’s a vicious cycle—a “milkshake” that could leave the global economy in a sticky mess. 🌀
📈 The Recipe for Dollar Dominance: Why the US Holds the Straw
Why does the US get to drink everyone else’s milkshake? It’s all about structural advantages baked into the global financial system:
Reserve Currency Status 💵: The US dollar has been the world’s reserve currency since the 1944 Bretton Woods Agreement. As of 2022, it accounted for 58% of global foreign exchange reserves, dwarfing the euro’s 20% share . From oil to copper, most global trade is priced in dollars, creating constant demand.
Deep Capital Markets 🏦: The US has the deepest and most liquid bond markets, especially for Treasuries, making it the go-to place for investors seeking safety during crises.
Higher Interest Rates 📊: When the Fed raises rates, as it did aggressively in 2022-2023 to combat inflation, the dollar becomes more attractive compared to currencies like the euro or yen, where central banks like the ECB and BOJ have been slower to tighten .
Global Dependence on Dollars 🌐: Over 60% of international reserves are in dollars, and many countries and corporations hold dollar-denominated debt. When the dollar strengthens, their debt burden skyrockets, forcing them to buy more dollars to service it .
Johnson argues this isn’t just a cyclical trend—it’s a structural feature of the modern financial system. As he put it on Real Vision in 2018, “The dollar’s dominance is structural, not cyclical”. The US doesn’t just sip the milkshake—it guzzles it, leaving others to scrape the bottom of the glass. 🥤
📅 2025 Reality Check: Is the Milkshake Theory Playing Out?
Fast forward to April 2025, and the global economy is a blender of chaos: trade tensions, high debt levels, and monetary policy shifts are whipping up a storm. Does Johnson’s theory hold water—or rather, milk? Let’s look at the evidence. 🕵️♂️
🟢 The Bull Case: The Dollar’s Straw Is Sucking Hard
DXY Strength in 2024-2025: The US dollar index (DXY) surged 7% in 2024, hitting a two-year high of 108.07 in November 2024, driven by US economic growth, tariffs, and global uncertainty . Despite a recent 8% drop over the last two months (from ~106.8 in mid-February 2025 to 98.423 as of April 22, 2025), the DXY remains near historic highs, aligning with Johnson’s prediction of dollar strength during stress.
Historical Precedents: During the 2020 COVID crisis, the DXY jumped as the Fed provided $450 billion in swap lines to ease dollar shortages globally, reinforcing the dollar’s safe-haven role. In 2022, Russia’s invasion of Ukraine pushed the DXY to a 20-year high of 114, as capital fled to the US amid Europe’s energy crisis.
Global Liquidity Squeeze: High-debt economies like Japan (debt-to-GDP at 255%) and the Eurozone (Italy at 139%, France at 112%) are under pressure. Capital flight to the US, especially if their growth falters, supports the milkshake effect.
Safe-Haven Demand: Posts on X reflect sentiment that the dollar’s strength is tied to its stability in an unstable world, with some users noting its “dug-in” status as global liquidity flows to the US .
🔴 The Bear Case: Is the Straw Starting to Bend?
Recent DXY Drop: The 8% decline in the DXY over the last two months (mid-February to April 2025) signals vulnerability. Trade war fears, threats to Fed independence, and a weakening US trade balance are weighing on the dollar. Some X users predict a further drop to 96-97, or even 87, if support levels break.
Fed Policy Shifts: The Fed began cutting rates in September 2024, which typically weakens the dollar by reducing its yield advantage. This move, aimed at balancing inflation and growth, could undermine the milkshake effect if it continues.
Dedollarization Efforts: BRICS nations are pushing to reduce dollar reliance, with China and India holding significant non-dollar reserves ($3,682 billion and $662 billion, respectively, as of April 2025). A shift toward commodity-based currencies could challenge the dollar long-term.
US Debt Concerns: The US’s soaring debt levels (over 120% of GDP in 2024) and inflation above the Fed’s 2% target raise questions about the dollar’s sustainability. If confidence in US fiscal health wanes, the milkshake could spill.
🌪️ What Happens If the Milkshake Theory Plays Out?
If Johnson is right, the global economy could face a bitter aftertaste. Here’s what a super-strong dollar might mean:
Currency Crises Abroad 💥: Countries with dollar-denominated debt—like many emerging markets—would struggle as their debt burdens soar. A stronger dollar means they need more of their own currency to buy dollars, potentially triggering defaults.
Commodity Price Slumps 📉: A rising dollar often leads to lower commodity prices (priced in dollars), hurting exporters like Brazil or Australia. This could stifle growth in developing economies.
US Export Woes 🚢: An overly strong dollar makes US goods pricier abroad, hurting American exporters. US companies could lose competitiveness, impacting economic growth.
Safe-Haven Asset Boom 🪙: Investors might flock to alternatives like gold or Bitcoin to hedge against currency devaluation. Gold recently hit $3,400 amid the DXY’s slide, and Bitcoin has seen gains as a “risk-on” asset.
Geopolitical Shifts 🌍: A dominant dollar could lead more countries to peg their currencies to the USD for stability, as 65 nations already do (e.g., Hong Kong, Saudi Arabia). But it might also accelerate dedollarization efforts, with BRICS nations seeking alternatives.
🤔 Skeptics Stir the Pot : Is the Milkshake Theory Too Sweet to Be True?
Not everyone’s sipping Johnson’s milkshake. Critics argue it’s more of a financial fairy tale than a robust theory:
Oversimplification 📊: The global economy is far more complex than a milkshake analogy. The theory focuses heavily on Fed policy but downplays other central banks’ actions, geopolitical tensions, and the rise of digital currencies.
Lack of Timeframes ⏳: Johnson’s predictions lack clear timelines, making them hard to test. As some X users have pointed out, being “too early” in financial markets is as good as being wrong.
Counter-Theories 🌐: Economist Zoltan Pozsar’s Bretton Woods III Theory suggests a shift toward commodity-based currencies in the East, potentially weakening the dollar. Post-Russia-Ukraine war, nations are diversifying away from the USD, favoring hard assets like gold.
US Vulnerabilities 🇺🇸 : The US’s own fiscal health—high debt, persistent inflation, and trade deficits—could undermine the dollar. Recent tariffs and supply chain shifts (e.g., moving away from China) may raise production costs, fueling inflation and slowing growth.
💡 What’s Next for the Dollar Milkshake in 2025 and Beyond?
As of April 22, 2025, the DXY’s recent 8% drop is a speed bump, not a derailment, for the Milkshake Theory. The long-term chart you provided projects the DXY climbing to 120-130 by the late 2020s, suggesting this dip might be a correction within a broader uptrend. But the road ahead is frothy with uncertainty:
Watch the Fed 🏛️: If the Fed continues rate cuts, the dollar’s yield advantage could shrink, slowing the milkshake effect. Conversely, renewed tightening could reignite dollar strength.
Global Crises ⚡: Ongoing trade wars, like US-China tensions, or new geopolitical shocks could drive more capital to the US, reinforcing the theory.
Dedollarization Risks 🌏: If BRICS nations succeed in reducing dollar reliance, the US straw might not suck as hard in the future.
🥛 Sip or Spill: Should You Buy Into the Milkshake Theory?
Brent Johnson’s Dollar Milkshake Theory is a compelling narrative that captures the US dollar’s unique power in a turbulent world. The evidence—DXY strength, historical crises, and global dollar demand—suggests there’s cream in this shake. But the theory isn’t without cracks: the US’s own vulnerabilities, dedollarization efforts, and the recent DXY dip remind us that even the mightiest straw can bend. 🥤
For investors, this means staying nimble. A stronger dollar could hurt emerging markets and commodities, but it might boost safe-haven assets like gold or Bitcoin. Keep an eye on Fed policy, global growth, and geopolitical shifts—they’ll determine whether the US keeps sipping or the milkshake spills. 🌍💸 What do you think—will the dollar dominate, or is the party over? Let’s hear your thoughts! 🗣️

Gold Making New Highs! Will it continue?Took a mental break for a second to give price a chance to show more of what it wanted to do. Now that we are in a new week expecting the bullish price action to continue. We are just waiting for the right moment to enter the position.

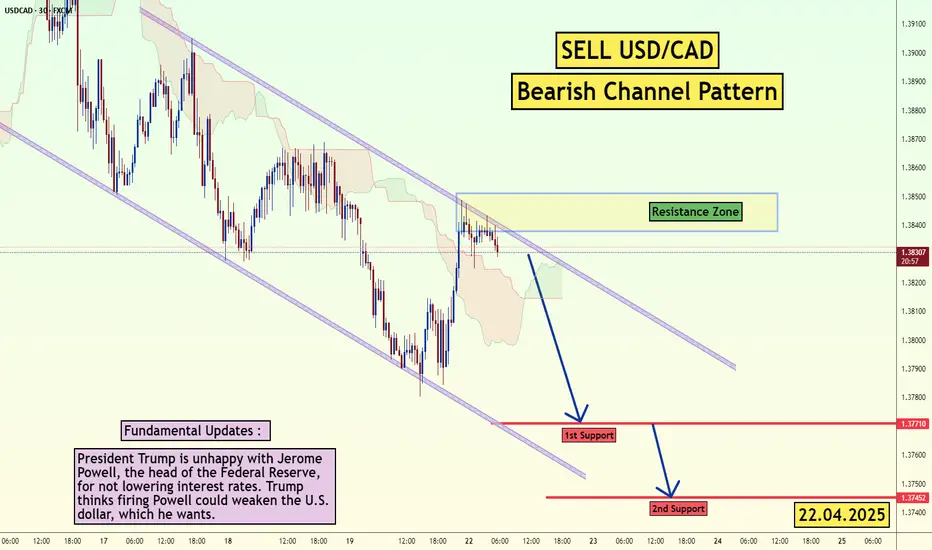
USD/CAD - Channel Pattern (22.04.2025)The USD/CAD Pair on the M30 timeframe presents a Potential Selling Opportunity due to a recent Formation of a Channel Pattern. This suggests a shift in momentum towards the downside in the coming hours.
Possible Short Trade:
Entry: Consider Entering A Short Position around Trendline Of The Pattern.
Target Levels:
1st Support – 1.3771
2nd Support – 1.3745
🎁 Please hit the like button and
🎁 Leave a comment to support for My Post !
Your likes and comments are incredibly motivating and will encourage me to share more analysis with you.
Best Regards, KABHI_TA_TRADING
Thank you.
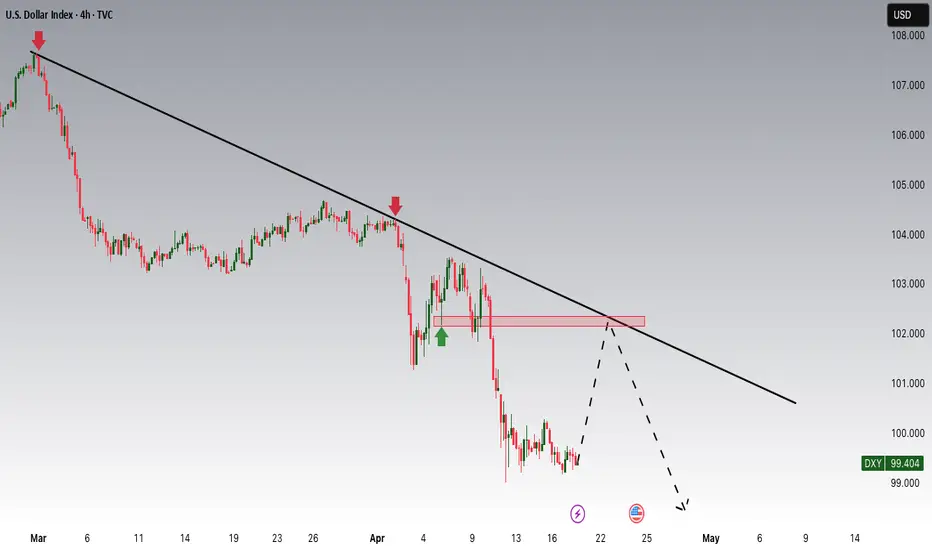
DXY is Strugglig to GrowHey Traders, in today's trading session we are monitoring DXY for a selling opportunity around 102 zone, DXY is trading in a downtrend and currently is in a correction phase in which it is approaching the trend a 102 support and resistance area.
Trade safe, Joe.
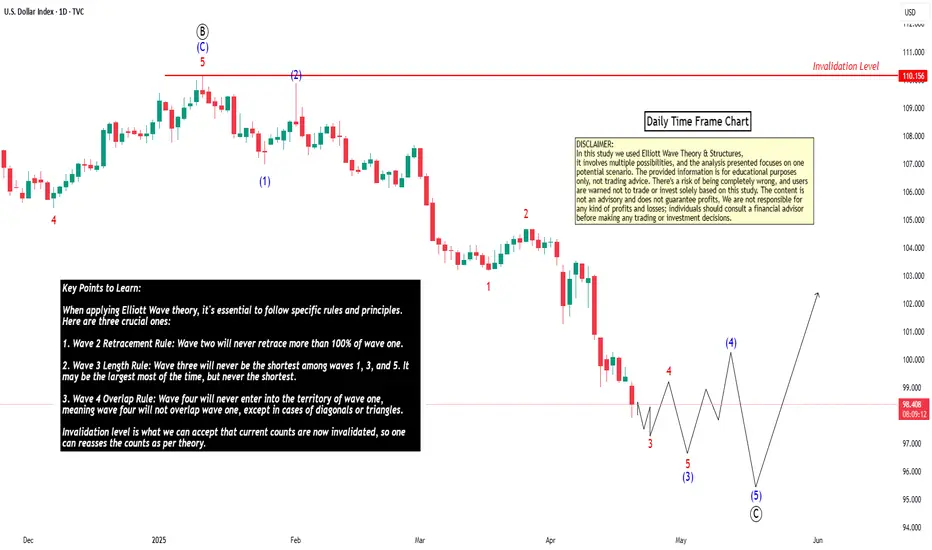
Elliott Wave Principles: A Study on US Dollar IndexHello friends, today we'll attempt to analyze the (DXY) US Dollar Index chart using Elliott Wave theory. Let's explore the possible Elliott Wave counts with wave Principles (Rules).
We've used the daily time frame chart here, which suggests that the primary cycle degree in Black weekly wave ((A)) and ((B)) waves have already occurred. Currently, wave ((C)) is in progress.
Within wave ((C)) in Black which are Weekly counts, Subdivisions are on daily time frame, showing Intermediate degree in blue wave (1) & (2) are finished and (3) is near to completion. Post wave (3), we can expect wave (4) up in Blue and then wave (5) down in Blue, marking the end of wave ((C)) in Black.
Additionally, within blue wave (3) Intermediate degree, we should see 5 subdivisions in red of Minor degree, which is clearly showing that waves 1 & 2 are done and now we are near to completion of wave 3 in Red. followed by waves 4 and 5, which will complete blue wave (3).
Key Points to Learn:
When applying Elliott Wave theory, it's essential to follow specific rules and principles. Here are three crucial ones:
1. Wave 2 Retracement Rule: Wave two will never retrace more than 100% of wave one.
2. Wave 3 Length Rule: Wave three will never be the shortest among waves 1, 3, and 5. It may be the largest most of the time, but never the shortest.
3. Wave 4 Overlap Rule: Wave four will never enter into the territory of wave one, meaning wave four will not overlap wave one, except in cases of diagonals or triangles.
Invalidation level is a level which is decided based on these Elliott wave Principles only, Once its triggered, then counts are Invalidated so we have to reassess the chart study and other possible counts are to be plotted
The entire wave count is clearly visible on the chart, and this is just one possible scenario. Please note that Elliott Wave theory involves multiple possibilities and uncertainties.
The analysis we've presented focuses on one particular scenario that seems potentially possible. However, it's essential to keep in mind that Elliott Wave counts can have multiple possibilities.
I am not Sebi registered analyst.
My studies are for educational purpose only.
Please Consult your financial advisor before trading or investing.
I am not responsible for any kinds of your profits and your losses.
Most investors treat trading as a hobby because they have a full-time job doing something else.
However, If you treat trading like a business, it will pay you like a business.
If you treat like a hobby, hobbies don't pay, they cost you...!
Hope this post is helpful to community
Thanks
RK💕
Disclaimer and Risk Warning.
The analysis and discussion provided on in.tradingview.com is intended for educational purposes only and should not be relied upon for trading decisions. RK_Charts is not an investment adviser and the information provided here should not be taken as professional investment advice. Before buying or selling any investments, securities, or precious metals, it is recommended that you conduct your own due diligence. RK_Charts does not share in your profits and will not take responsibility for any losses you may incur. So Please Consult your financial advisor before trading or investing.
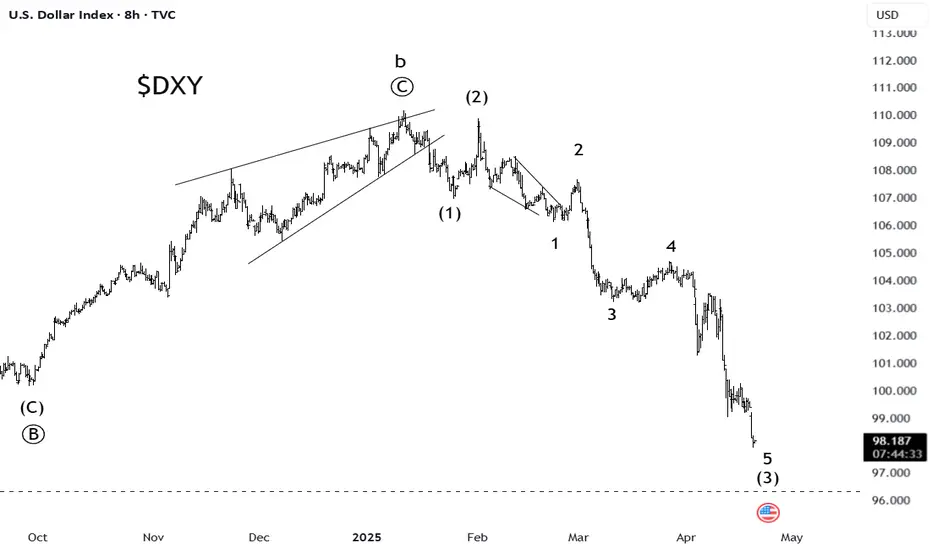
US Dollar Index Decline in Wave C of A FlatTVC:DXY - has been trading lower from the 110 peak in wave "c" of a larger flat. We are currently in the late stages of wave (3) of "c".
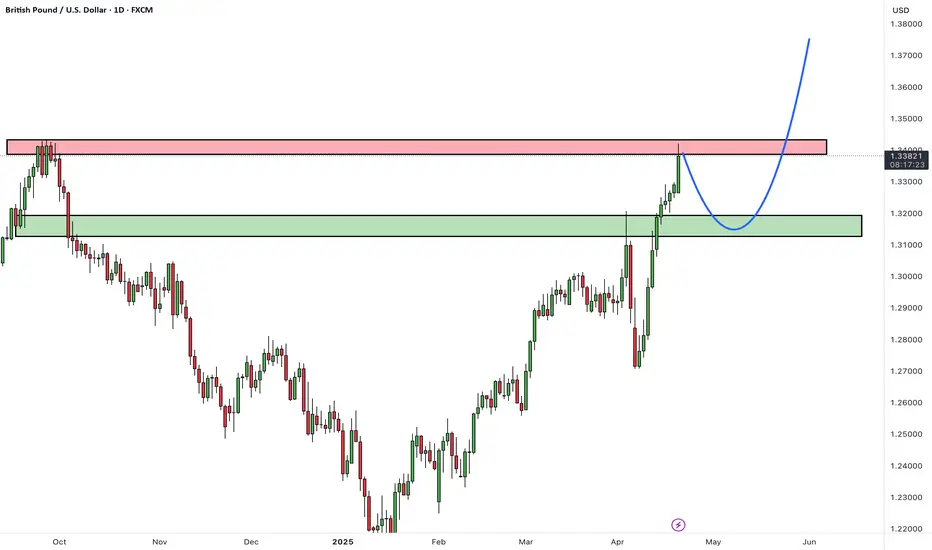
GBPUSDHello Traders! 👋
What are your thoughts on GBPUSD?
GBPUSD has reached a resistance zone, where a correction is expected.
We anticipate a pullback toward the specified support level, which could act as a launchpad for the next bullish move.
After completing the correction, the pair is expected to resume its upward movement toward the specified targets.
Will GBPUSD use the pullback as a springboard for further gains? Share your thoughts below!
Don’t forget to like and share your thoughts in the comments! ❤️
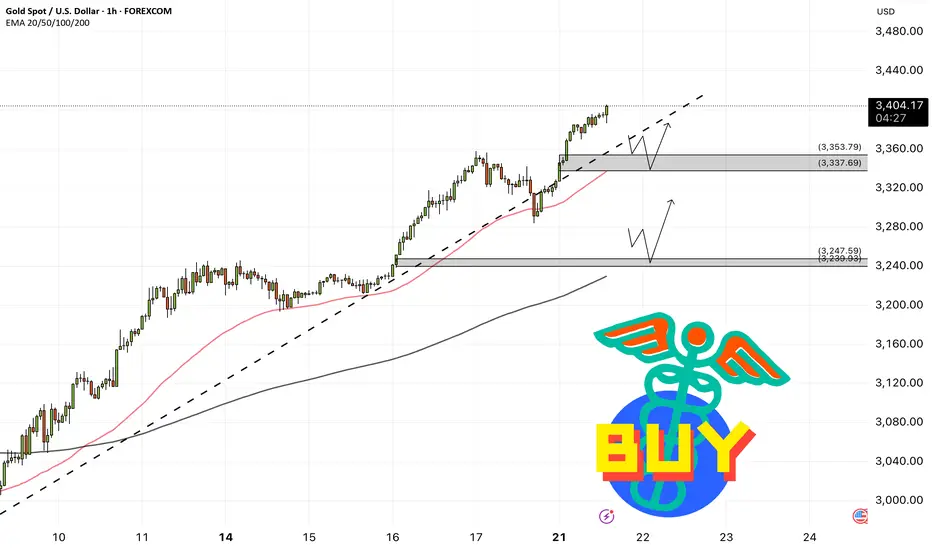
XAUUSD - When will the gold trend reverse?!Gold is above the EMA200 and EMA50 on the 1-hour timeframe and is in its ascending channel. A downward correction of gold towards the demand zone will provide us with the next buying position with a good risk-reward ratio. We expect a fluctuation of $10-15 in each range.
The global gold market has experienced notable shifts in trade flows following the removal of retaliatory tariffs on metals imposed by the Trump administration. According to data, a significant portion of gold that had been moved to New York since December is now being returned to Switzerland, its original destination.
Swiss customs data reveals that gold imports from the United States surged to 25.5 metric tons in March—the highest level in 13 months—up from just 12.1 tons in February. In contrast, gold exports from Switzerland to the U.S. dropped by 32%, falling to 103.2 tons.
For the first time in over 14 months, Comex-approved warehouses, part of the CME Group, have recorded consistent outflows of gold. These outflows indicate a reduction in U.S. futures premiums and a decline in trader anxiety following the removal of tariffs.
Switzerland has once again emerged as the primary destination for gold leaving American vaults, reaffirming its central role in global gold refining and logistics. Nevertheless, a portion of the gold stored in U.S. warehouses continues to serve as a hedge against market uncertainties.
In an average year, the U.S.consumes around 115 metric tons of gold in the form of physical coins and bars. Current data suggests that kilobar inventories held in CME warehouses are sufficient to meet this demand for nearly 12 years.
The gold market remains heavily influenced by geopolitical and economic factors. These developments highlight Switzerland’s importance in refining and transportation, as well as the United States’ significant role in gold storage and resource management.
Meanwhile, a growing number of economic forecasts are warning that the U.S. may be entering a period of “stagflation”—a situation characterized by stagnating economic growth coupled with persistently high inflation. Tariffs have the potential to drive up consumer prices while simultaneously slowing growth, placing financial pressure on households, particularly if the labor market deteriorates.
Central banks face serious challenges in responding to stagflation through monetary policy, as efforts to address one side of the issue often exacerbate the other. Even if the U.S. economy avoids a recession triggered by tariffs, many economists foresee rising risks of a painful stagflationary period.
While economic experts remain divided on whether former President Trump’s trade wars will ultimately tip the economy into recession, a large number of recent forecasts underscore the increasing threat of prolonged inflation combined with sluggish growth. Numerous analysts, including Federal Reserve officials, argue that tariffs are likely to hamper economic expansion and weaken the labor market, all while elevating consumer prices.
However, Lindsey Piegza, chief economist at Stifel Financial, is among those who believe the labor market and consumers remain resilient enough to help the economy steer clear of a full-blown recession—assuming recently announced tariffs are eventually scaled back.
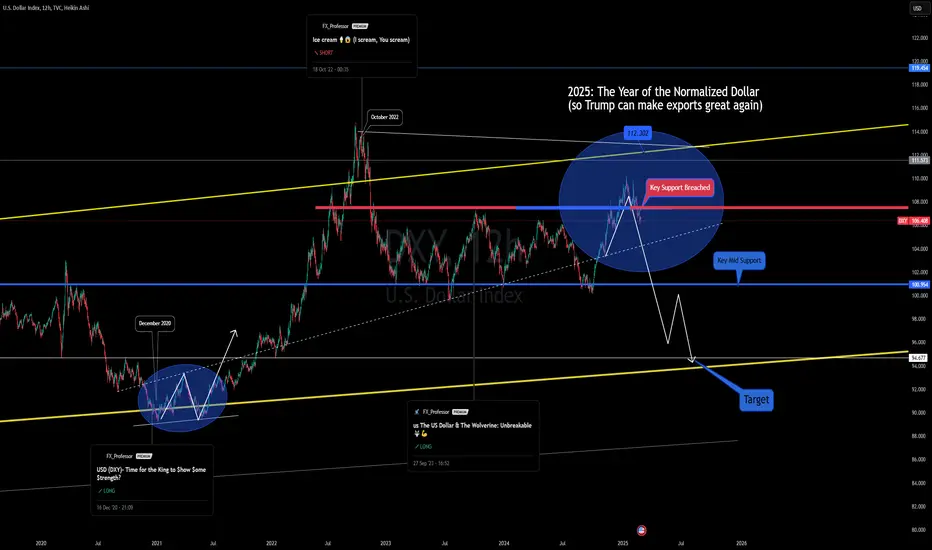
2025 – The Year of the Normalized Dollar (Part Two)📉💵 2025 – The Year of the Normalized Dollar: Part Two 🔄🔥
Part 1:
As we kick off the week on April 21st, we find gold hitting historic highs of $3,400 while the U.S. Dollar Index (DXY) continues to slide — down 1.42% and firmly below the psychological 100 level. 📉 The breakdown at 99.3 confirms what we mapped out months ago.
Back in February, I highlighted the rejection at the 107.5 level and predicted that 2025 would mark The Year of the Normalized Dollar. That vision is unfolding exactly as drawn.
🔍 Technical Breakdown Recap
Rejection Zone: 107.5
Mid Support Breached: 100.95
Breakdown Level: 99.3
Next Target Range: 94.6–93.7 🧭
The visuals attached here are not new drawings — this is the same framework from my February 25th analysis, and it's playing out beautifully. 📊 The DXY is on a structural path toward normalization, aligning with macro policy shifts.
🗣️ Policy Catalyst
The dollar’s weakness isn’t just technical — it’s political and economic. Trump’s continued pressure on the Fed to slash interest rates, combined with tariff talk and geopolitical realignment, is creating a push toward a weaker but more "normalized" dollar.
From the Executive Order remarks on Jan 23, 2025:
“I'd like to see interest rates come down a lot. When oil comes down, prices come down — and then no inflation.”
These aren't just words — they're shaping market expectations and price action.
💬 Is this the soft landing the Fed is hoping for? Or the beginning of something bigger for DXY bears?
Drop your thoughts below and let’s keep the conversation rolling.
🎯 Charts attached for reference.
📢 Follow for more macro breakdowns & chart-focused insights.
One Love,
The FXPROFESSOR 💙

Bitcoin - Is Bitcoin on the way up?!Bitcoin is above the EMA50 and EMA200 on the four-hour timeframe and has broken out of its descending channel. The continuation of Bitcoin’s upward trend will depend on maintaining the drawn upward trend line.
A valid break of this trend line will cause Bitcoin’s price to correct to the 80,000 range. It should be noted that there is a possibility of heavy fluctuations and shadows due to the movement of whales in the market and compliance with capital management in the cryptocurrency market will be more important. If the downward trend continues, we can buy within the demand range.
Following the announcement of new trade tariffs by the United States, Bitcoin experienced a 16.7% drop in price. However, it partially recovered from its 26.7% plunge. The total global cryptocurrency market capitalization has now reached $2.74 trillion, marking a 1.71% increase compared to the previous day.
Over the past 24 hours, the total crypto market trading volume hit $60.7 billion, reflecting a 32.28% rise. Within this, DeFi transactions account for $5.25 billion, making up 8.65% of the total 24-hour market volume. Meanwhile, stablecoins have dominated trading activity with $55.84 billion in volume, representing 92% of the total market volume for the day.
When comparing Bitcoin’s performance to other major assets, gold leads with a 12.9% gain. In contrast, both silver and the U.S. Dollar Index saw a 4.8% decline. The S&P 500 fell by 13.8%, while the Nasdaq dropped 17.5%. Despite its volatility, Bitcoin sits between oil and the Nasdaq in performance, showing signs of partial recovery. However, its behavior still diverges from that of traditional safe-haven assets like gold.
On the political front, Hong Joon-pyo, a presidential candidate from South Korea’s conservative party, pledged that if elected, he would implement reforms in blockchain and cryptocurrency regulations. He also promised to integrate blockchain technology into public sector and administrative services. Additionally, Hong plans to invest at least 50 trillion Korean won (approximately $35.1 billion) over the next five years in research and development across artificial intelligence, quantum technology, and room-temperature superconductors. These initiatives are part of his broader strategy focused on growth driven by emerging technologies.
In Q1 2025, publicly traded companies collectively acquired 95,431 bitcoins, bringing their total holdings to 688,000 BTC. This amount represents 3.28% of Bitcoin’s fixed supply of 21 million coins.
The Coinbase Premium Index, which tracks the difference in Bitcoin demand between U.S. markets and global exchanges, has shown reduced volatility since March 2024. It appears to be forming a pattern often seen before bullish market trends.
Robert Kiyosaki, renowned entrepreneur and author of the best-selling book Rich Dad Poor Dad, has forecasted that Bitcoin’s price could rise to between $180,000 and $200,000 by the end of 2025. Kiyosaki has long been an outspoken supporter of Bitcoin, portraying it as a safe hedge against inflation and economic instability.

2025 – The Year of the Normalized Dollar📉💵 2025 – The Year of the Normalized Dollar! 🔥
The U.S. Dollar Index (DXY) is showing clear signs of weakness after breaching key support levels. With interest rate cuts on the horizon and a shift in economic policy, we may be entering a new phase for the dollar’s normalization.
🔍 Key Levels to Watch
🔹 Resistance: 107.5 (Immediate resistance)
🔹 Key Mid Support: 100.95 (Next major level)
🔹 Final Target: 94.8 (Major support & potential bottom)
📰 Fundamental Factors Driving the Move
💡 Trump’s Dollar Policy: Historically, Trump has favored a weaker dollar to boost exports. His recent remarks during the Executive Order signing on January 23, 2025, reinforce this stance, as he pushes for interest rate cuts and lower energy costs.
Remarks by President Trump at Executive Order Signing (January 23, 2025):
Q: Mr. President, you said earlier that you would like to see interest rates come down.
THE PRESIDENT: Yeah.
Q: How much would you like to see them come down?
THE PRESIDENT: A lot.
Q: And will you talk with Powell?
THE PRESIDENT: I’d like to see them come down a lot, and oil prices will come down. And when oil prices come down, everything is going to be cheaper for the American people — and actually for the world — but for the American people. So, I’d like to see oil prices come down.
Q: Are you worried that there’s too much going on at once if you’re trying to bring interest rates down and get the economy back going?
THE PRESIDENT: No, no. It just works that way. I mean, it just economically works that way. When the oil comes down, it’ll bring down prices, then you won’t have inflation, and then the interest rates will come down.
Q: You said that you would demand that the interest rates come down. Do you expect the Fed to listen to you?
THE PRESIDENT: Yeah.
📉 What’s Next for the Dollar?
🔸 If 100.95 breaks, we could see further downside, testing the 94.8 region.
🔸 A retest of resistance at 107.5 would be a key test before further declines.
🔸 The global macro environment (oil prices, inflation, and geopolitical shifts) will heavily influence the dollar’s trajectory.
🌍 Economic & Geopolitical Impact
Beyond monetary policy, Trump’s trade and labor policies are also playing a role in shaping the inflation outlook. His push for tariffs and tighter immigration policies has led to higher labor costs, causing short-term inflation. However, on the global stage, Trump's potential deal with Putin to resolve the Ukraine conflict could help ease inflation worldwide by stabilizing supply chains and reducing geopolitical risks.
With Trump pushing for rate cuts, the Fed under pressure, and DXY losing momentum, could we see a full-scale dollar correction in 2025? Let’s discuss! ⏬
📢 Follow for more macro insights & market analysis!
One Love,
The FXPROFESSOR 💙
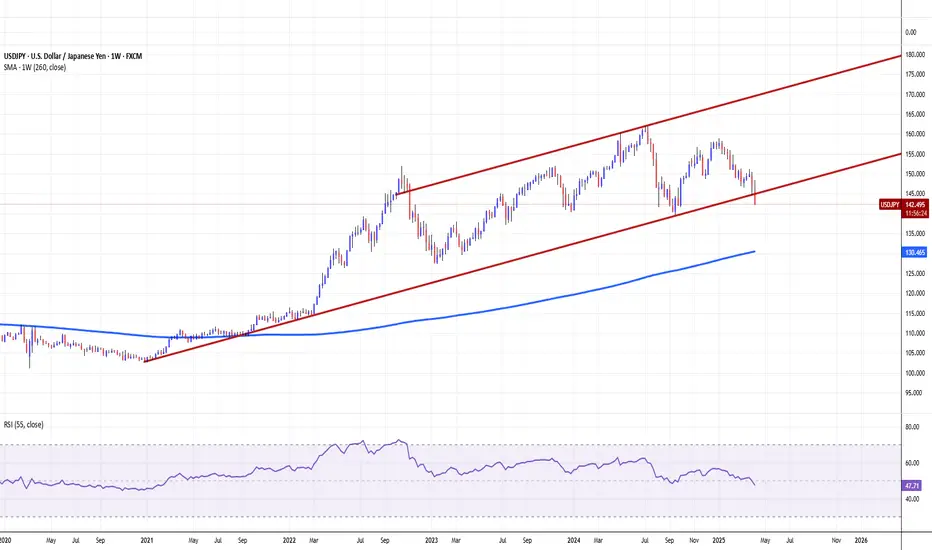
USD/JPY. A simple, multi-year trend breakthroughThe Americans have become so utterly unpredictable, Dollar contunues its crash.
The main USDJPY graph indicates on a multi-year trend breakthrough.