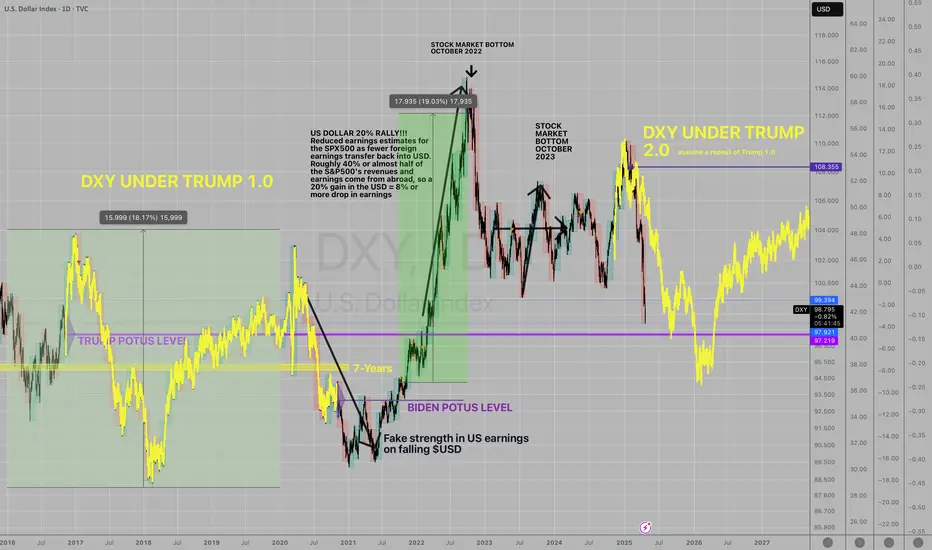
$DXY Repeating 2016 Post-Election I have highlighted the 2016 to 2020 Presidential Elections time period and then pasted that timeframe onto the 2024 election and found that the pattern is going along very similarly to Trump 1.0.
If we assume that the future unfolds the same as last time, which is low probability, of course, then the future will unfold as shown in the yellow bars going into the future, as shown.
Initially in 2016 post election there was a 7% rally in the U.S. Dollar Index and then a 15% retreat for the following year. So far in 2025 we have seen the same rally and a similar decline, but only faster this time.
It would appear as thought the bulk majority of the declines in the TVC:DXY are over at this time with perhaps 4% further downside over the balance of the year.
The Dollar Index has been useful for predicting changes in the earnings estimates for the S&P500 in the USA due to the high percentage of earnings coming back to the US for quarterly reporting. I have posted a few charts in the past which have been helpful at determining the risk in the stock market.
The behavior of the global central banks has certainly had its impact on monetary aggregates and inflation. The policy response since the Covid Pandemic has been for maximum liquidity and maximum Government spending to keep the global economy afloat. The post-Covid response is now coming to a head along with new policy directives to cut wasteful Government spending and to reduce inflation (caused the Gov't spending).
Global investors have flocked to the US for access to high technology stocks and have driven up the value of US assets to extreme levels compared to other markets. This adjustment phase where investors remove money from overvalued, or highly valued, US assets back to other markets has created a wave of selling in the US Dollar and US listed equities.
What does the future hold? We never know but we sure can learn from what happened in the past by looking at charts just like this one to see what may happen. Looks like a bounce in the TVC:DXY from here, followed by a new low and then a rebound into the next few years.
All the best,
Tim
April 22, 2025 1:16PM EST TVC:DXY 98.78 last
DXY
USDJPY 1W forecast until September 2025A huge inverted Head&Shoulders has been started. Volatility chop-chop. Left shoulder is ready and the price is heading up to the base at 145.188
In the middle of June we will see a fast fall to print Head bottoming at 138.75
Before printing Right shoulder the price has to visit the base again in the beginning of August 2025
What will happen in September? I will keep posting and updating (if I see necessity) 1W chart here. For 1D weekly updates check 'Also on' in my Profile.

USDJPY 1W tf forecast until August 2025 Current midterm bias is bullish. 150,64 and 142,78 are extreme levels to be respected by the price action. One more week of red week of sideways movement will actually form a reversal pattern followed by a strong upward spike. A powerful breakout to 148,27 is to be retested at 145,34 - healthy retest. July will show an organic growth topping at 149.66 in the beginning of August 2025

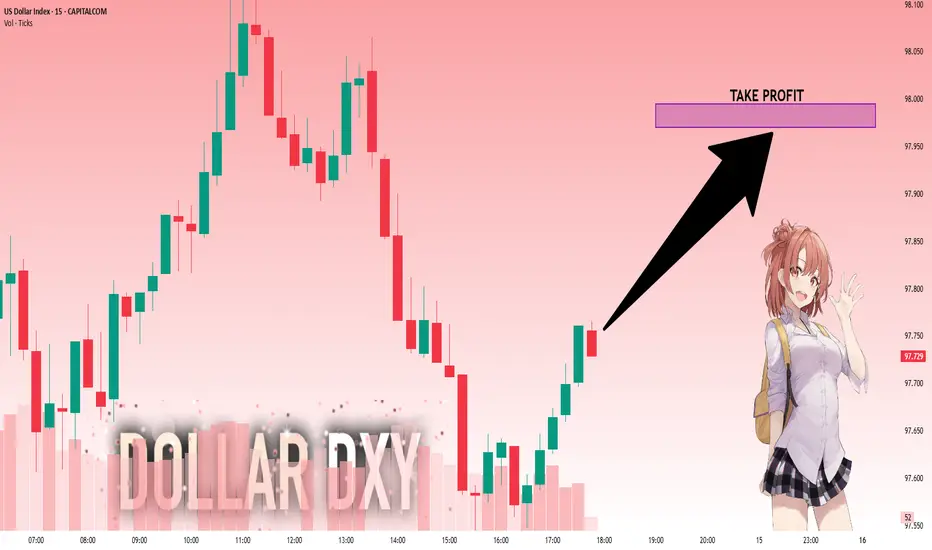
DXY: Local Bullish Bias! Long!
My dear friends,
Today we will analyse DXY together☺️
The market is at an inflection zone and price has now reached an area around 97.757 where previous reversals or breakouts have occurred.And a price reaction that we are seeing on multiple timeframes here could signal the next move up so we can enter on confirmation, and target the next key level of 97.970.Stop-loss is recommended beyond the inflection zone.
❤️Sending you lots of Love and Hugs❤️
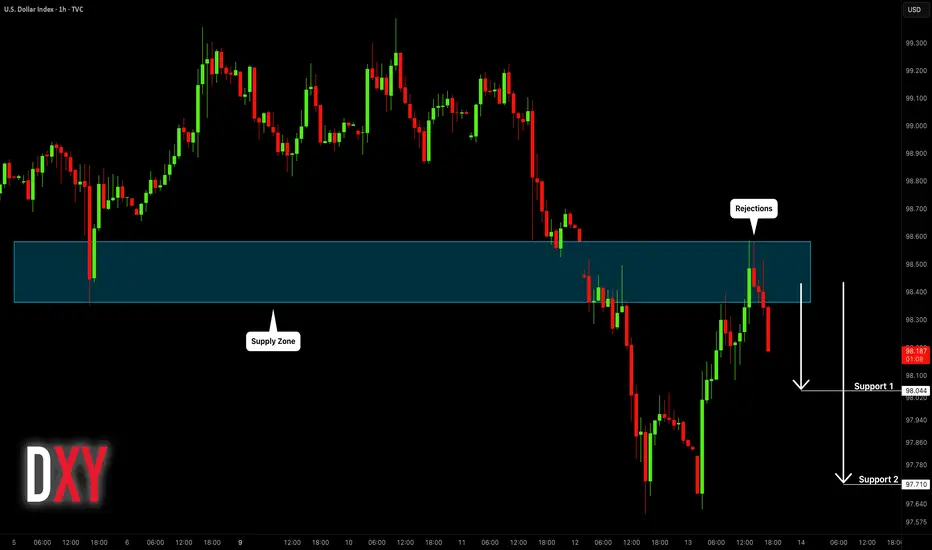
DOLLAR INDEX (DXY): Bearish Again?!
Dollar Index leaves clear bearish clues after a test
of a significant intraday/daily supply area.
I think that the market will continue falling at reach at least 98.04 level.
❤️Please, support my work with like, thank you!❤️
Gold/XAUUSD Possible Move 13 June 2025 The market continues to exhibit strong bullish momentum within a well-respected ascending channel. After an impulsive breakout to the upside, price is now retracing in a healthy corrective move, offering high-probability buying opportunities at two well-defined demand zones.
🔍 Technical Structure:
Price is trending inside an ascending parallel channel, with clear respect for both the median and outer trendlines.
A significant bullish impulse pushed price above previous local highs, suggesting institutional interest and continuation potential.
Currently, price is retracing and approaching two key demand areas that align with bullish continuation setups.
🎯 Key Buy Zones:
✅ Zone 1: 3,408 – 3,412
Minor mitigating demand zone, likely to act as support if the market retraces slightly.
Ideal for aggressive long entries if price shows confirmation (e.g., bullish engulfing, LTF structure shift).
✅ Zone 2: 3,380 – 3,385
Deeper unmitigated demand zone, aligned with a potential liquidity sweep and strong institutional support.
Considered a high-probability entry area for larger impulse moves.
🌍 Fundamental Context:
Recent geopolitical tensions in the Middle East, can lead to sharp intraday moves, with 100+ pip 5-minute candles not being out of the question.
Given this backdrop, demand zones become critical areas for smart money entries as traders seek to align technical levels with macro drivers.
📈 Trade Signal:
Bias: 🔵 Bullish
Buy Zone 1: 3,408 – 3,412
SL: Below 3,395
TP: 3425, 3440, trail till 3,470
R:R: ~1:3
Buy Zone 2: 3,380 – 3,385
SL: Below 3,368
R:R: ~1:4
🧠 Final Note:
Watch for price reaction at both zones. Use LTF confirmation before entry and respect your risk management. With news-driven volatility in play, quick movements are expected, offering excellent trade opportunities for prepared traders.

DXY ready for takeoffDXY seems to have reached the bottom for now, as planned within the marked red timezone. I expect a bullish run until October (blue timezone) with target around 111-113 USD, which corresponds to 2-2.5 stdv from this last manipulation leg lower. All areas marked in chart.

Safe-Haven Demand Boosts Gold as Middle East Tensions EscalateHey Traders,
In today’s trading session, we are monitoring XAUUSD for a buying opportunity around the 3,380 zone. Gold is currently trading in an uptrend and is experiencing a correction phase as it pulls back toward this key support and resistance area.
On the fundamental side, reports indicate that Israel struck Iran overnight — fueling a classic geopolitical risk-off sentiment. This escalation is driving strength in safe-haven assets while putting pressure on riskier markets. Gold typically benefits from this kind of uncertainty, adding further weight to the technical setup we’re seeing today.
Trade safe,
Joe

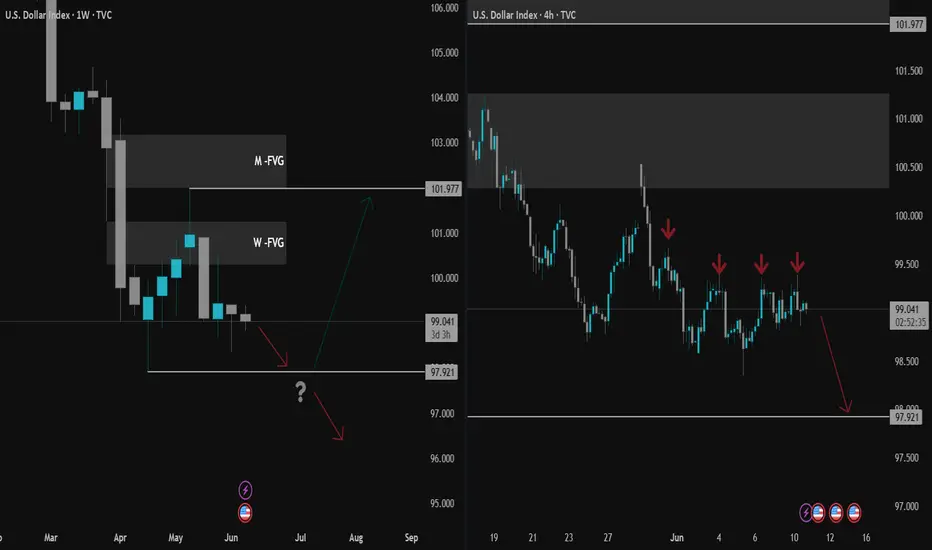
Stuck in the Zone: DXY Tests Balance Between 98 and 99Hello Traders,
After a sharp and uninterrupted decline in the DXY, price found support at the 97.921 level. Sellers then regained control from the weekly bearish Fair Value Gap (W-FVG), pushing price back into the 99 zone.
In this zone, neither sellers nor buyers have managed to assert dominance—suggesting that these levels may act as a pause or balance point. Given the extended drop, a temporary correction could follow if buyers gain traction after one last push.
For now, the bearish USD narrative remains intact. With upcoming catalysts like China/US talks and tomorrow’s CPI release, a renewed move toward 98 is likely to accelerate.
Whether this leads to further selling or a corrective phase will be assessed afterward.
New Highs for Gold = New bull RunHere it is!! the breakout I been talking about in my other updates. doing it on a Friday cause Israel is starting ish! Sitting this out cause it can get volatile.

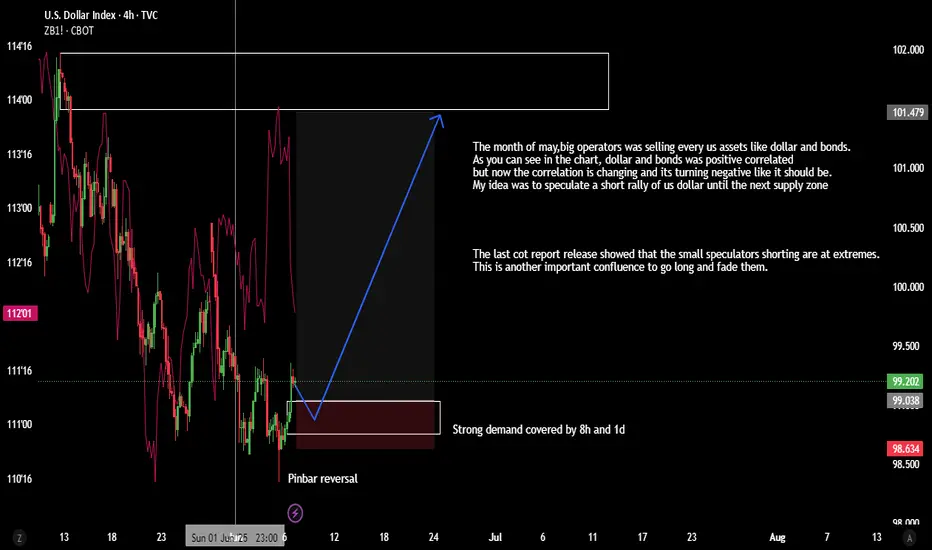
Buy Idea on Us Dollar Index (Dxy)Based on :
- Demand zone
- Pin bar Reversal
- Changing of correlation between dxy and zb1!
- cot report
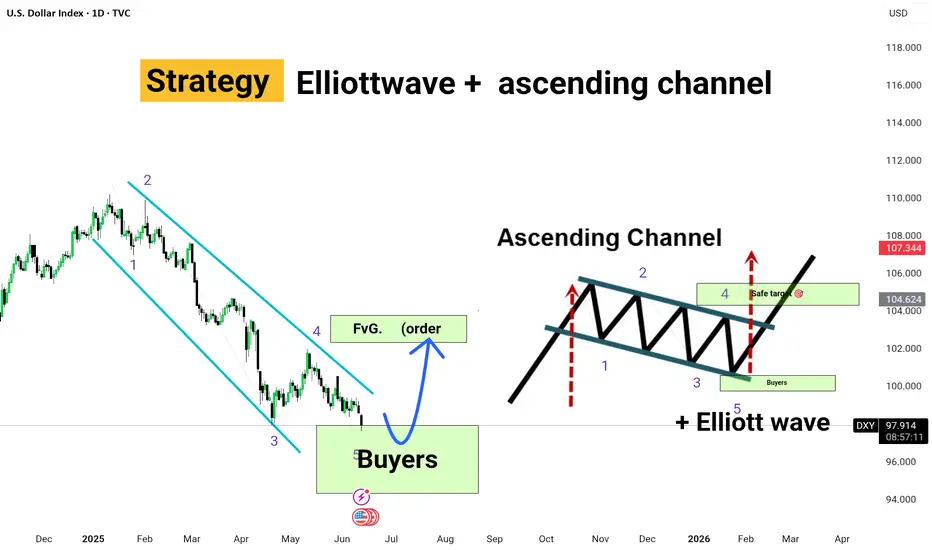
Dollar Falling Ends Soon? Look What Pattern Is Forming!”Asset: U.S. Dollar Index (DXY)
Timeframe: 1D (Daily Chart)
Methodology: Elliott Wave + FVG (Fair Value Gap) + Price Action
DXY has completed an impulsive 5-wave bearish structure, now entering a high-probability reversal zone marked by strong buyer interest around the Wave 5 bottom.
📌 Key Insights:
Wave 5 approaching demand zone (Buyers' area)
Price inside Fair Value Gap (FVG) – potential order block
Bullish reversal expected from here
Forecast: A breakout into an ascending channel, confirming reversal
💡 If Wave 5 holds, we may see a sharp upside rally aligning with smart money accumulation + Elliott Wave psychology.
🔔 Watch for bullish confirmations near 97.50–98.00 for a potential long setup targeting the 104–107 zone.
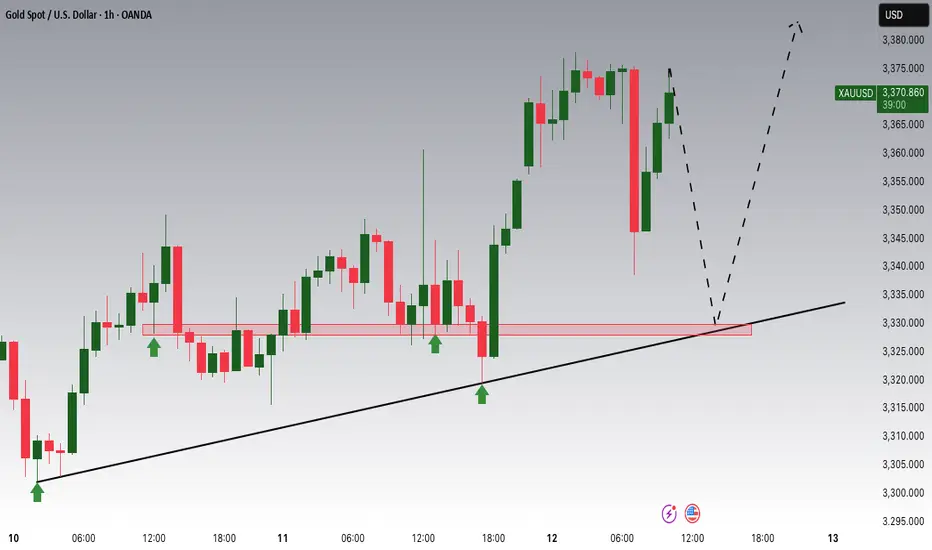
Gold (XAUUSD) Eyes 3,330 Zone as Safe-Haven Demand Builds!!Hey Traders, In today’s trading session, we’re keeping a close watch on XAUUSD for a potential buying opportunity around the 3,330 zone. Gold continues to trade within a strong uptrend, and is currently undergoing a healthy correction, bringing it near a key support/resistance level that could act as a springboard for the next leg higher.
From a fundamental perspective, rising geopolitical tensions in the Middle East have led to the evacuation of diplomatic personnel and increasing concerns of potential military escalation. As uncertainty grows, safe-haven assets like gold tend to attract stronger demand from investors seeking protection against volatility and risk.
If the situation deteriorates further, we could see a surge in gold prices as market participants hedge against geopolitical instability.
Trade safe,
Joe
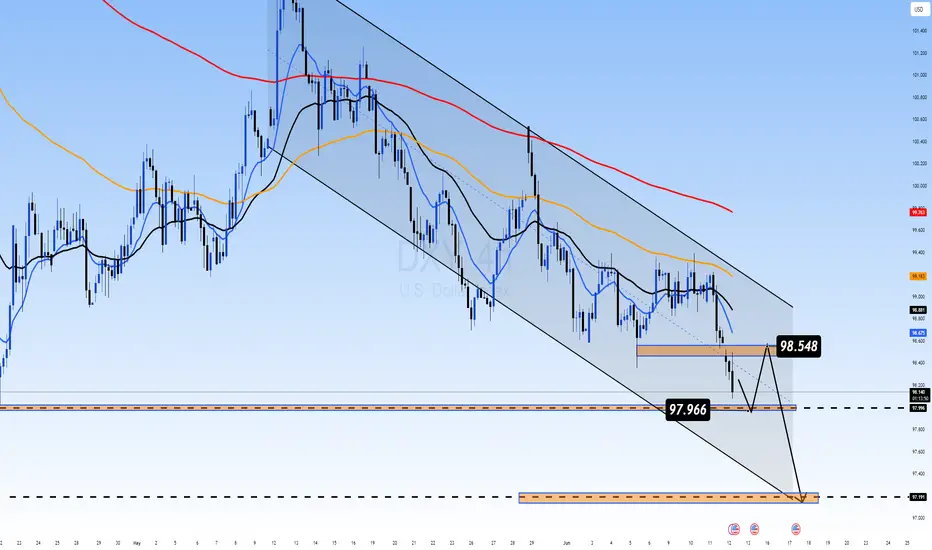
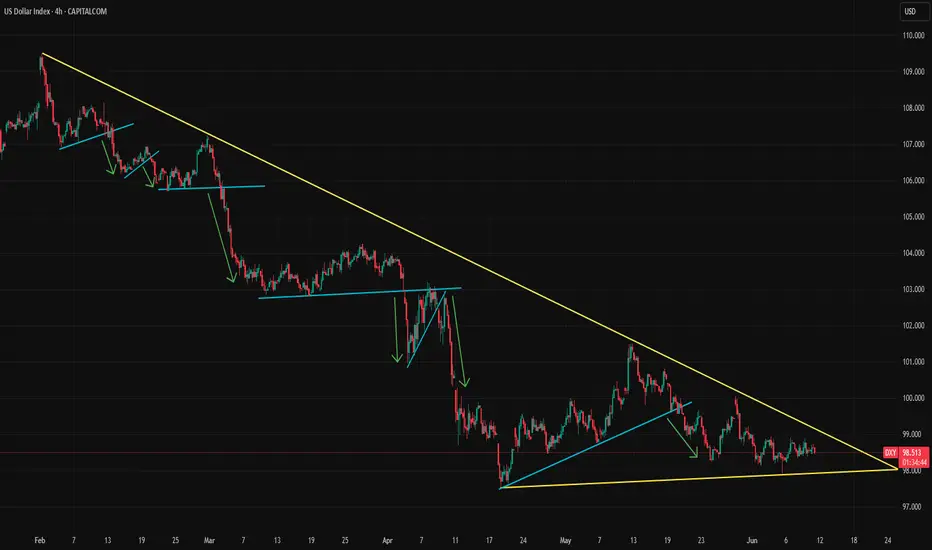
DXY H4 – Dollar Weakens Ahead of PPI Release DXY H4 – Dollar Weakens Ahead of PPI Release | Is the Market Pricing in a Fed Pivot?
🌐 Macro & Fundamental Context
As we head into the New York session on June 12, the market’s attention shifts to one critical data point: the US PPI (Producer Price Index). Following the softer-than-expected CPI reading of 2.4% YoY (vs. 2.5% forecast), the Dollar Index (DXY) dropped sharply—signaling fading inflation pressure and reigniting rate cut expectations.
✅ Bearish Fundamentals Building for the USD:
CPI miss fuels Fed rate cut bets (currently ~65% chance for September per FedWatch Tool).
US Treasury yields are easing, reflecting the market’s pricing of a less aggressive Fed.
Risk assets rallying as capital flows rotate away from USD into gold, equities, and long-duration bonds.
If today’s PPI also comes in below forecast, it could confirm a deeper correction in DXY. Conversely, a surprise PPI upside might trigger a short-term pullback.
📉 Technical Analysis – H4 Timeframe
🔹 Overall Trend:
DXY is locked within a clearly defined descending channel, with a consistent Lower High – Lower Low structure holding since late May.
🔹 Key Technical Zones:
Short-term resistance: 98.548 – likely to act as a ceiling unless PPI surprises to the upside.
Immediate support: 97.966 – a break below opens the door toward the key support zone at 97.191, which aligns with previous FVG imbalance and multi-timeframe demand.
🔹 EMA Structure:
Price remains below all major EMAs (13 – 34 – 89 – 200), confirming persistent bearish pressure.
EMA13 is currently acting as dynamic resistance on H4, pressing down on price.
🧠 Market Sentiment & Flow Insight
Investors are rotating out of USD as inflation fears fade and Fed easing expectations increase.
Risk-on sentiment is returning, benefiting gold and stocks while weighing on DXY.
However, a hot PPI print could spook the market briefly, leading to a corrective bounce in the Dollar before the trend resumes.
🔍 Scenarios to Watch:
PPI comes in lower than expected:
DXY may retest 98.548 resistance and reject lower.
Next targets: 97.966 → 97.191
PPI surprises to the upside:
Technical bounce toward 98.5–98.8 possible.
But trend remains bearish unless price reclaims 99.2+ zone.
✅ Conclusion
DXY remains under pressure from both macro and technical angles. The PPI report will be the next catalyst that determines whether this is a short-term dip or the continuation of a broader USD downtrend.
🎯 Tactical view: Favour short positions on DXY if price bounces into resistance and PPI supports the disinflation narrative. Target: 97.1 and below.
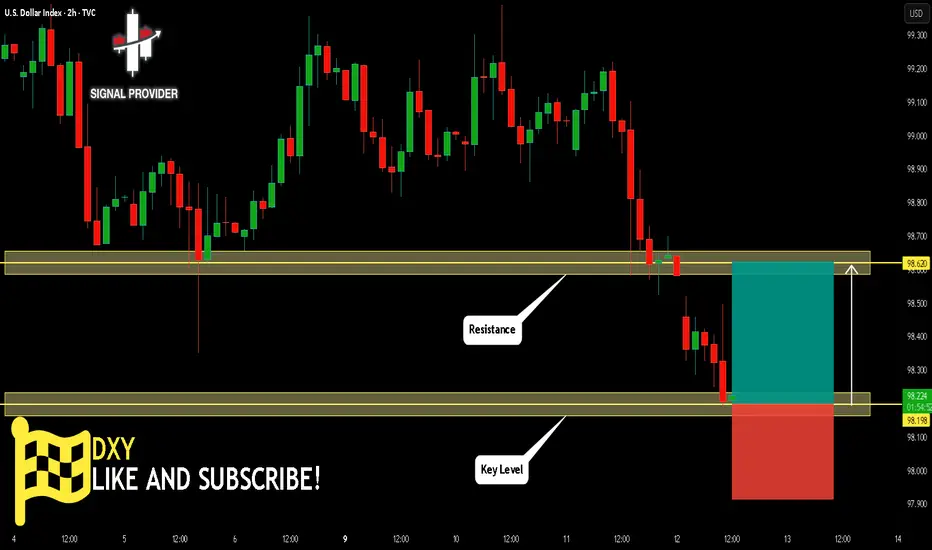
DXY Will Grow! Long!
Here is our detailed technical review for DXY.
Time Frame: 2h
Current Trend: Bullish
Sentiment: Oversold (based on 7-period RSI)
Forecast: Bullish
The market is trading around a solid horizontal structure 98.198.
The above observations make me that the market will inevitably achieve 98.620 level.
P.S
Please, note that an oversold/overbought condition can last for a long time, and therefore being oversold/overbought doesn't mean a price rally will come soon, or at all.
Disclosure: I am part of Trade Nation's Influencer program and receive a monthly fee for using their TradingView charts in my analysis.
Like and subscribe and comment my ideas if you enjoy them!
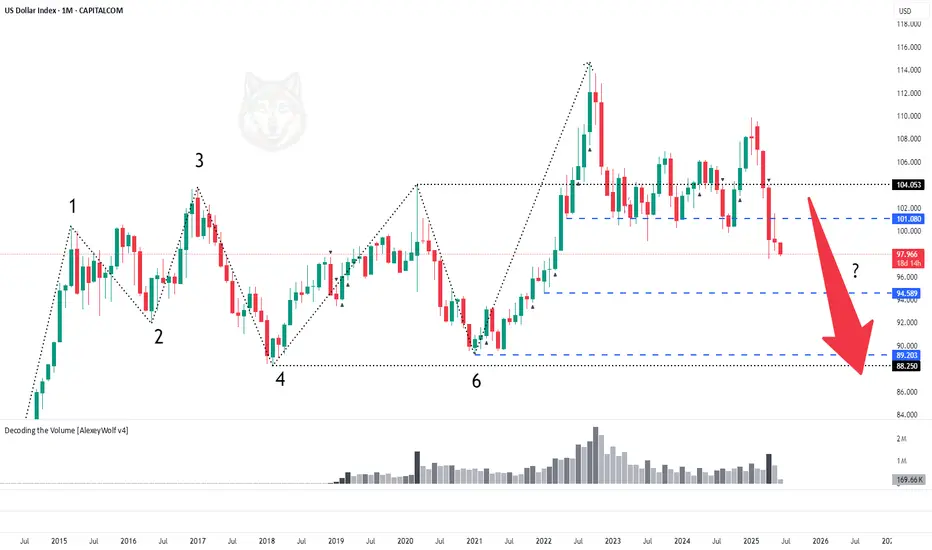
DXY. Midterm Analysis of the US Dollar IndexHey traders and investors!
📍 Context
On the monthly timeframe, the market was in a range. The price broke above the upper boundary and was long supported around the 101.080 level. This level was repeatedly tested by sellers and now appears to have been broken.
📊 Monthly targets: 89.20 and 88.300.
🔎 Analysis
Why might the downward movement continue?
Daily TF
On the daily chart, we can see that on the day buyers returned to the 101.080 level, the main volume was accumulated in a buyer candle right at and slightly above the level. This suggests the level was defended by sellers. This indicates they are currently in control, and the decline may continue. Let’s look at the nearest potential buyer activity levels.
11-day TF
The price has once again broken downward out of the range. Below, there is a small consolidation area formed during the previous upward movement. Its boundaries are: upper boundary — 97.385, lower boundary — 94.589.
🎯 Trade Idea: Rebounds from the upper boundary at 97.385 are possible, but overall the priority remains with a move into this range and towards the 95.00–94.589 zone.
This analysis is based on the Initiative Analysis concept (IA).
Wishing you profitable trades!
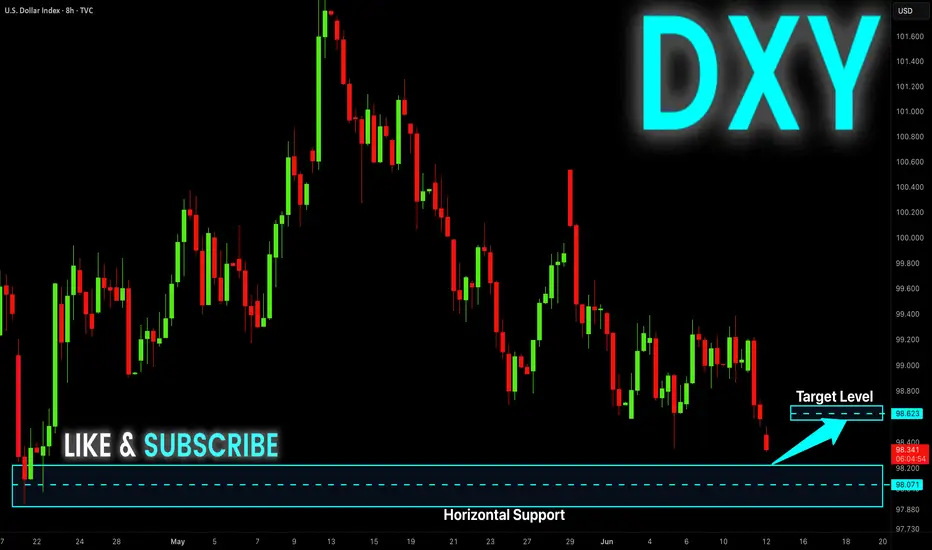
DXY Support Ahead! Buy!
Hello,Traders!
DXY keeps going down
But the strong horizontal
Support is ahead around 98.000
So after the price hit the level
We will be expecting a
Local rebound and a move up
Buy!
Comment and subscribe to help us grow!
Check out other forecasts below too!
Disclosure: I am part of Trade Nation's Influencer program and receive a monthly fee for using their TradingView charts in my analysis.
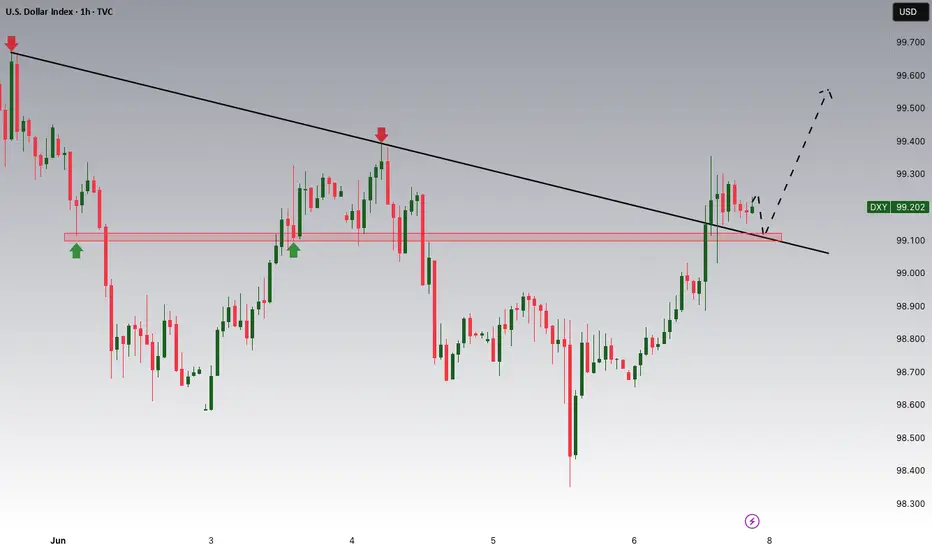
DXY Ready to Reload? Eyes on 99.100 as Tariff Tensions Ease!!Hey Traders, In tomorrow's trading session, we're closely monitoring the DXY for a potential buying opportunity around the 99.100 zone. After trending lower for a while, the dollar index has successfully broken out of its downtrend and is now entering a corrective phase.
We’re watching the 99.100 support/resistance area closely, as it aligns with a key retracement level making it a strong candidate for a bullish reaction.
On the fundamental side, Friday's NFP data came in slightly above expectations, which is typically USD-positive. In addition, recent Trump-led de-escalation in U.S.-China tariff tensions is another supportive factor for the dollar.
Trade safe, Joe.
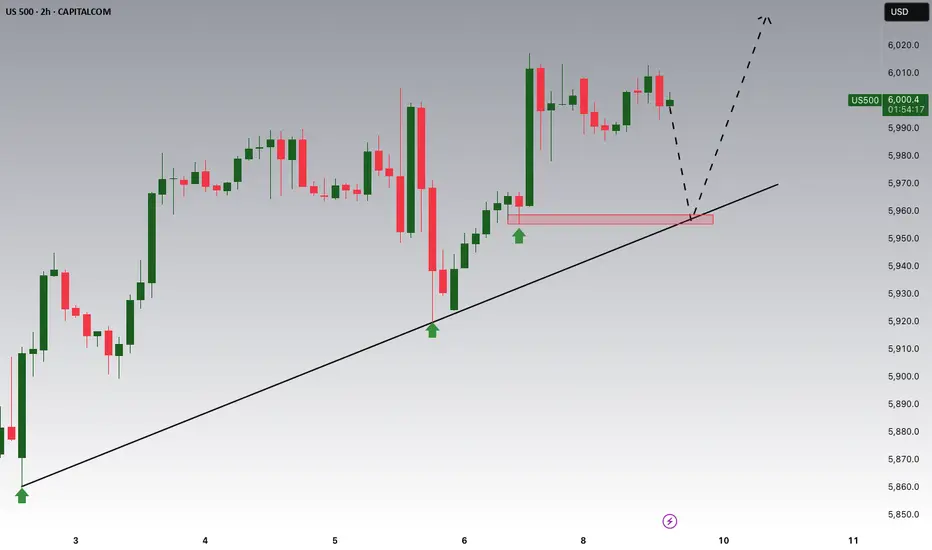
S&P500 is Nearing an Important Support of 5,960!!!Hey Traders, in today's trading session we are monitoring US500 for a buying opportunity around 5,960 zone, US500 is trading in an uptrend and currently is in a correction phase in which it is approaching the trend at 5,960 support and resistance area.
Trade safe, Joe.
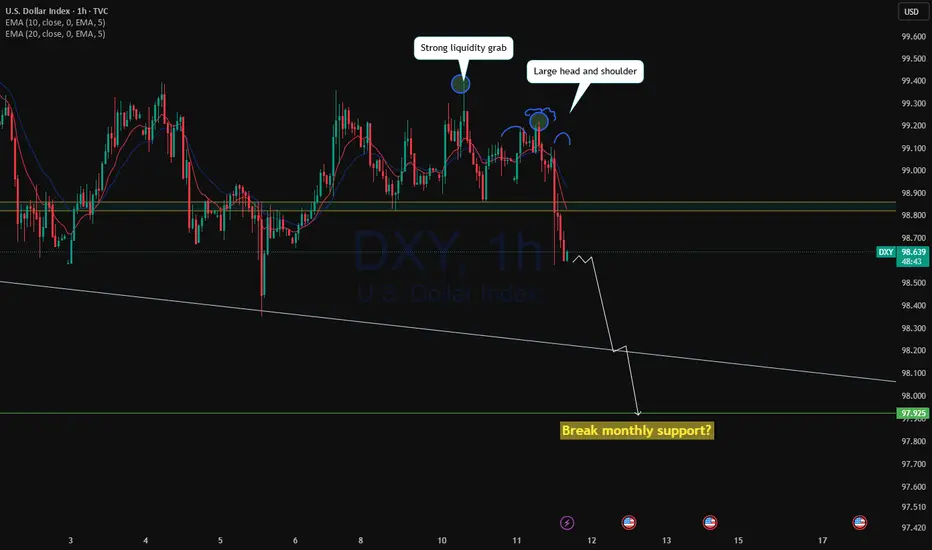
DXY ready for free fall?DXY at 99.39 strong liquidity grab then rejected back to the support level then following a head and shoulder, price completely has broker out of the support with CPI, it has finally managed break out of consolidation.
As the impulse has volume, we may see further drop to the monthly support 97.93 and may potentially break below as there is FVG which may slide the price further down.
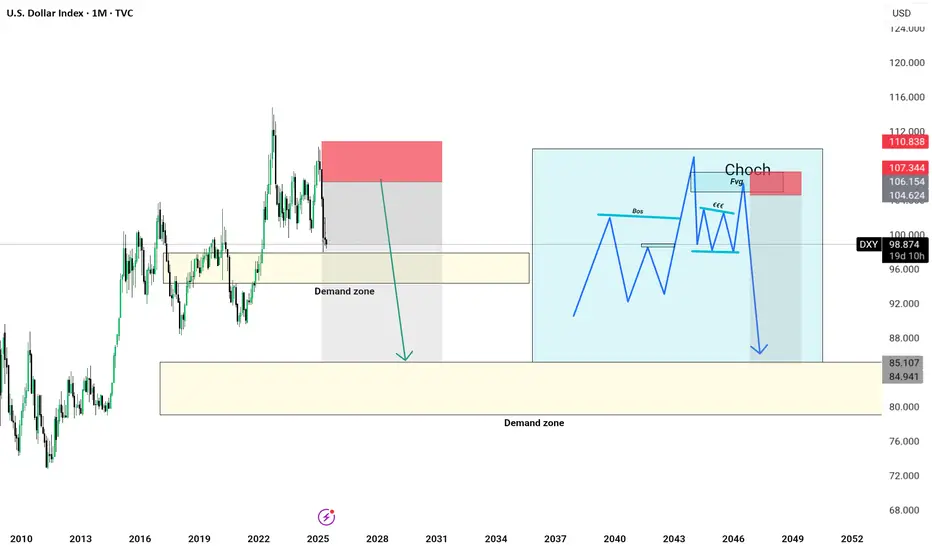
DXY Monthly Analysis | Smart Money Concept + CHoCH BreakdownPair: US Dollar Index (DXY)
Timeframe: 1M (Monthly)
Strategy: Smart Money Concept (SMC) + Market Structure + Demand/Supply Zones
Bias: Bearish (Mid to Long-Term)
Breakdown:
Price reacted strongly from the monthly supply zone (110–104), showing signs of exhaustion.
Clear CHoCH (Change of Character) visible at the top structure, confirming loss of bullish intent.
Internal structure printed a liquidity sweep + FVG (Fair Value Gap) ➝ BOS ➝ lower low.
Current PA (price action) is targeting the first demand zone near 92–94, but major interest lies at the macro demand zone (85.100–84.900).
This level aligns with unmitigated historical demand and potential long-term accumulation range.
---
📅 Projection:
Expecting a continuation to the downside after retesting minor imbalance zones.
Potential multi-year bearish leg forming Wave 3 (macro view).
Ideal accumulation/buy zone: 85.100–84.900 – if structure supports.
---
📌 Key Levels to Watch:
Supply Zone: 110.800 – 104.600
CHoCH Level: ~102.300
Short-Term Demand: 92.000 – 94.000
Long-Term Demand (Institutional Interest): 85.100 – 84.900
---
💡 Conclusion: Smart Money has exited from premium pricing, and the macro structure aligns with a bearish transition. As long as price respects current lower highs, we may see a deeper correction or possible trend reversal near 85 levels.
---
🧠 #DXY #SmartMoney #CHoCH #ForexAnalysis #SupplyAndDemand #PriceAction #Forex #Month
What to Expect from CPI Data and the Key Dollar Levels to WatchDollar index trading in a tight range ahead of the CPI data.
US inflation is expected to rise by 0.1% on a yearly basis for both headline and core figures, reaching 2.4% and 2.9% respectively. Markets expect some of the effects of tariffs to begin showing up in this data.
There are both downside and upside risks to the release, but in our view, a slightly lower-than-expected result is more probable. Frontloading of goods before tariffs took place, slowing economic activity, downward price pressure in parts of the services sector due to weaker-than-usual tourism, lower energy costs, and ongoing disinflation suggest that the impact of tariffs may remain limited in this month’s data and possibly the next as well.
If the data remains unchanged and comes in below expectations, the initial reaction could be negative for the dollar due to rising rate cut expectations. However, unless there is a significant surprise in either direction, today’s data is unlikely to meaningfully change the Fed’s economic outlook or rate policy. The inflationary effects of tariffs are expected to appear gradually, due to the frontloading of goods ahead of the tariff implementation.
For the Dollar Index, the 97.90 and 99.10 levels will be key. If the downtrend breaks, the ongoing gradual decline of the dollar may pause, allowing for a limited rebound. However, a drop below 97.90 could trigger another leg down, similar to previous moves.
A side note on inflation:
Sometimes, year-on-year figures alone are not enough to provide a clear picture due to base effects. Starting this month, the base effect turns positive for yearly comparisons.
If inflation is to return to the 2% target steadily, month-on-month inflation needs to remain at or below 0.2%. For example, twelve consecutive months of 0.2% monthly inflation results in a 2.22% annual CPI. In contrast, twelve straight months of 0.3% monthly inflation would lead to a 3.35% annual rate.
Dollar Index Eyes FVG Breakout Ahead of CPIDXY 11/06 – Dollar Index Eyes FVG Breakout Ahead of CPI | Reversal Risk After 100.31?
The US Dollar Index (DXY) continues to consolidate within a rising channel on the H2 timeframe, with price tightening just ahead of a key macro event — the US CPI report. DXY is now approaching a critical Fair Value Gap (FVG) zone, where liquidity hunts and potential reversals become highly probable.
🌐 MACRO OUTLOOK & MARKET SENTIMENT
📌 US CPI (June 12):
The main macro driver for DXY this week.
A hotter-than-expected print → strengthens the Fed’s hawkish stance → DXY likely to spike.
A weaker-than-expected CPI → boosts rate cut expectations → downside pressure on DXY.
📌 Risk Sentiment:
Institutions are readjusting their exposure ahead of CPI and FOMC. This has caused DXY to hover near EMA89 — a sign of indecision.
📌 Cross-asset Flows (Bonds & Gold):
Treasury yields are stable, but surprises in CPI could lead to capital rotation between gold and USD, increasing volatility in XAUUSD and DXY simultaneously.
📈 TECHNICAL ANALYSIS
Trend Structure:
DXY is following a clean ascending channel on H2, with higher lows respecting the lower trendline.
EMA Confluence (13–34–89–200)
Price is consolidating near EMA89 and below EMA200 (99.40), forming a neutral short-term bias.
A clean breakout above EMA200 could trigger acceleration into the FVG zone.
Key FVG Zone (H2):
99.63 – 100.31 is an unfilled Fair Value Gap.
This zone may act as a magnet for price before any meaningful rejection or breakout.
Potential Reversal Area:
A rejection at 100.31 could trigger a sharp pullback toward the liquidity zone around 98.68.
🧠 STRATEGIC OUTLOOK
CPI will set the tone for DXY’s mid-term trend.
Watch the 99.63 – 100.31 FVG zone for liquidity sweeps and potential rejection.
Wait for confirmation, not prediction — especially in macro-sensitive environments.
