Dollar IndexWe are seeing Dollar strength this week, Seasonality and structure are playing in the favour of bulls this week.
DXY
DXY Is Going Up! Long!
Please, check our technical outlook for DXY.
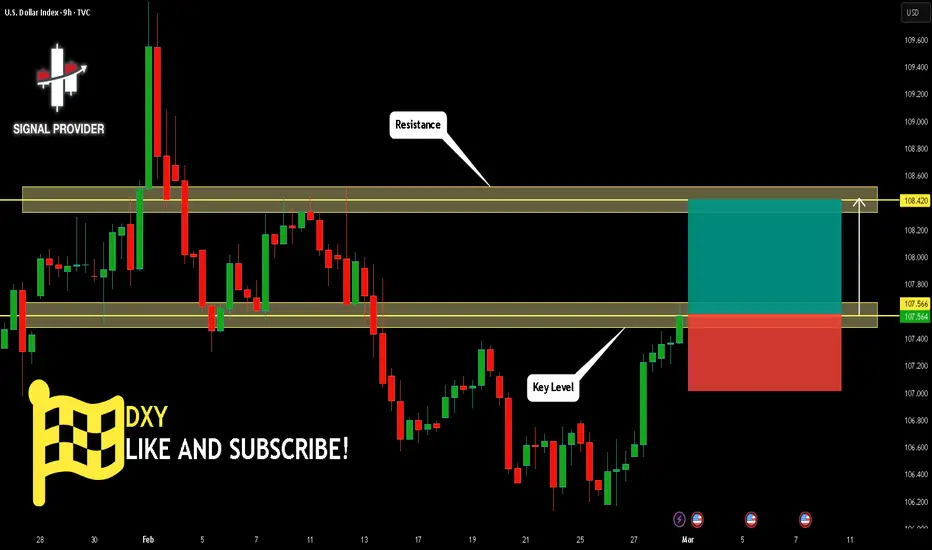
Time Frame: 9h
Current Trend: Bullish
Sentiment: Oversold (based on 7-period RSI)
Forecast: Bullish
The price is testing a key support 107.566.
Current market trend & oversold RSI makes me think that buyers will push the price. I will anticipate a bullish movement at least to 108.420 level.
P.S
Please, note that an oversold/overbought condition can last for a long time, and therefore being oversold/overbought doesn't mean a price rally will come soon, or at all.
Like and subscribe and comment my ideas if you enjoy them!
GBPUSDHello Traders! 👋
What are your thoughts on GBPUSD?
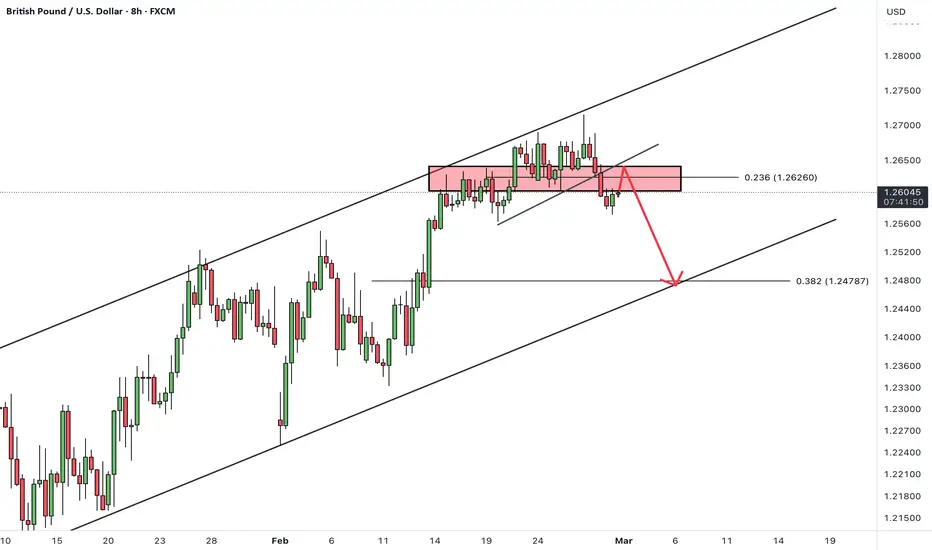
This currency pair has been moving within an ascending channel, but after reaching the channel’s upper boundary, we saw a bearish reaction and price reversal.
Currently, the price has also broken below the support zone.
We expect that after a pullback to the broken level, the price will drop further, at least to the next identified support level.
What’s your outlook on this pair’s next move? Do you expect further downside?
Don’t forget to like and share your thoughts in the comments! ❤️
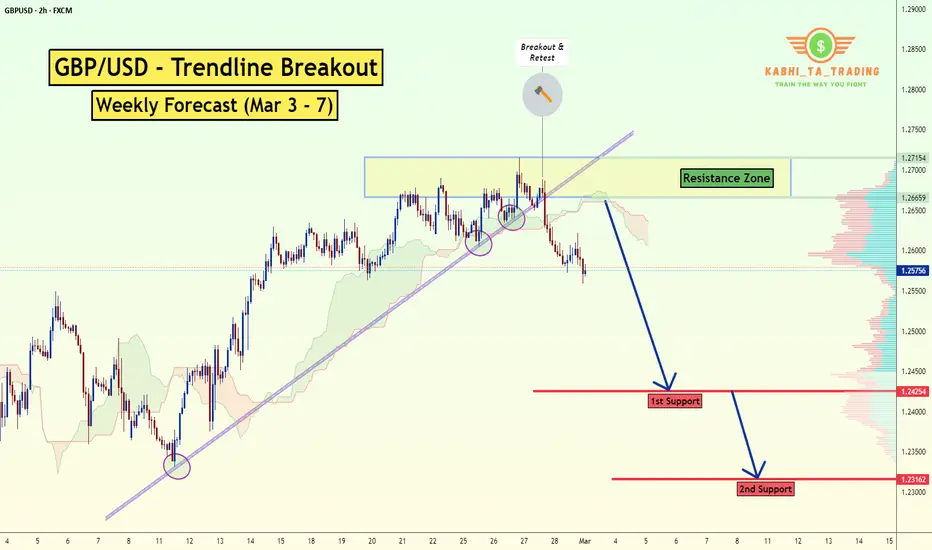
GBP/USD Trendline Breakout (Weekly Forecast Mar 3 - 7)The GBP/USD Pair on the H2 timeframe presents a Potential Selling Opportunity due to a recent Formation of a Trendline Breakout Pattern. This suggests a shift in momentum towards the downside in the coming hours.
Possible Short Trade:
Entry: Consider Entering A Short Position around Trendline Of The Pattern.
Target Levels:
1st Support – 1.2425
2nd Support – 1.2316
🎁 Please hit the like button and
🎁 Leave a comment to support for My Post !
Your likes and comments are incredibly motivating and will encourage me to share more analysis with you.
Best Regards, KABHI_TA_TRADING
Thank you.
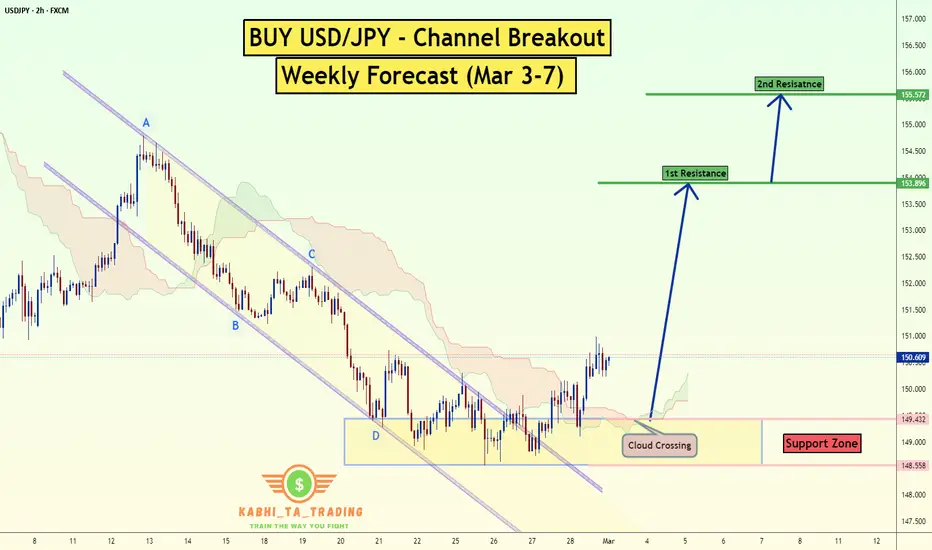
USD/JPY Channel Breakout (Weekly Forecast Mar 3-7)The USD/JPY pair on the H2 timeframe presents a Potential Buying Opportunity due to a recent Formation of a Channel Breakout Pattern. This suggests a shift in momentum towards the upside and a higher likelihood of further advances in the coming hours.
Possible Long Trade:
Entry: Consider Entering A Long Position around Trendline Of The Pattern.
Target Levels:
1st Resistance – 153.90
2nd Resistance – 155.60
🎁 Please hit the like button and
🎁 Leave a comment to support for My Post !
Your likes and comments are incredibly motivating and will encourage me to share more analysis with you.
Best Regards, KABHI_TA_TRADING
Thank you.
USD/CHF Wedge Breakout (Weekly Forecast Mar 3-7)The USD/CHF pair on the H2 timeframe presents a Potential Buying Opportunity due to a recent Formation of a Wedge Breakout Pattern. This suggests a shift in momentum towards the upside and a higher likelihood of further advances in the coming hours.
Possible Long Trade:
Entry: Consider Entering A Long Position around Trendline Of The Pattern.
Target Levels:
1st Resistance – 0.9138
2nd Resistance – 0.9221
🎁 Please hit the like button and
🎁 Leave a comment to support for My Post !
Your likes and comments are incredibly motivating and will encourage me to share more analysis with you.
Best Regards, KABHI_TA_TRADING
Thank you.

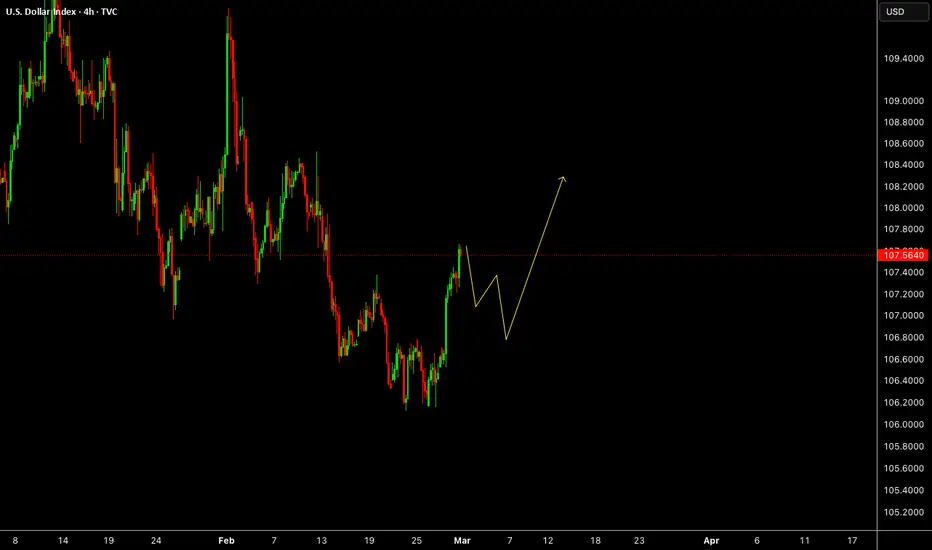
DXY to Retest $108 - Slight Pain May Lay AheadDXY fractal from 2017 is playing out nicely.
Looks like it will retest $108 mid-March and break $106 in early April (hopefully before).
This lines up perfectly with the Global M2 (12-Week Lead) liquidity injection.
BTC inverse head shoulder Looks like after we found the bottom, forming an inverse head shoulder pattern which is potentially a bullish/ reversal pattern. Follow for more tips.

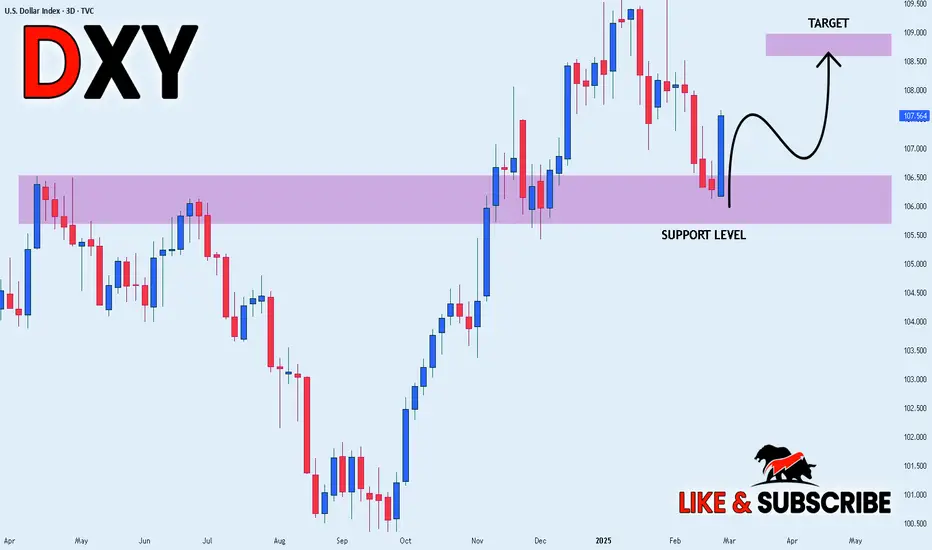
DXY BULLISH BIAS|LONG|
✅DXY is going down now
But a strong support level is ahead at 106.000
Thus I am expecting a rebound
And a move up towards the target at 108.600
LONG🚀
✅Like and subscribe to never miss a new idea!✅

"Bearish Pressure on DXY: Key Levels to Watch"🔹 Technical Analysis of U.S. Dollar Index (DXY) - 4H Chart
▪️Market Structure & Trend Analysis:
- The chart shows a clear downtrend in the U.S. Dollar Index (DXY), with a series of lower highs and lower lows.
- The price is trading below the 200-period moving average (blue line) and 50-period moving average (red line), reinforcing bearish sentiment.
🔹Key Levels:
1. Strong Resistance Area ( 107.300 - 107.400)
- This is a significant supply zone where sellers have aggressively pushed the price down in the past.
- The price recently tested this area and failed to break higher, indicating strong resistance.
2. Resistance Level for Further Downside ( 106.700 - 106.800)
- The price is struggling to stay above this level, which has now become a short-term resistance zone.
- If price stays below this level, further downside is likely.
3. Target Area ( 105.453)
- This is the next major support level, where price could find buying interest and potentially reverse or consolidate.
▪️Market Expectation:
- Bearish Continuation:
- If price remains below the 106.700 resistance level, it is likely to continue downward towards the 105.453 target zone.
- Invalidation of Bearish Bias:
- If price breaks and closes above 107.400, it could signal a trend reversal or deeper retracement.
🔹Conclusion:
- Bias: Bearish
- Trading Plan: Look for sell opportunities below resistance zones and target 105.453 for a potential move lower.
😊Don't Forget To Hit The Like Button & Share Your Thoughts In Comments.

Forex Outlook on different currency pairsNot a great scenario it seems like. But we move. need additional print on the weekly. After NFP week things might get completely obvious.

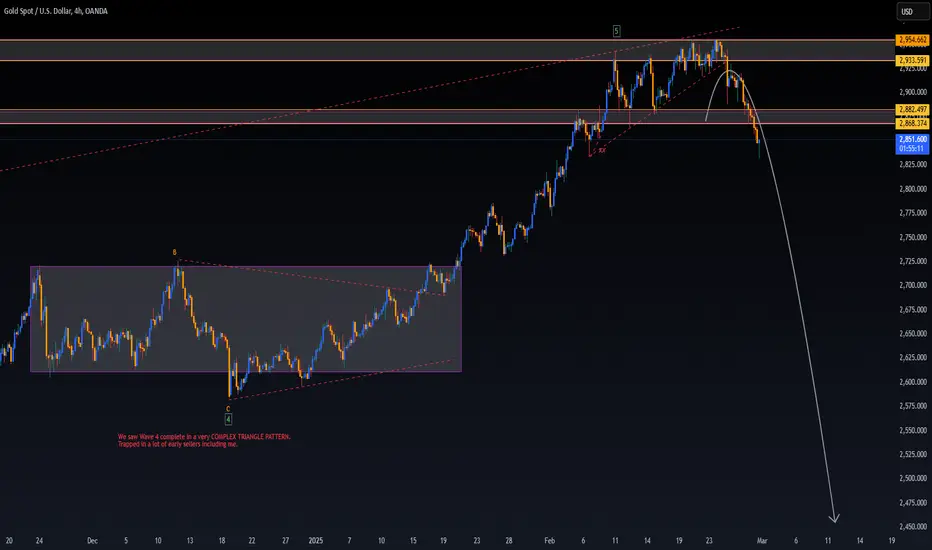
Gold Wave 5 Bull Complete?! (4H UPDATE)While our short term 1H buy's didn't work out, our mid term sells on the 4H TF is proceeding nicely. Price is down 1,230 PIPS (4.18%) from its Wave 5 high at $2,956. We have MUCH MORE DOWNSIDE towards our $2,450 target, so if you haven't got in already, you have plenty more chances.
If any short term buy positions present themselves, I will try to share them here.
Daily Market Outlook: BTC, DXY & Gold Analysis (#8)The market has been highly reactive following yesterday’s GDP and Unemployment Claims report. The DXY strengthened sharply, reaching a key resistance at 107.474. Previously, this level acted as a strong support and has now turned into a major resistance zone.
DXY Analysis
We need to consider multiple scenarios for the dollar index:
Most Likely Scenario: If DXY gets rejected from 107.474, we can look for short positions below 107.063, anticipating a continuation of the secondary downtrend in the daily timeframe.
Alternative Scenario: If DXY breaks above 107.474, it could continue strengthening toward 107.767, confirming that the correction is over and resuming the major uptrend.
Gold (XAU/USD) Analysis
Gold dropped below 2878.87, entering a price correction phase. Key support levels to watch:
2841.25 (Fib 50%)
2811
2790 (Strong demand zone)
Short Position Plan (1H Timeframe)
If gold finds support at 2855 (35% Fib), and later breaks it, a short entry could be considered.
If the drop continues, the next major short opportunity is at 2841.89 in the 4H timeframe.
Long Position Plan
A confirmed breakout above 2879.26 will indicate strength, making it a valid long entry point.
Bitcoin (BTC/USD) Analysis
BTC has been experiencing significant downside pressure, aligning with the February 26 analysis where I highlighted the potential for a price correction within its major uptrend.
As mentioned earlier, losing 80-82K support would shift the market bias to bearish, favoring short positions. If you shorted BTC from 85K, this could be a great area to secure profits.
Currently, BTC lacks a clear structure, so I’m waiting for more confirmation before taking new positions.
What’s Next for BTC?
If BTC closes below 80K, we will need to reassess the market structure and update our strategy accordingly.
If BTC holds above this level, there is still a chance for a recovery and potential upside continuation.
However, if 80K is lost, the recovery process could take much longer than expected.
Final Thoughts
Stay patient and wait for clear market structures before entering trades. If you’re already in positions, manage them carefully based on these levels.
I’m Skeptic , and I’m grateful to be on this journey with you all. Trading is tough, but growing together makes it worthwhile. Stay profitable and see you tomorrow! 🚀💡

28.02.25 Morning ForecastPairs on Watch -
FX:AUDNZD
FX:GBPUSD
FX:EURUSD
A short overview of the instruments I am looking at for today, multi-timeframe analysis down to what I will be looking at for an entry. Enjoy!

General Market Analysis - SMC Point of ViewIn this video I go through an analysis of DXY, EURUSD, USDCHF, OIL, and BTC. I also delve into why I think some short-term manipulation is happening and share my narrative.
I am not fond of giving a long description here when I give my analysis in the video, so please enjoy and share your thoughts.
- R2F Trading

Eur/Usd selling Idea for rest of the weekimo feb/24 is the monthly top...with monday candle i think we will see more downside for euro rest of the week.
( This is an idea and entry-tp-sl placed for my own trade , you can change entry-tp-sl depends on your risk management )

DXY Correction Plays Out – Is a Reversal Next? Since the end of January, I have been anticipating a correction in the TVC:DXY , with a target around the 106 support level.
This correction has unfolded as expected, with the Dollar Index touching 106 on Monday, followed by another test and reversal yesterday.
A key observation is that since the early February spike, the DXY has been trading within a falling wedge—a pattern that often signals a potential reversal.
What’s Next?
✅ Bullish confirmation would come with a daily close above the 106.60–106.70 zone. If this happens, we could see a move up to 108.50, a key resistance level.
✅ Interim resistance sits at 107.30, which could also act as a potential target for bulls.
Trading Implications:
If the Dollar Index confirms an upside breakout, it could present selling opportunities in FX:EURUSD , FX:GBPUSD , FX:AUDUSD , and TRADENATION:NZDUSD .

SELL USDCADIn todays session we are looking for selling opportunities in USDCAD. Our entry is at 1.43399 and stops above 1.4400. Our targets are at 1.4050. Use proper risk management.

USDX, DXYUSDX price is approaching the support zone of 106.45-105.36. If the price fails to break through the main support zone of 105.36, it is expected that there is a chance that the price will rebound. On the contrary, if the price can break through the level of 105.36, it will have a negative impact on the dollar.
🔥Trading futures, forex, CFDs and stocks carries a risk of loss.
Please consider carefully whether such trading is suitable for you.
>>GooD Luck 😊
❤️ Like and subscribe to never miss a new idea!

GOLD Closing out the MonthLooking for Gold to fill in the Weekly FVG then turn around to flip back bullish going into the new month. Price will show its hand between now and London. We just have to wait for it. Patience is key!

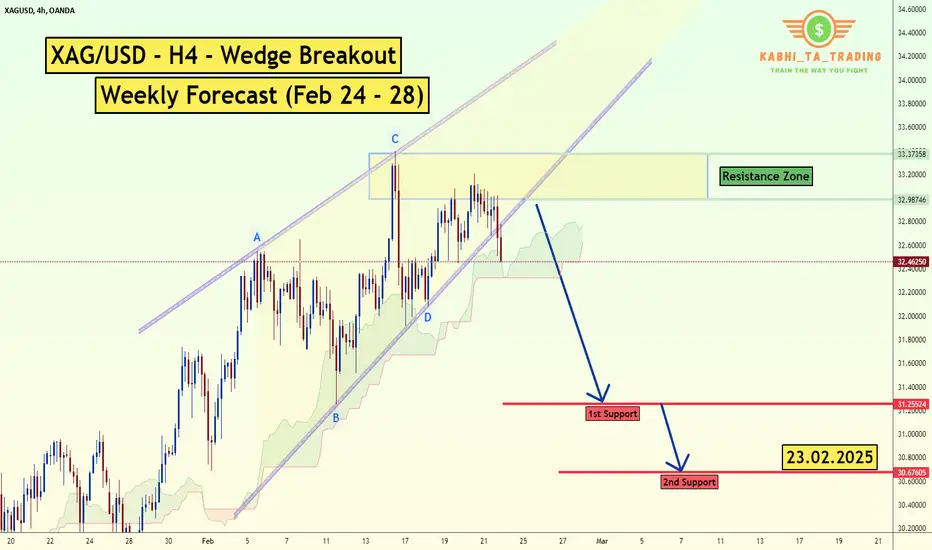
XAG/USD - Wedge Breakout (Weekly Forecast Feb 24-28)The XAG/USD Pair on the H4 timeframe presents a Potential Selling Opportunity due to a recent Formation of a Wedge Breakout Pattern. This suggests a shift in momentum towards the downside in the coming hours.
Possible Short Trade:
Entry: Consider Entering A Short Position around Trendline Of The Pattern.
Target Levels:
1st Support – 31.25
2nd Support – 30.67
🎁 Please hit the like button and
🎁 Leave a comment to support for My Post !
Your likes and comments are incredibly motivating and will encourage me to share more analysis with you.
Best Regards, KABHI_TA_TRADING
Thank you.
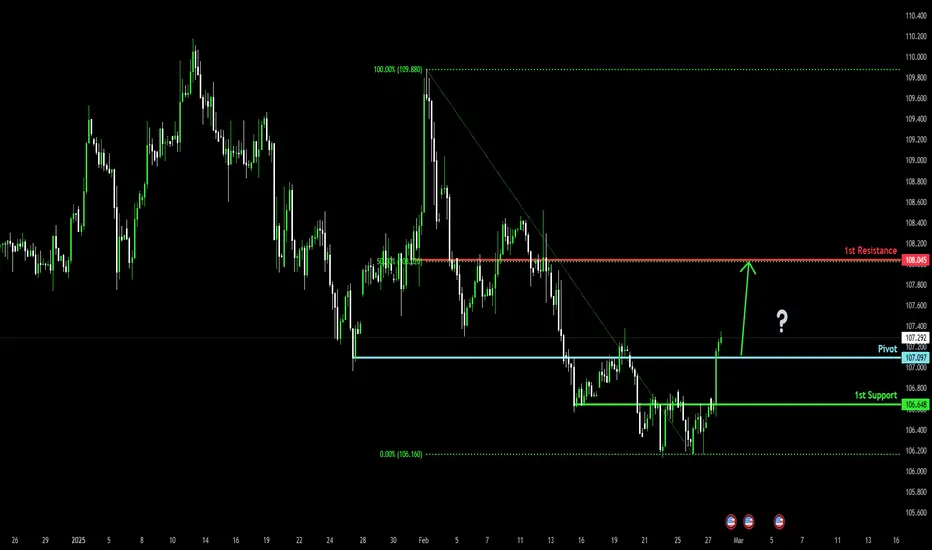
Potential bullish rise?US Dollar Index (DXY) has reacted off the pivot which has been identified as an overlap resistance and could rise to the 1st resistance that lines up with the 50% Fibonacci retracement.
Pivot: 107.09
1st Support: 106.64
1st Resistance: 108.04
Risk Warning:
Trading Forex and CFDs carries a high level of risk to your capital and you should only trade with money you can afford to lose. Trading Forex and CFDs may not be suitable for all investors, so please ensure that you fully understand the risks involved and seek independent advice if necessary.
Disclaimer:
The above opinions given constitute general market commentary, and do not constitute the opinion or advice of IC Markets or any form of personal or investment advice.
Any opinions, news, research, analyses, prices, other information, or links to third-party sites contained on this website are provided on an "as-is" basis, are intended only to be informative, is not an advice nor a recommendation, nor research, or a record of our trading prices, or an offer of, or solicitation for a transaction in any financial instrument and thus should not be treated as such. The information provided does not involve any specific investment objectives, financial situation and needs of any specific person who may receive it. Please be aware, that past performance is not a reliable indicator of future performance and/or results. Past Performance or Forward-looking scenarios based upon the reasonable beliefs of the third-party provider are not a guarantee of future performance. Actual results may differ materially from those anticipated in forward-looking or past performance statements. IC Markets makes no representation or warranty and assumes no liability as to the accuracy or completeness of the information provided, nor any loss arising from any investment based on a recommendation, forecast or any information supplied by any third-party.