DXY Under Pressure: Breakdown Incoming Below 99.00?After testing the 102 resistance zone in mid-May, the TVC:DXY resumed its downward move, dropping back into the 98.50–99.00 support zone.
The brief spike above the psychological 100 was quickly rejected, and price has since rolled over — currently trading around 99.27 at the time of posting.
🔻 The downside pressure is strong, and a break below support looks imminent.
If that break occurs:
🎯 Short-term target: 98 (approx. 1% drop)
📉 Medium-term potential: A deeper decline toward 95
DXY

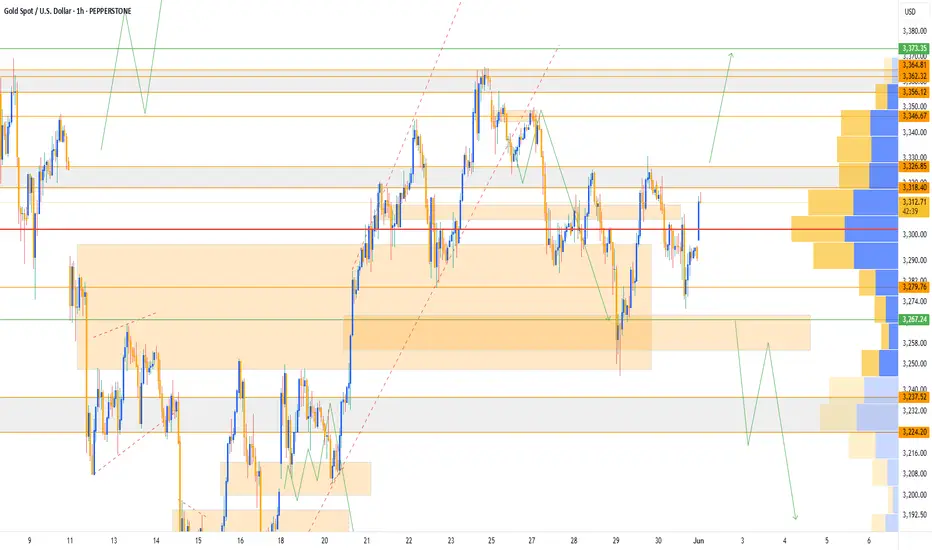
Gold 1H Intra-Day Chart 02.06.2025Huge push up on Gold on market open due to Russia - Ukraine war tension.
Option 1: Gold rejects from CMP and drops lower towards $3,270.
Option 2: If Gold closes bullish above $3,330 then $3,370 is the next major bullish target.
Which scenario do you find more likely?
$BTC 12-Week Lead Correlation w/ Global Liquidity, M2, GOLD, DXYHere’s a look at Bitcoin's price action against Global Liquidity, Global M2, GOLD and DXY - all with a 12-Week Lead.
Notice GOLD has a bit more of a deviation from the BTC price than the others.
This is because GOLD is used as a store of value asset, whereas the others are predicated on Central Banks expanding and contracting their money supply and balance sheets.
The key here is to smooth out the signal and ignore the noise.
Notice the convergence between these metrics the past couple months.

Natural Gas | Oil | Dollar | Silver | Gold Price ForecastNatural Gas | Oil | Dollar | Silver | Gold Price Forecast
NYMEX:NG1! NYMEX:CL1! COMEX:GC1! COMEX:SI1!

DXY Analysis today : Possible reversal?With strong liquidity grab at 99.00 DXY, with monthly rejection to the upside, past week we have seen with gap open the market started to drop long term support level 99.000 which smart money zone price has got bounce back to the upside with strong momentum potentially forming a double bottom with series of higher low price may continue to move up to the 100.75 to long term monthly resistance with NFP we may see further rejection down again.
A bullish on support is high probability !

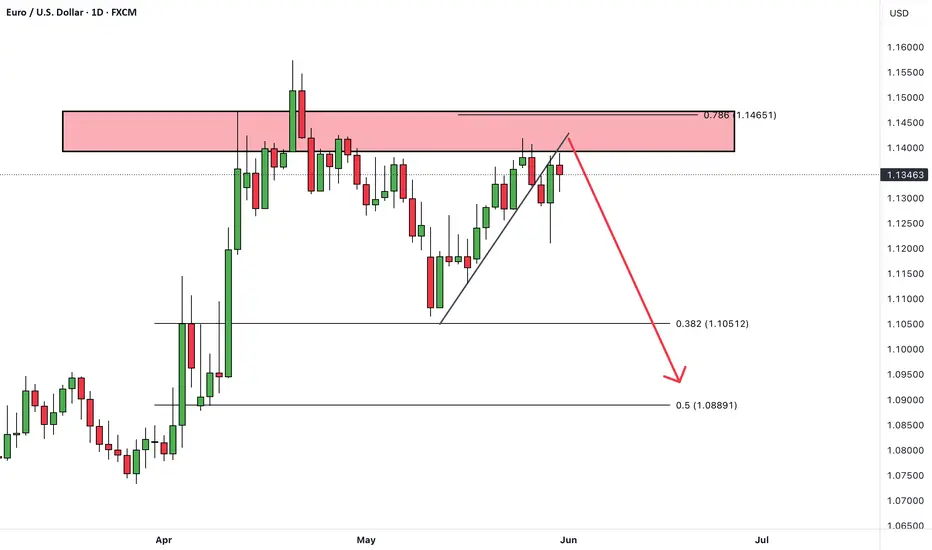
EURUSDHello Traders! 👋
What are your thoughts on EURUSD?
EURUSD is still trading below a key resistance zone, showing signs of weakness and lack of strong bullish momentum. At this stage, it seems unlikely that the pair will break above the resistance in the short term.
We expect a downward correction toward the specified support levels, before any potential resumption of the uptrend.
Despite short-term weakness, our long-term outlook remains bullish, and this pullback could offer a better entry opportunity in line with the broader trend.
Don’t forget to like and share your thoughts in the comments! ❤️
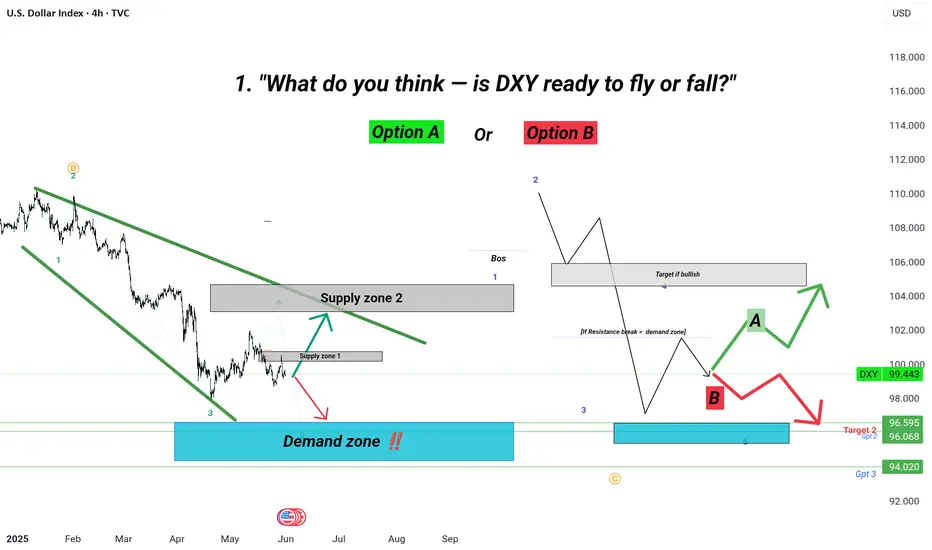
1. "What do you think — is DXY ready to fly or fall?"DXY 4H Analysis – Decision Time for the Dollar?
After completing a falling wedge with a clean 5-wave Elliott structure, the U.S. Dollar Index is approaching a key demand zone.
Will buyers step in to push price toward the bullish target near 106 📈?
Or will we see another rejection from the supply zone and a deeper drop to 94? 📉
Wave A or Wave B?
Market structure shows signs of reversal, but confirmation is still pending a break of resistance or further rejection.
👉 What do you think — bounce or breakdown?
Comment your view below ⬇️
Let’s see who’s riding the next big wave 🌊
#DXY #USD #ElliottWave #SupplyAndDemand #GreenFireForex #ForexAnalysis #WaveTheory
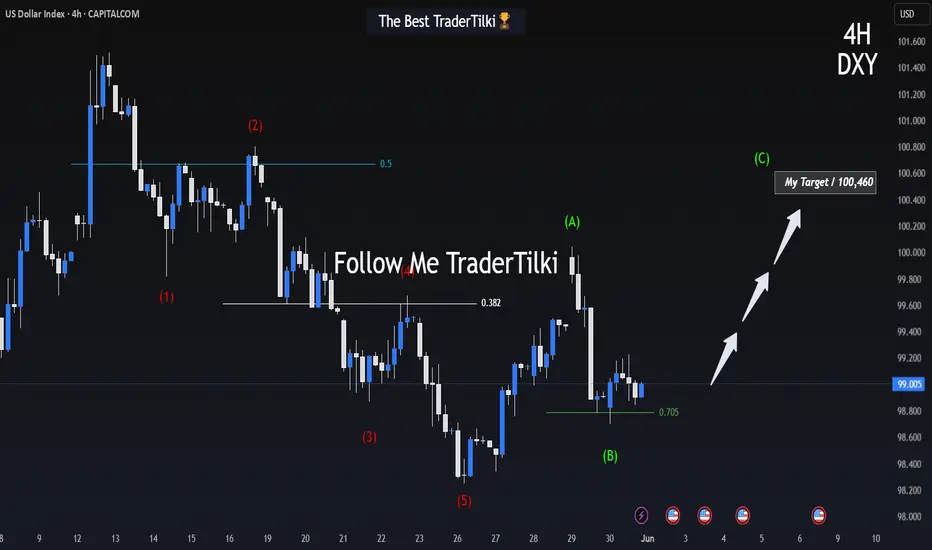
DXY 4H Breakout? Bulls Eye Momentum Shift!Hey There;
The U.S. Dollar Index (DXY) appears to have reached a critical turning point from a technical analysis perspective. According to Elliott Wave Theory, following a five-wave downtrend, the AB corrective wave has been completed, and a bullish movement towards the C wave is emerging. This scenario could signal a transition from a bearish market to a bullish one.
Technical Outlook:
- A move towards 104.460 on the DXY may indicate that the market is entering a strong recovery phase.
- The completion of the AB corrective wave suggests that buyers are stepping in, driving upward momentum in price action.
- The C wave typically retraces a portion of the prior decline, creating potential for a higher price level.
Macroeconomic Factors:
- U.S. monetary policy and inflation data remain key determinants of the dollar index’s trajectory.
- Increased global risk appetite may bolster the dollar’s appeal as a safe-haven asset.
- U.S. Treasury yields could provide additional support for DXY’s upward movement.
If DXY successfully reaches 104.460, this could confirm a shift into a bullish trend. However, the strength and sustainability of the C wave will depend on supportive volume and momentum indicators. The interplay between technical and fundamental factors could drive a solid recovery in the dollar index.
Should this scenario unfold, it may mark the beginning of a renewed period of dollar strength against global currencies. However, market dynamics and macroeconomic developments must be monitored closely to validate this outlook.
Guys, every single like from you is my biggest source of motivation when it comes to sharing my analysis.
A huge thank you to everyone who supports me with their likes!
Gold XAUUSD Weekly forecast 2-6 June 2025Observations:
Price has been respecting a clear descending trendline since late April, with multiple touches and rejections.
A significant supply zone around the 3,330 level aligns with the trendline resistance, increasing confluence for a potential reversal.
The market has formed lower highs consistently, suggesting bearish pressure is building up.
A horizontal demand/support level around 3,125 (previous swing low) is the primary target in case of a bearish breakout.
Volume and structure suggest distribution, further supporting bearish continuation.
Bearish Scenario:
If the price retests and rejects the 3,330 resistance level again next week, especially with a wick rejection or bearish engulfing candle:
Expect downside continuation toward 3,125, aligning with a ~1500 pip target.
This move would represent a ~5% drop from current levels.
Trading Plan / Signal:
Sell Setup:
Entry Zone: Between 3,320 – 3,330 (upon bearish confirmation e.g., bearish engulfing or shooting star)
Stop Loss: Above 3,350 (just above trendline and invalidation zone)
Take Profit 1 (TP1): 3,250
Take Profit 2 (TP2): 3,200
Take Profit 3 (TP3): 3,150/25
Risk–Reward Ratio: Approximately 1:3+
Invalidation:
Clean breakout and retest above 3,350 would invalidate the setup and may suggest a reversal toward 3,500.
Fundamental Consideration:
No major geopolitical or macroeconomic shocks should occur to maintain this bearish bias. Any high-impact news could cause volatility, so monitor the economic calendar closely.
Please follow, like, comment and share.

USDJPY 4H Analysis – Market Dynamics ChangingDear Traders,
Guys, the bearish trend in USDJPY has now shifted into a bullish uptrend. My target level for USDJPY is 146.330. Once it reaches my target, I will share updates under this post.
Friends, every single like from you is my biggest source of motivation when it comes to sharing my analysis.
A huge thank you to everyone who supports me with their likes!

Final BTCUSD update..Good day traders, here is my final update on BTCUSD and I like how price has been respecting our PD arrays. Keep in mind traders price moving in waves and what again😂😂🏃🏾♂️, point is today is the last trading day for the week and my thoughts is that we can expect BTCUSD to start going higher today and tomorrow maybe till Tuesday …sorry I’m being too sure but if you focus on time and price you start to KNOW(ledge) things or maybe I should say secrets?!🤨🤔
I always expect price to manipulate higher if my bias is shorts, ICT’s power of 3 works wonders when it come to this thought process.
Watch how price reacts to the FVG where price is trading now, it’s not a signal just watch out price moves always from it for the rest of today.
We only going high to shoot lower…keep that in mind!!🤯
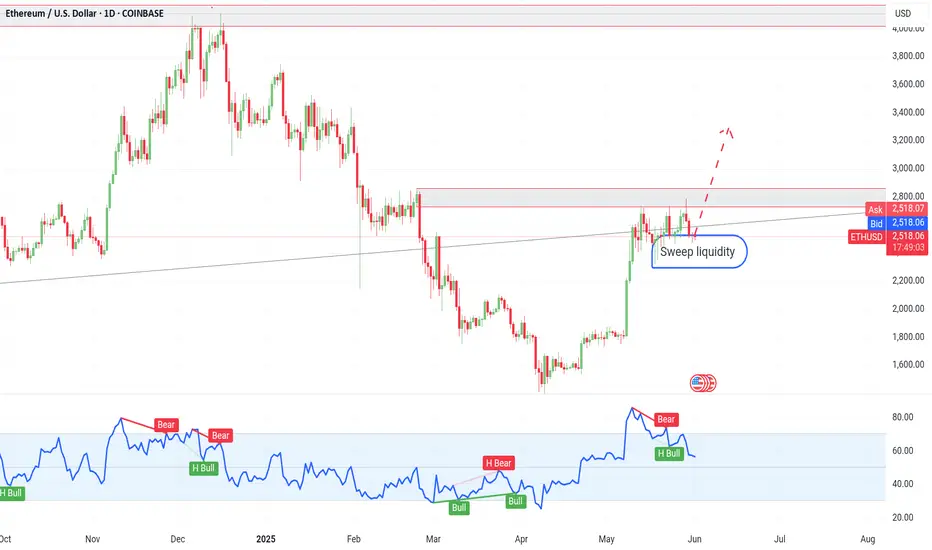
ETH on high time frame
"Hello traders, focusing on ETH, the price is currently at a critical level around $2,800, where it has made multiple unsuccessful attempts to break through. On the high time frames, the price has swept liquidity without showing any signs of reversal. This leads me to anticipate a higher price movement, with the next potential level being around $3,400."
If you need further assistance or have any specific questions, feel free to let me know!
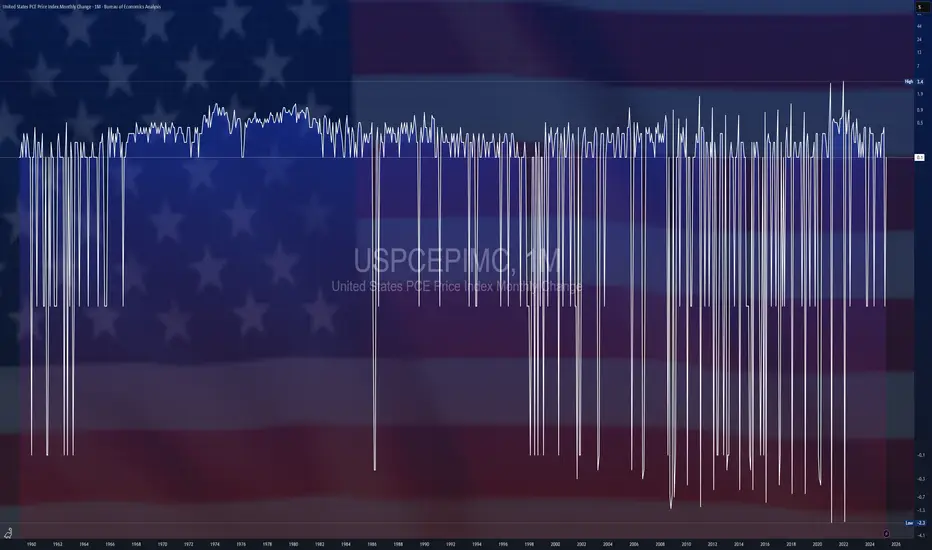
$USPCEPIMC -U.S Core PCE (April/2025)ECONOMICS:USPCEPIMC
April/2025
source: U.S. Bureau of Economic Analysis
-The core PCE price index in the US, which excludes volatile and energy prices and is Federal Reserve's chosen gauge of underlying inflation in the US economy,
went up 0.1% from the previous month in April of 2025.
The result was in line with market expectations.
From the previous year, the index rose by 2.5% to slow from the 2.7% jump from March, the softest increase since March of 2021.
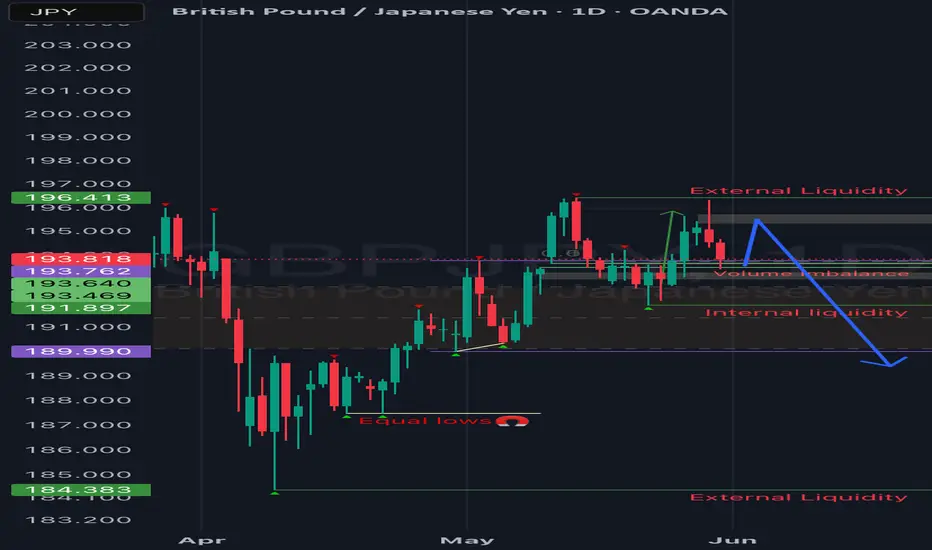
GBPJPY update!!Good day traders, I’m back with yet another beautiful setup on GJ and I really wish we can all monitor how price plays out and learn more about price signature.
For this setup I’ll explain more about it after the fact because it’ll help me make my point clearer and easily understandable.
Yet another gift..🎁🧧
Bullish USDJPY The video is self-explanatory.
UJ failing to break a strong weekly and daily support zone, which increases the probability of a bullish trend for the next days or weeks.

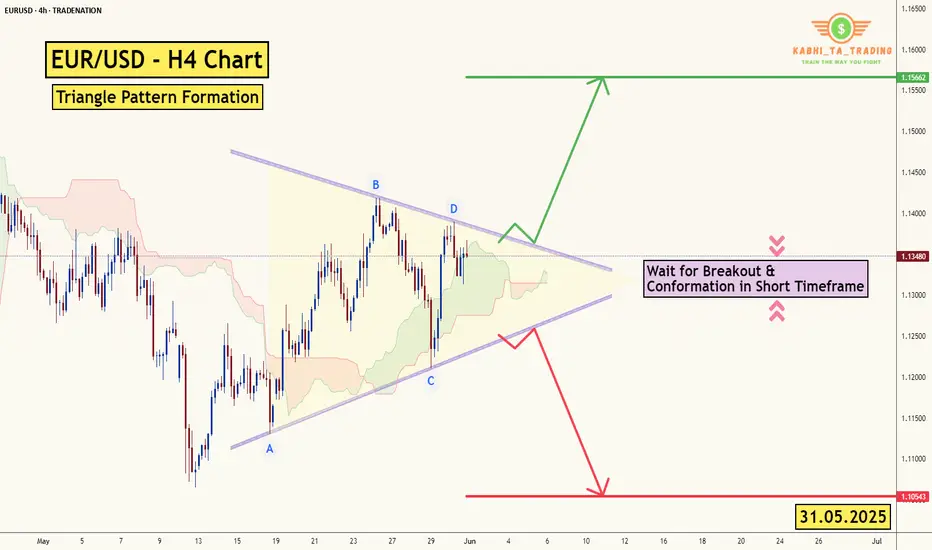
EUR/USD - H4 - Triangle Formation (31.05.2025)The EUR/USD pair on the H4 timeframe presents a recent Formation of a Triangle Pattern.
1. Wait for Breakout with Good Volume
2. Conformation in short Timeframe Must
🎁 Please hit the like button and
🎁 Leave a comment to support for My Post !
Fundamental Updates :
Dollar mixed on tariff uncertainty, U.S. President Donald Trump to battle a U.S. trade court ruling that blocked most of his proposed tariffs.
Your likes and comments are incredibly motivating and will encourage me to share more analysis with you.
Best Regards, KABHI_TA_TRADING
Thank you.
Disclosure: I am part of Trade Nation's Influencer program and receive a monthly fee for using their TradingView charts in my analysis.
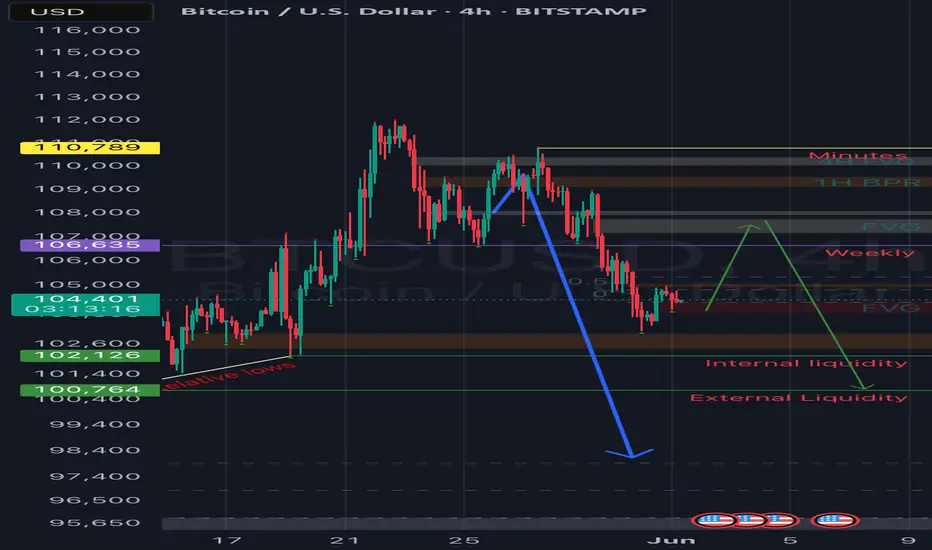
BTC on high time frame
"Hello traders, focusing on BTC on high time frames, the $102,000 level (referred to as the vector level) is crucial for price action. If the price convincingly breaches and closes below this level on the 4-hour or higher time frames, it suggests a potential move to the downside.
However, if the price merely sweeps liquidity and forms shadows on the high time frames without closing below the critical level, it indicates the potential for further upward momentum towards new higher highs."
If you have any more details to add or need further assistance, feel free to let me know!

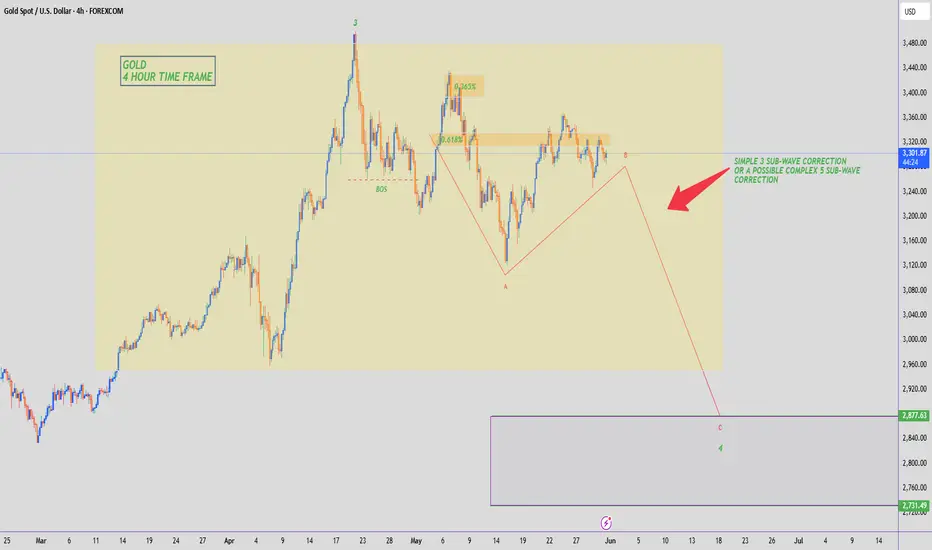
GOLD - WAVE 4 CORRECTION TO $2,800 (UPDATE)Gold has once again rejected the 0.618 Fib level & dropped back into the lower bound of the range zone overnight, which is what we like to see.
But overall, we remain within the range so we exercise patience & keep an eye out for any possible alternatives which might happen for Gold. Nice profits for us either way.
EURUSD | Bearish Divergence | Bearish MomentumCurrently, EURUSD is clearly in a downtrend, consistently forming lower lows and lower highs, confirming a bearish market structure. According to Dow Theory, the recent bullish momentum has now shifted into a confirmed downtrend. Additionally, the 1-hour trendline support has been broken, signaling weakness in the previous bullish leg. We now anticipate a pullback toward the recently broken structure or resistance zone, where further bearish continuation is likely.
On the 1-hour timeframe, a well-formed bearish divergence on the RSI adds confluence to our bias, indicating weakening bullish momentum and a potential trend continuation to the downside. Since our initial entry was slightly late, we’ve strategically placed a limit order near the retest zone and executed a partial position at the current market price to secure early exposure. Overall, structure and momentum both align with short-term bearish sentiment.

The tariff legal zig-zagWith different US courts firing "shots" at each other over the legality of tariffs, the market is taking a bit of a pause from accelerating further. Let's dig in!
DJ:DJI
TVC:SPX
TVC:NDQ
TVC:DXY
Let us know what you think in the comments below.
Thank you.
77.3% of retail investor accounts lose money when trading CFDs with this provider. You should consider whether you understand how CFDs work and whether you can afford to take the high risk of losing your money. Past performance is not necessarily indicative of future results. The value of investments may fall as well as rise and the investor may not get back the amount initially invested. This content is not intended for nor applicable to residents of the UK. Cryptocurrency CFDs and spread bets are restricted in the UK for all retail clients.

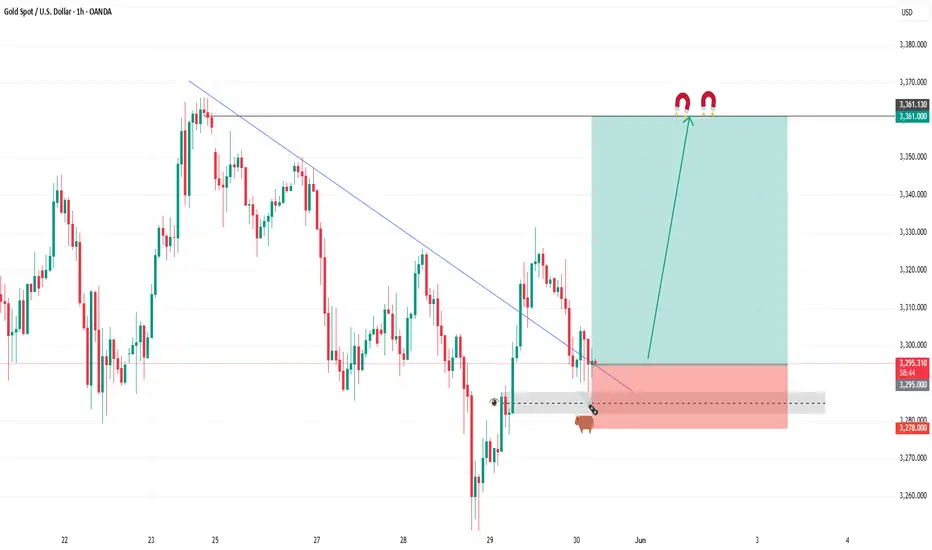
BUY GOLDIn todays session we are monitoring GOLD for buying position. Our entries are at 3295 and targets are above 3361. Our stops are below 3278. Use proper risk management. Good luck to you all.
Gold XAUUSD Move 29 May 2025Price Action: The price recently approached the 3,320-3,325 resistance zone (highlighted by horizontal lines) and rejected it, forming a bearish candlestick pattern (e.g., shooting star / doji). This suggests strong selling pressure at this level.
Trendline: The trendline from the recent high shows a potential double top or head-and-shoulders pattern, reinforcing the likelihood of a reversal.
Support Levels: Immediate support lies around 3290/80 (previous consolidation zone).
Volume (implied): A spike in selling volume at 3,320-3,325 could confirm the rejection.
Analysis: The rejection at 3,320-3,325, combined with the trendline break, indicates a potential sell-off. The market may be shifting from bullish to bearish momentum, especially if the price closes below the recent low.
Signal: Sell at 3,320-3,325 if the price rejects again with a bearish candle confirmation. Target 3,200-3,250, stop loss above 3,335.

30.05.25 Morning ForecastPairs on Watch -
FX:EURUSD
A short overview of the instruments I am looking at for today, multi-timeframe analysis down to what I will be looking at for an entry. Enjoy!
