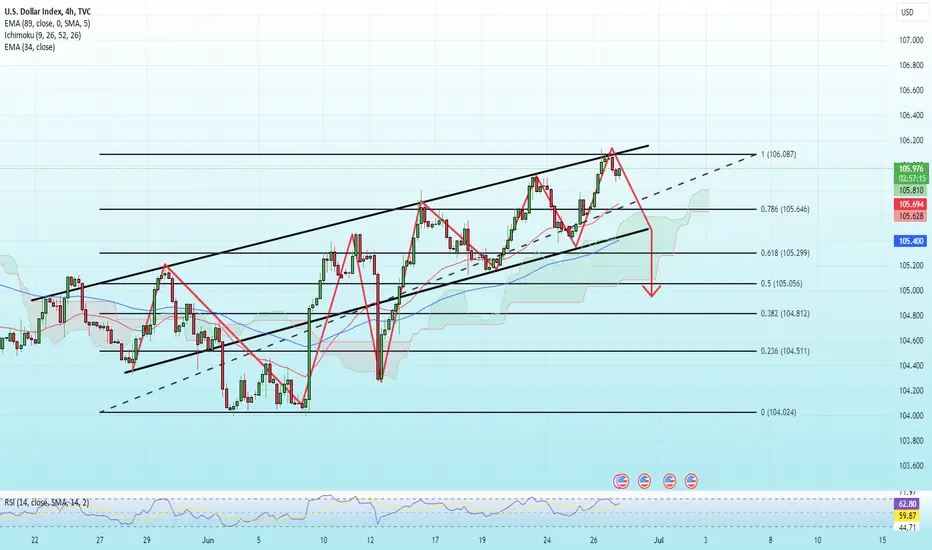
DXY:C has bearish GAP reactions amid election newsDXY: The USD index is having transient reactions withinside the establishing consultation of the week with GAP falling sharply in a touchy context because of election news. In phrases of technical factors, with this GAP pressure, it's far viable that the USD will witness a bigger correction that could increase the buildup variety to the 105.6 area. You can keep in mind quick promoting the USD today.
Dxyanalysis
DXY moved into a narrow range but looks bullish**Monthly Chart**
DXY has been moving into a long-term range between 107 and 100 levels (round numbers) from January 2023. Last month candles closed lower after creating manipulation candles on monthly. This month's candle (currently active) tested the low of the previous two months and pushed higher with the NFP announcement last Friday. This moved DXY back into a narrow range.
Note: I don’t trade DXY but I use it as an indication when analyzing other currency pairs linked to USD.
**Weekly Chart**
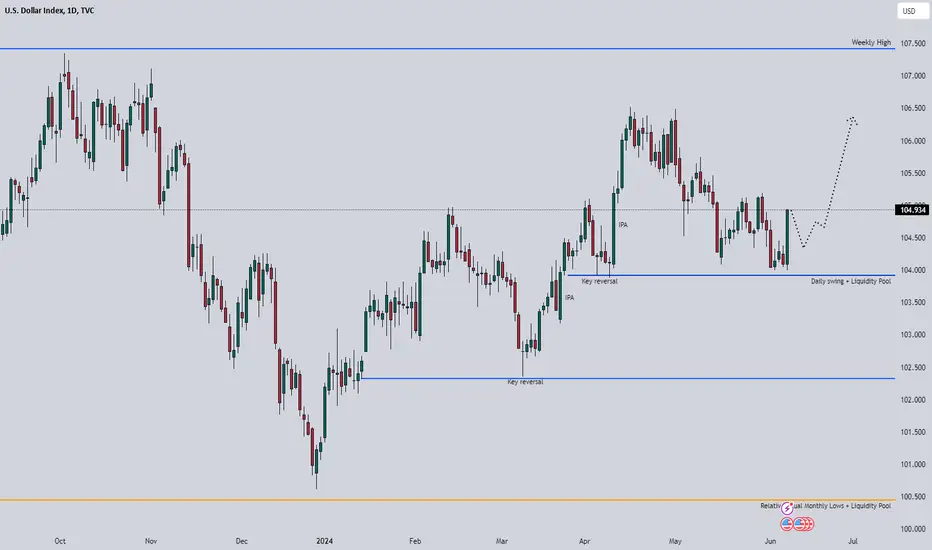
Last week the DXY closed higher after testing the daily swing low and liquidity pool around 104 level. It closed as a weekly bullish key reversal (low test) candle pattern which indicates a move of the price will be bullish for next week. The next target will be around 106, followed by 107.34 levels.
**Daily Chart**
You can see the impact of NFP and Employment Change that created a massive bullish candle on Friday after testing the Imbalance price action (IPA) for the entire week near the previous daily low and liquidity pool. This candle is a new IPA that will need to be tested for liquidity again this week. I will be looking for a retracement towards at least 50% of this candle which will provide a second confirmation that the move for DXY will be bullish for the upcoming weeks.
This is another indication to look for selling opportunities for other currencies against the USD. Such as EURUSD, AUDUSD, and GBPUSD to go short for this week.
DXY: USD index still maintains bullish stanceDXY: The USD index yesterday received both good and bad news. Therefore, we see that the USD largely maintains a state of accumulation and adjustment. On the Daily frame, a fairly positive candlestick is formed around the 105.70 threshold. However, in today's session, DXY is at risk of a deeper correction to around the 105.50 - 106.00 area and maintains its accumulation state today. You can consider buying USD when DXY returns to the 105.5-105.6 area.
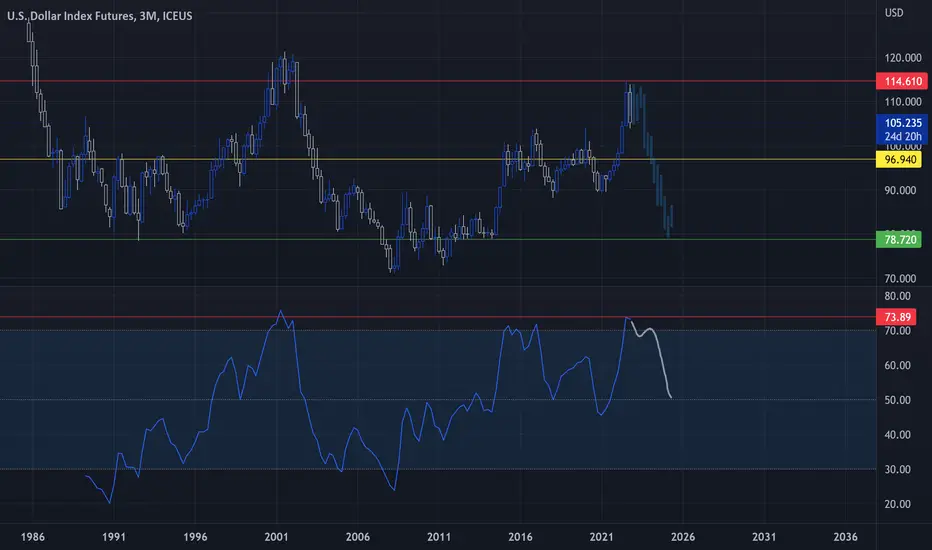
DXY - Ending DiagonalTVC:DXY
Will the US Dollar finally die from this ending diagonal at heavy resistance...?

DXY increased in price abnormallySometimes, it’s not worth overcomplicating things.
While the (negative) correlation between real yields and gold has deteriorated in recent months, after-inflation interest rates remain one of the biggest factors driving the performance of the yellow metal.
With the benchmark US 10yr Treasury yield carving out a potential near-term bottom last week and rising to a two-week high today, gold accordingly topped out last week and has fallen to a two-week low. Now moving forward, the key level for bond and gold traders to watch will be the 4.31-2% level that has served as consistent support/resistance dating back to at least 2022. If yields can rally above that level, it could spur on another leg lower in gold prices.
DXY is strong when it releases 1-year bond yields, but this is just a temporary move when things are not going well for US data
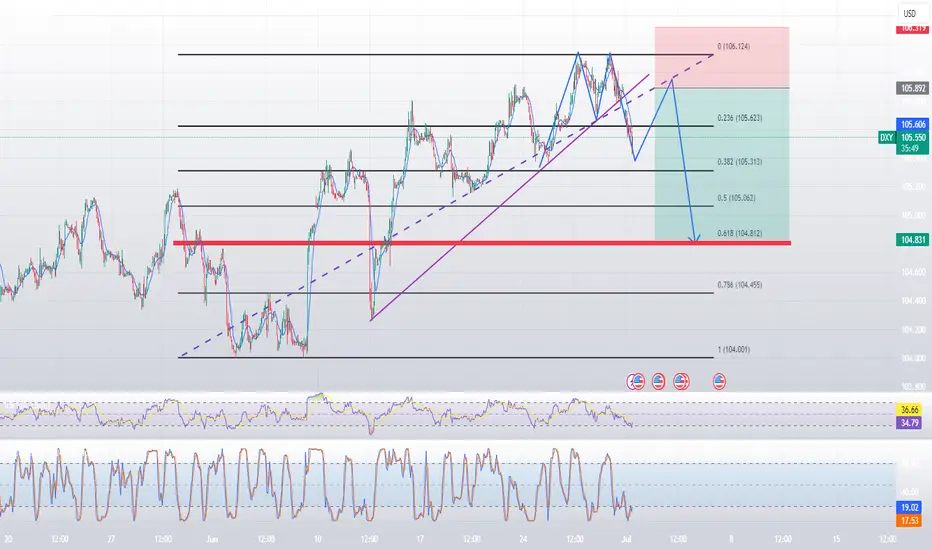
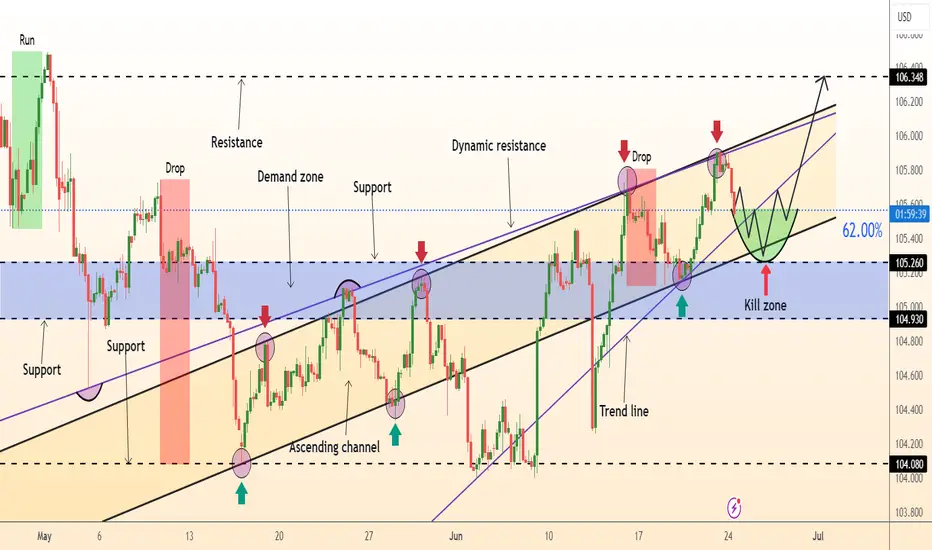
DeGRAM | DXY testing of the correction levelDXY is moving in an ascending channel between trend lines.
The volatility of the movement is decreasing.
The impulse started from the demand zone and now the price is above the 62% retracement level, which has already been a pivot point for 3 times.
We expect a rebound after retesting the 62% retracement level.
-------------------
Share your opinion in the comments and support the idea with like. Thanks for your support!
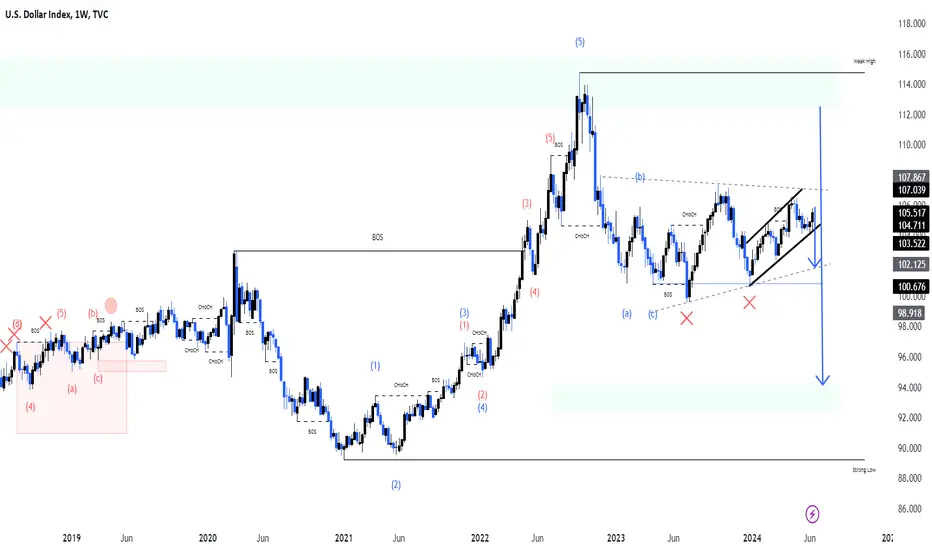
DXYPair : DXY Index
Description :
Symmetrical Triangle as an Corrective Pattern in Long Time Frame
Completed " 12345 " Impulsive Waves
Break of Structure
Bullish Channel as an Corrective Pattern in Short Time Frame
RSI - Divergence
DXY MARKET FORCAST ON MONDAYOn the 1-hour time frame, the DXY is ranging between 105.505 and 105.774. If the market breaks below 105.505, we anticipate buying opportunities in the gold market. Conversely, if it breaks above 105.774, we expect selling opportunities in the gold market. This is my current perspective on the DXY. From these key levels, the market has been respecting. Last week, the DXY formed an inverse head and shoulders pattern, followed by an impulsive move. Currently, it might be forming a correction or a bullish flag. We will wait to see which direction it breaks before pursuing opportunities in the gold, GBP/USD, and EUR/USD markets.
DXY IndexPair : DXY Index
Description :
Symmetrical Triangle as an Corrective Pattern in Long Time Frame
Bullish Channel in Short Time Frame
Break of Structure
Completed " 12345 " Impulsive Waves and " A " Corrective Waves
RSI - Divergence
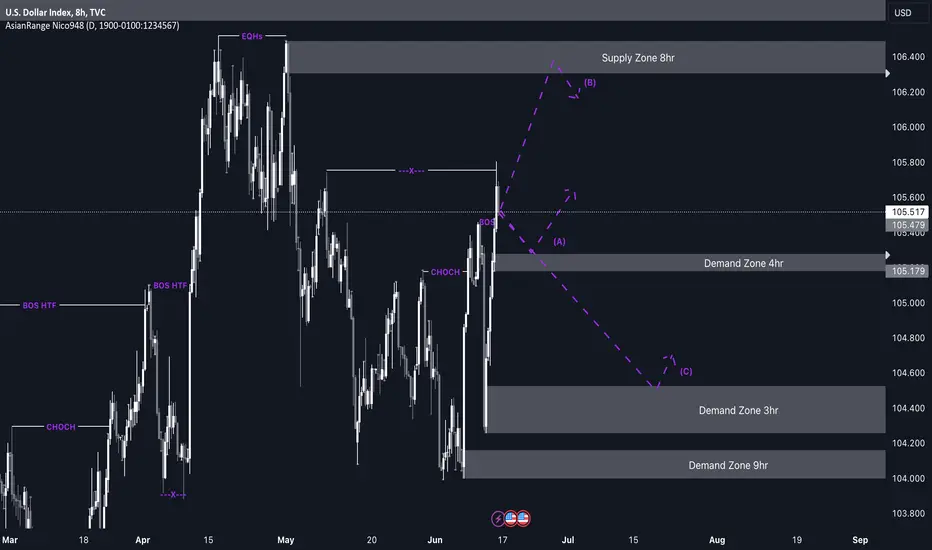
DXY Bullish rallies from 105.200 or 104.400The bias for the dollar is to continue its bullish trend. We have seen a change of character on the higher time frame followed by a break of structure, confirming the upward movement. There are also equal highs above the current price that need to be swept.
Due to recent bullish momentum driven by news, the price may be exhausted. At the start of the week, we might see a drop in price as it mitigates a demand zone. Once the price taps into one of these marked demand zones, I expect a bullish reaction.
P.S. Once the price moves up, it may react to the 8-hour supply zone, causing a temporary sell-off. However, I won’t be surprised if this zone gets violated due to the liquidity pool sitting above it.
US Dollar Index (DXY) Update- Small pump then Dump.
- Keep it simple.
- Everything in graph.
- Older analysis. 👇👇
Happy Tr4Ding !
GBPUSD & DXY Analysis: Key Expectations and Trends Ahead!Greetings, Traders!
Join me in today's video for an in-depth analysis of GBPUSD and DXY, where we'll explore key expectations for today's and tomorrow's trading sessions, as well as summarize this week's trends. This analysis is pivotal as it sets the tone for next week's trading. We've reached a critical juncture on both the DXY and GBPUSD charts, making it essential to understand the potential market movements ahead.
What do you think will be the major market mover going into next week?
Stay tuned for valuable insights, and don't hesitate to leave any questions or comments below.
Happy Trading,
The_Architect

Bearish on DXYThis week we have CPI and US Fed funds rate announcements. Most probably we don't get a rate cut for now (as the market expects). However, I think this week the announcements are coming out with a more dovish tone.
Let's see what happens . . .
If the CPI number come out lower or equal to the expectations and the Fed Chair Powell signals 1 or 2 rate cuts for this year. I believe we can expect the yellow scenario. Otherwise, we can expect the red scenario happens in short term.

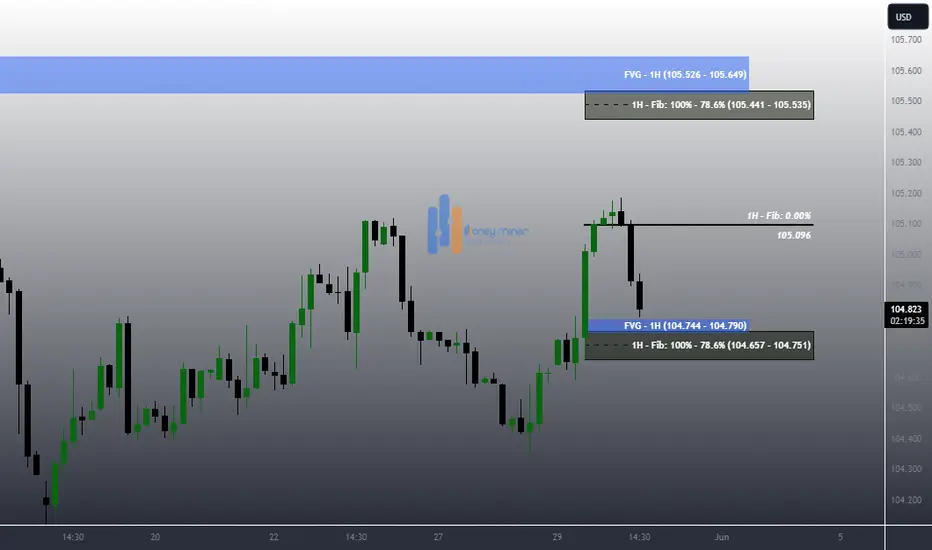
DXY Weekly Analysis Dollar index has retested the weekly fvg and also sweeping the Swing Low on Daily Time frame. After sweeping the low the DxY reversed and made a new high with a market structure shift .
In the upcoming weeks the dxy will retrace a little to the daily fvg and from there will target buyside Liquidity near 105.7 and 106.5

dxyWe are in a resistance zone waiting for us to return to the green lines again
It takes a lot of time
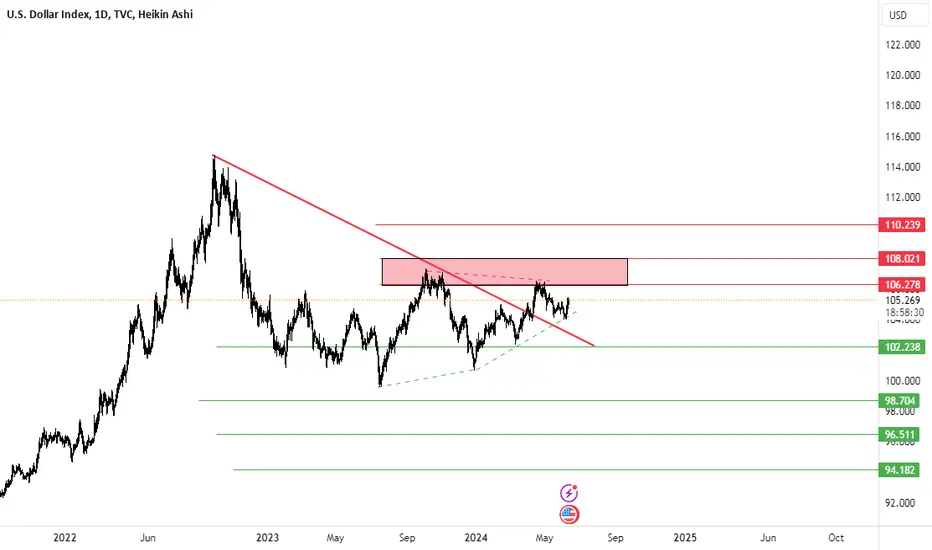
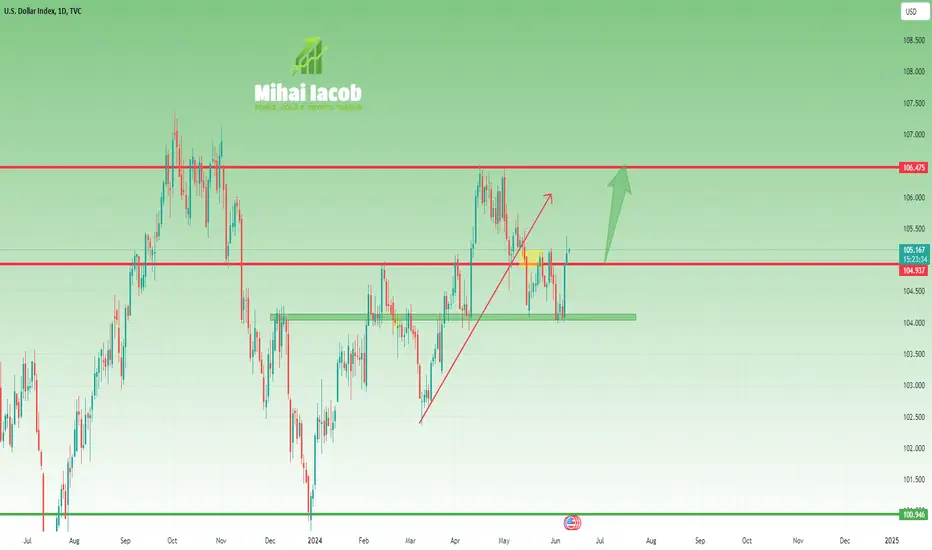
DXY could rise back to 106.50 resistanceThe beginning of May marked the start of a correction for the DXY, with the index dropping from 106.50 to the 104 support zone.
However, after finding support around 104 and undergoing a few days of consolidation, the much stronger-than-expected NFP data last Friday led to a reversal for the US Dollar, as evidenced by a significant bullish engulfing pattern on our daily chart.
Yesterday, the index also broke above horizontal resistance, and at the time of writing, the price is 105.18.
I expect the uptrend to continue, potentially leading to a new test of the recent high at 106.50.
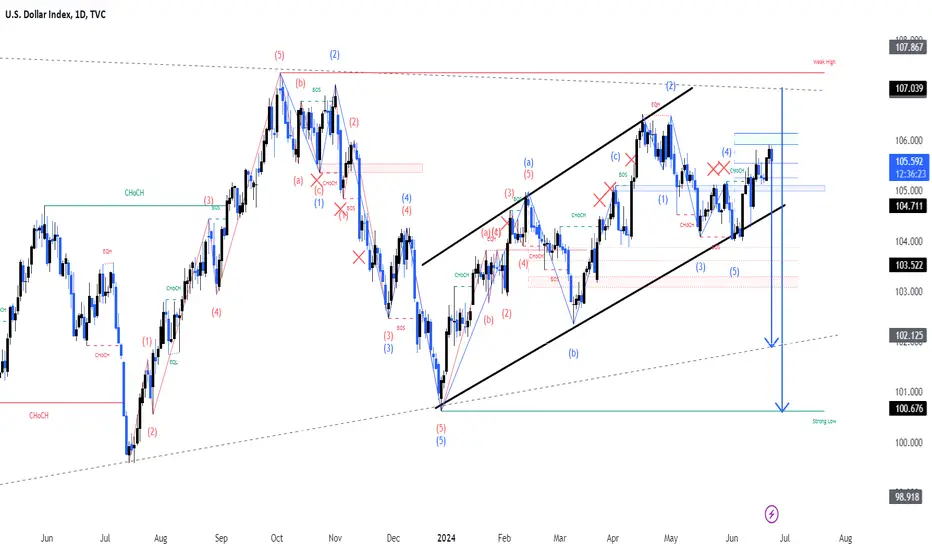
DXY IndexPair : DXY Index
Description :
Completed " 12345 " Impulsive Waves and " A " Corrective Waves
Break of Structure
Demand Zone
Fibonacci Level - 50.00% / 61.80%
Bearish Channel in Long Time Frame

DXY and USD Pairs Technical Analysis and Trade Idea In this video, we provide a succinct analysis of the U.S. Dollar Index (DXY) and its potential impact on USD pairs. Following recent bullish momentum, the DXY has become overextended, reaching resistance levels. Currently, we observe a significant retracement toward support. Our main goal is to identify an optimal buy entry point within this critical support zone, assuming price action aligns with our analysis from the video.
As always, the video offers valuable insights into trade entry points, trend analysis, market structure, and price action. It’s essential to recognize that this content serves an educational purpose and should not be construed as financial advice." 📈🚀📊

Chart Idea - DXYDXY weekly chart looks too bullish which is very bad to the markets. Looking for short swing positions on QQQ and ES. DXY probably looking to hit 107+ range before retracing it back in next few weeks.

DXY monthly Price analysis 3 June 2024Monthly Chart: The price has rejected from the monthly OB then, It created a M-MSS. Now month of June the price has goin bellow the TMO before the NFP week. So we could anticipate that rest of the month the price will go upward.
Monthly Bias: Bullish
Weekly Chart: The price is going down towards the PML W-SSL. There are W-FVG along with W-BPR & W-OB which might work as a resistance. If we have any H4-MSS+ after the NFP news events from those W-PDA's then our weekly Bullish Bias will be confirmed.

June 03, DXY & GBPUSD: Trading Insights for the Week Ahead!Greetings, Traders!
Brief Description🖊️:
We are in the first week of June, a period marked by high-impact news, including the Non-Farm Payroll (NFP) report. In this video, I will provide an in-depth analysis of the DXY and GBPUSD pairs, offering valuable insights for the upcoming week in trading.
Things We Will Cover👀:
Lecture on Draw On Liquidity🧠:
Understanding how to analyze the market objectively.
Studying key concepts such as Fair Value Gaps (FVGs), order blocks, mitigation blocks, breakers, and more.
Market Analysis📉📈:
DXY and GBPUSD: Detailed analysis of these pairs to uncover potential trading opportunities for the week ahead.
Draw On Liquidity: Understanding what the draw on liquidity is for this week and how it impacts our trading strategies.
What's Important Now❗
Stay tuned to gain a comprehensive understanding of market analysis and to identify profitable trading opportunities in the upcoming week.
Best Regards,
The_Architect

DXY INDEXPair : DXY INDEX
Description :
Completed " 12345 " Impulsive Waves and " ABC " Corrective Waves
Break of Structure
RSI - Divergence
Bullish Channel as an Corrective Pattern in Short Time Frame
Demand Zone

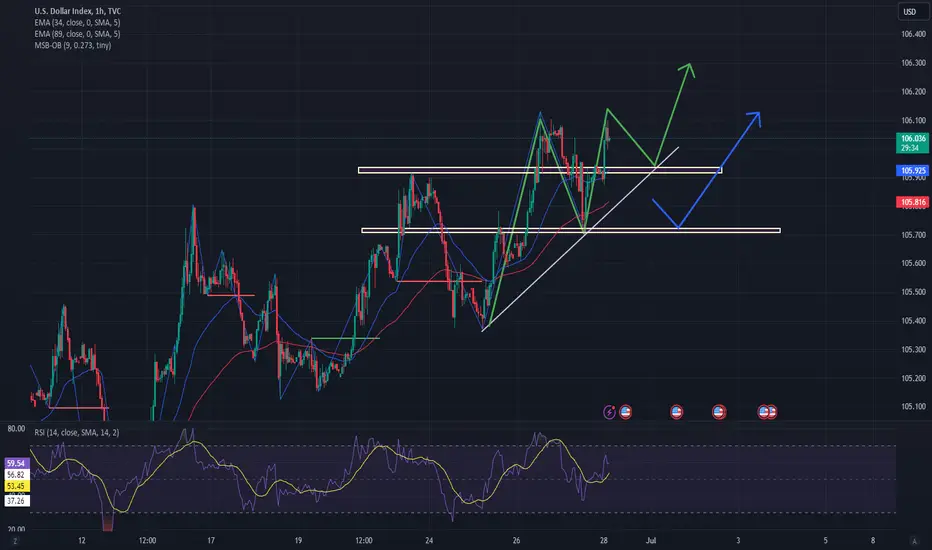
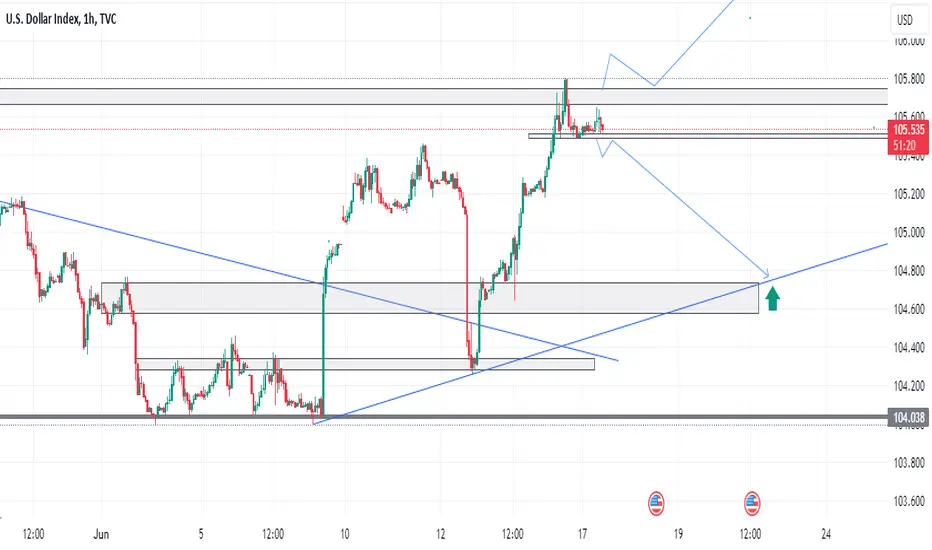
DXYDXY analysis
1 hour time frame
Now we are at the bottom of the 1-hour range, which I expect to move up to the top of the range