Technical Analysis of the US Dollar IndexA bearish cross was made between the 20-day Simple Moving Average (SMA) and the 50-day SMA on Friday, as the US Dollar Index (DXY) closed below the 100-day Simple Moving Average (SMA). After moving sideways near 50 in the past couple of weeks, the Relative Strength Index (RSI) dropped below 50.
As a key support, psychological level 102.00 (static level) aligns on the downside. As long as that level is closed below on a daily basis, there is a possibility that sellers will be attracted to the price and it may slide towards 101.50 (static level) and 101.00 (static level, psychological level) for an extended period of time.
There appears to be strong resistance at 103.00 (100-day SMA, 50-day SMA, Fibonacci 38.2% retracement of the June-May uptrend). A break above that level could lead the DXY to target 103.50 (Fibonacci 23.6% retracement) and 104.00 (psychological level) in the near future.
Dxyanalysis

DXYDXY BUY
TP in the chart
SL in the chart
Good luck guys
Note: To reduce the risk on your balance
you have to use only 2% of your balance.
-
-
-
-
-
-❤️If you have any questions, please, ask me in the comment section.
Please, support my work with like, thank you!❤️.
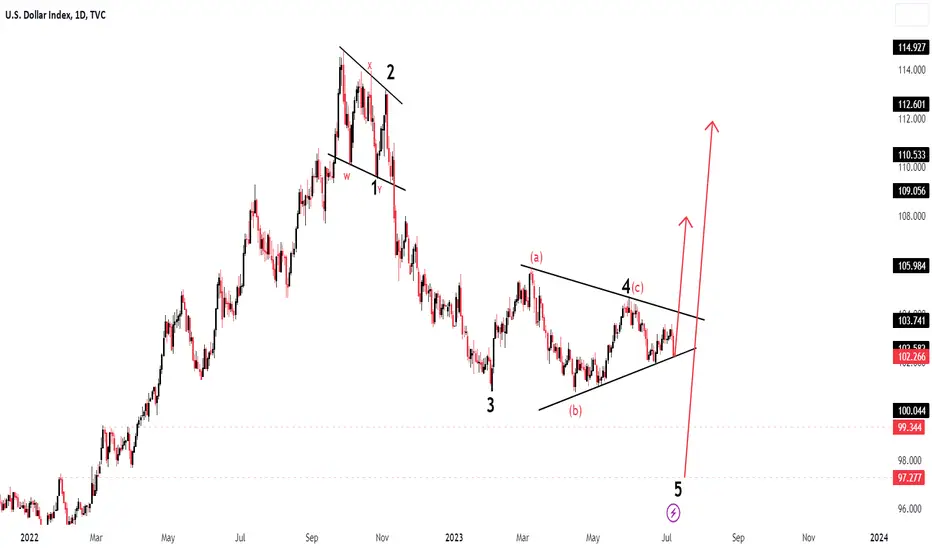
DXY Index New Possible MovePair : DXY Index
Description :
Completed " 1234 " Impulsive Wave
Divergence - RSI
Break of Structure
Impulse Correction
Bearish Channel as an Corrective Pattern in STF
S / R Level
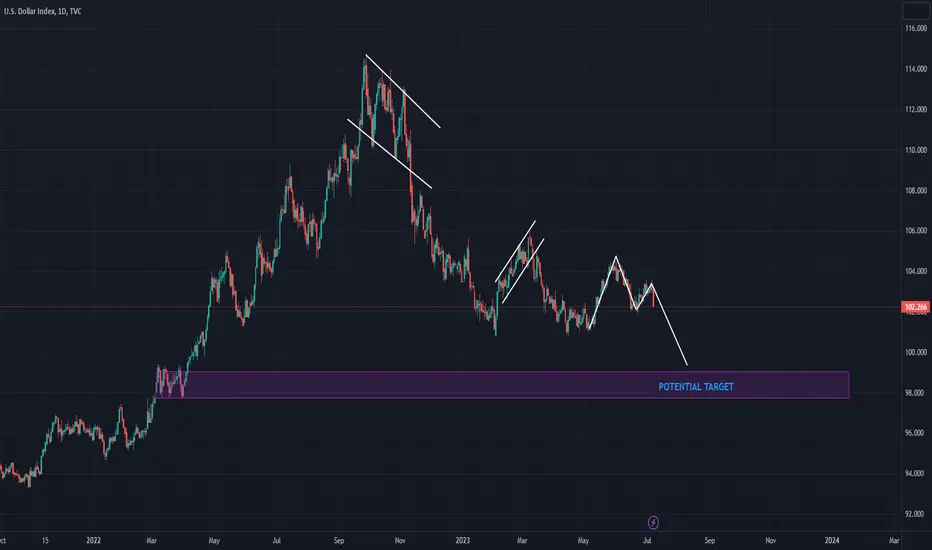
DeGRAM | DXY bearish moveDXY could not go higher than the resistance level, which drops after a double top is created.
Price action is moving in a descending channel.
We expect the support zone to be tested.
-------------------
Share your opinion in the comments and support the idea with like. Thanks for your support!

DXY Potential To DownsideIt will be interesting to see conditions at the beginning of next week. If the movement cannot be broken at the 101.30 area, it is possible that the movement will experience a correction first. Even though the potential on the target could still be in the area of 98.
DXY Weekly Analysis - Bearish DrawThe Dollar Index is showing clear signs of wanting to reach lower.
A trade entry can be found within the previous week's range.
In order of Draw on Liquidity:
1. Weekly Low.
2. Weekly +OB
3. Weekly + OB MT
4. New Lows
- R2F

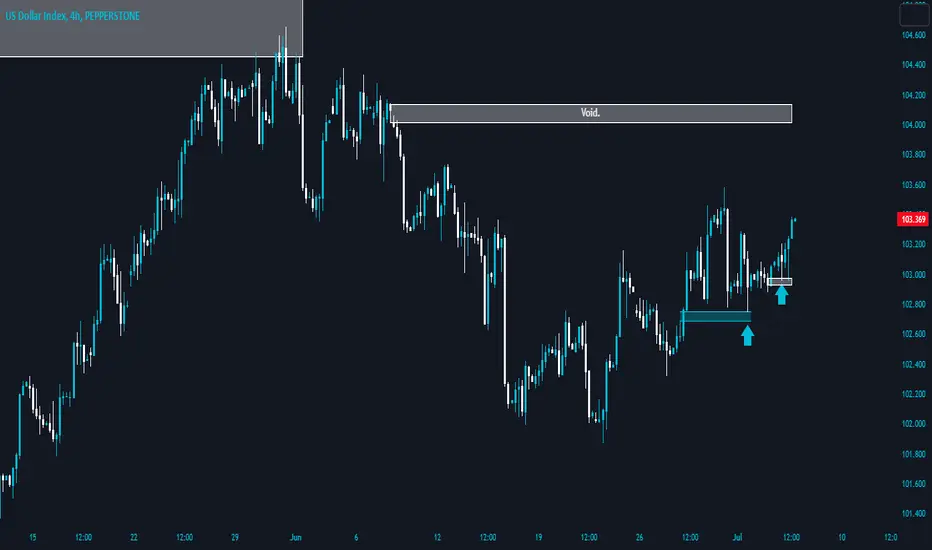
LIQUIDITY VOID, DXY LONG.In the 4hr timeframe, XAUUSD is bullish. Price is pushing to fill that liquidity void at 104.014 - 104.138.
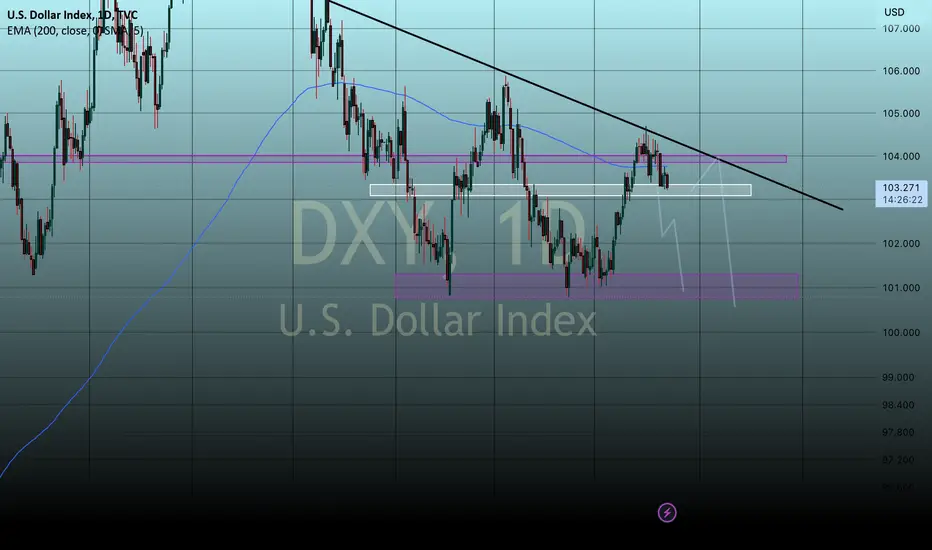
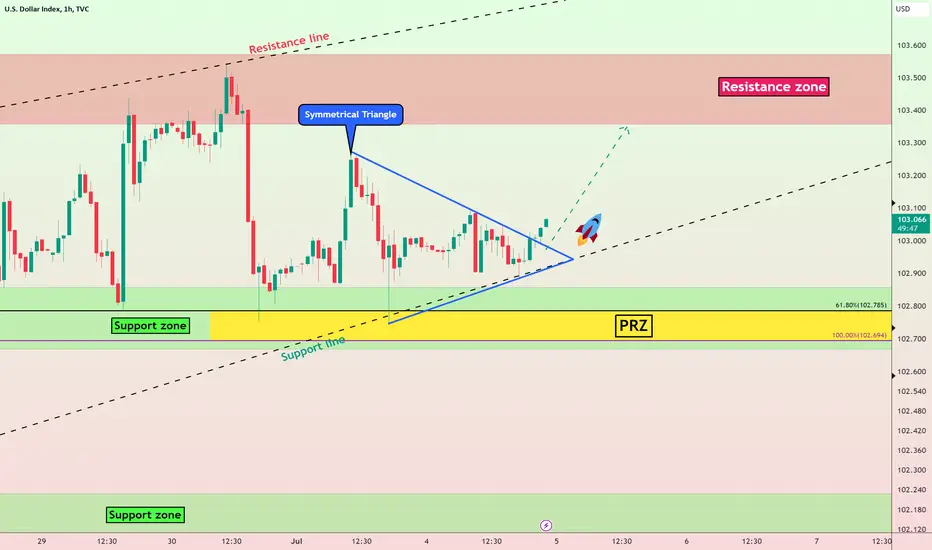
DXY will go UP by Symmetrical Triangle🚀DXY index managed to form a Symmetrical Triangle Pattern near the 🟢 support zone($102.85-$102.66) 🟢 and support line.
DXY broke the upper line of the symmetrical triangle.
I expect the breaking of the upper line of the symmetrical triangle to be a sign for the DXY index to go up in the coming days.
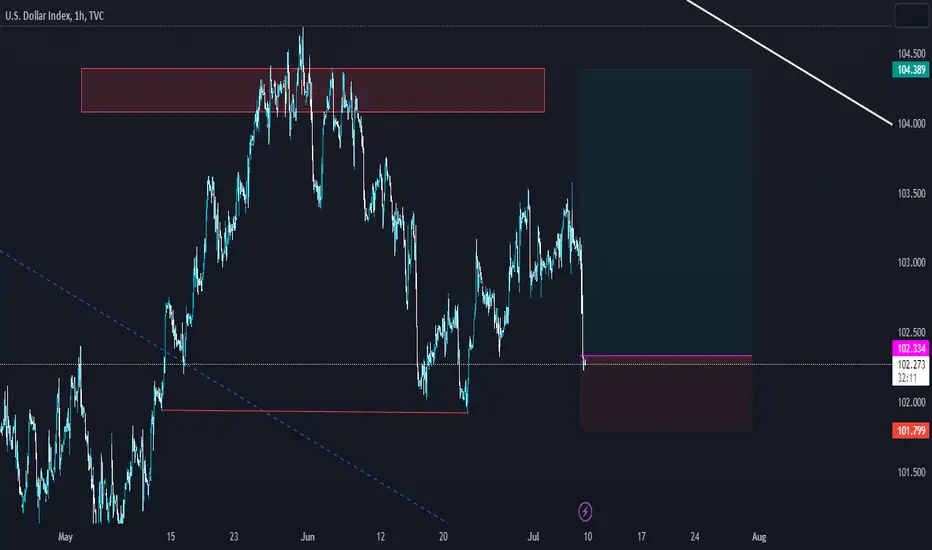
U.S.Dollar Currency Index ( DXYUSD ) Analyze, 1-hour time frame⏰.
Do not forget to put Stop loss for your positions (For every position you want to open).
Please follow your strategy, this is just my Idea, and I will be glad to see your ideas in this post.
Please do not forget the ✅' like '✅ button 🙏😊 & Share it with your friends; thanks, and Trade safe.
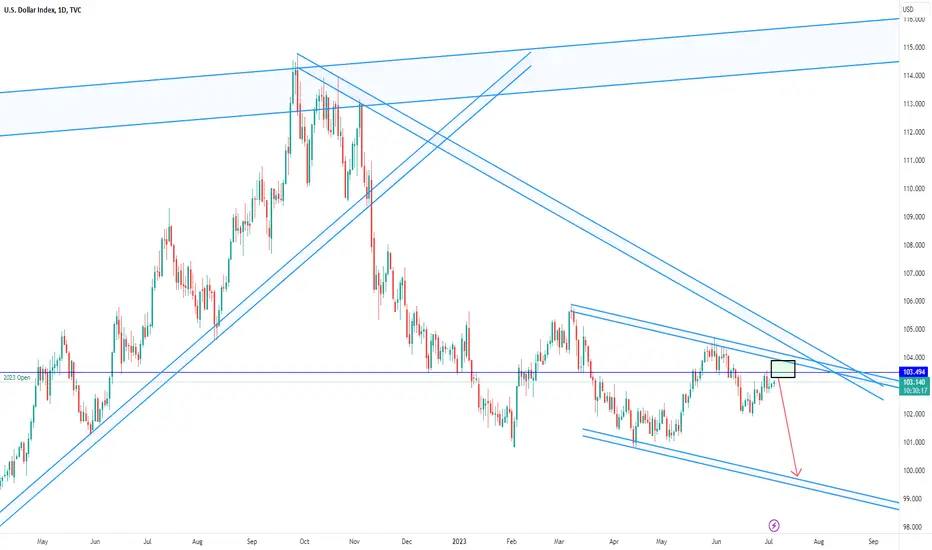
#DXY will continue lowerUSD index should continue lower July-August. USDX should then reverse higher.
DXY Analysis 4July2023This analysis is still the same as the last analysis, I am still bullish for this analysis. the price is currently at support, with several signs of rejection candles, there is a possibility of continuing the bullish trend again. if the price drops from support, there is a high probability that the price will retest the SnD area below.
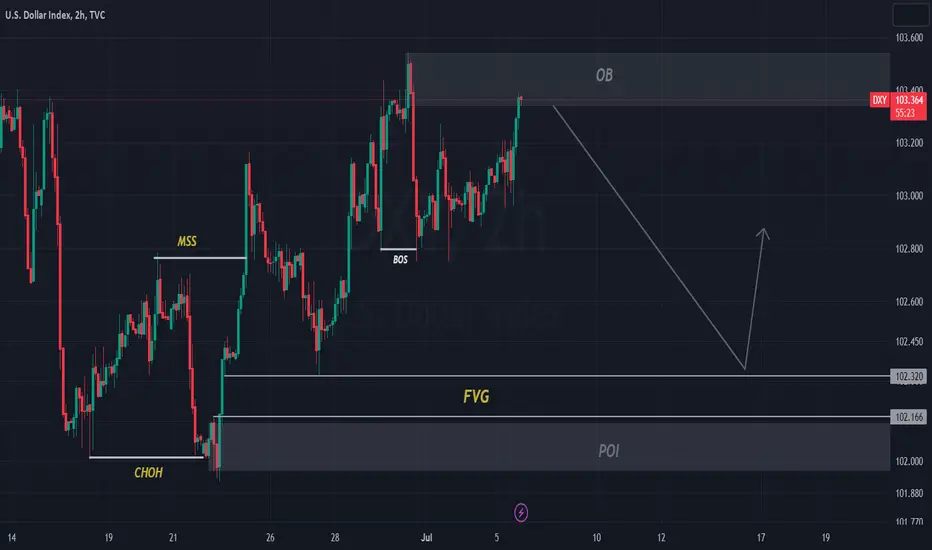
DXY Index Next Possible MovePair : DXY ( U.S Dollar ) Index
Description :
Bullish Channel as an Corrective Pattern in Long Time Frame
Completed " ABC " Corrective Wave
Divergence - RSI
Break of Structure
Impulse Correction
Fibonacci Level - 78.60%

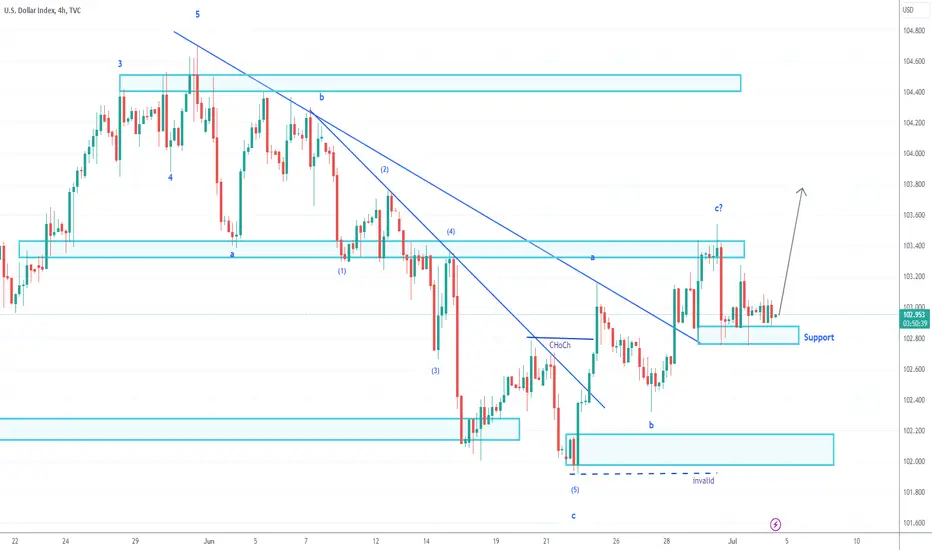
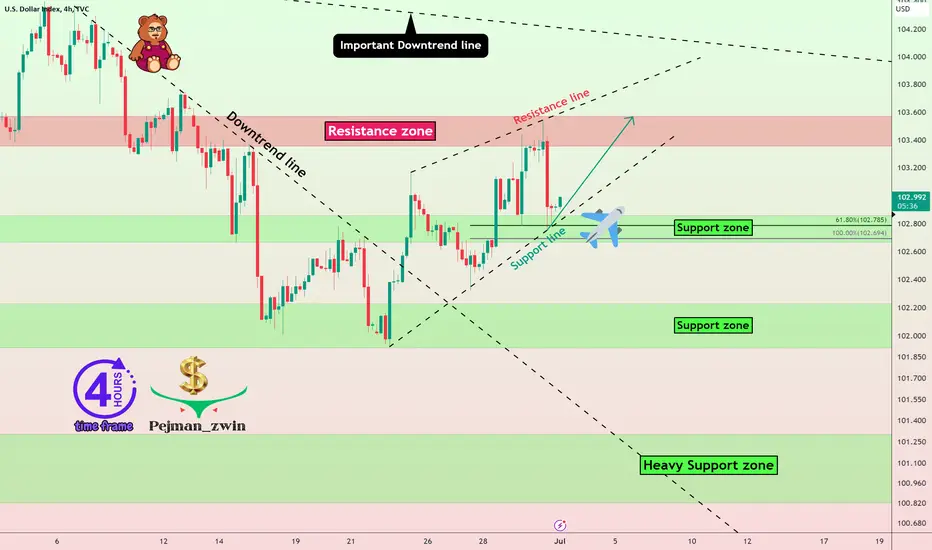
DXY ready to FLY again✈️DXY Index is moving near the 🟢 support zone($102.85-$102.66) 🟢 and support line.
In general, after the DXY succeeds in breaking the downtrend line , we should expect growth of the DXY .
I expect DXY to go ✈️ UP ✈️ again to at least the 🔴 resistance zone($103.57-$103.35) 🔴.
U.S.Dollar Currency Index ( DXYUSD ) Analyze, 4-hour time frame⏰.
Do not forget to put Stop loss for your positions (For every position you want to open).
Please follow your strategy, this is just my Idea, and I will be glad to see your ideas in this post.
Please do not forget the ✅' like '✅ button 🙏😊 & Share it with your friends; thanks, and Trade safe.
DeGRAM | Dollar Index long ideaDXY is in an ascending channel, making higher highs and higher closes.
If price pullbacks to support and the Fibo 50% level, most likely the market will go up.
We expect the trend to continue.
-------------------
Share your opinion in the comments and support the idea with like. Thanks for your support!

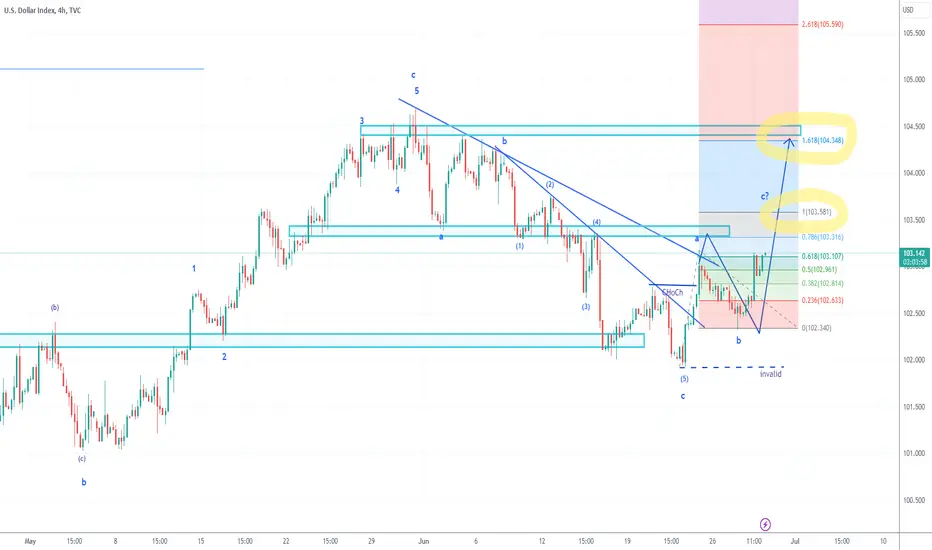
DXY 29June2023DXY analysis is still in accordance with the analysis some time ago, still in the a-b-c correction period. if we pull the fibo extension, from wave a to wave b, we can know the forecast of wave c will end.
fibo extension 1.618 is adjacent to the SnD H4 area. it could be that the price is heading in that direction.
DXYThis Is The Dollar Index On The 4 Hour Time Frame And This Is What I Anticipate To See, Ideally A Sweep Of The Sellside Liquidity Engineered Today Then A Bullish Confirmation On The M15 To Confirm Our Bullish Bias Then We Can See The Dollar Index Rallying To Take The Buyside Liquidity.

DXY DailyThis Is A Simple Anticipation I Have On The Dollar Index, It May Or Not Pan Out But We'll Wait And See, I'll Update You Guys As It Progresses.

DXY Index New Week Possible MovePair : DXY Index
Description :
Completed " 12345 " Impulsive Wave and " A " Corrective Wave
Demand Zone
Break of Structure
Bearish Channel as an Correction in STF
RSI - Divergence

DXY will go DOWN to the next support zoneThe DXY index managed to break the 🟢 support zone ($ 103.6-$ 103.35) 🟢 and has now completed its pullback.
Also, DXY seems to have broken the support line with a bearish marubozu candle , and this is a sign for DXY to start falling again, at least until the next 🟢 support zone ($ 102.86-$ 102.66) 🟢.
U.S.Dollar Currency Index ( DXYUSD ) Analyze, 2-hour time frame⏰.
Do not forget to put Stop loss for your positions (For every position you want to open).
Please follow your strategy, this is just my Idea, and I will be glad to see your ideas in this post.
Please do not forget the ✅' like '✅ button 🙏😊 & Share it with your friends; thanks, and Trade safe.

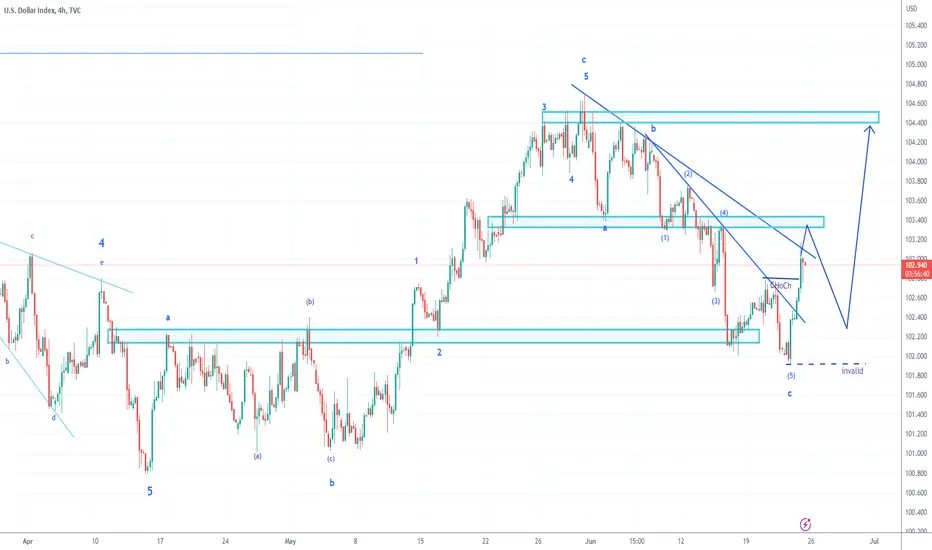
DXY 23June2023DXY's journey since the last analysis is still in accordance with the roadmap, now there is a change in the character of the trend. there is a possibility of reversal. the price has broken the trendline resistance and formed a new high.
Currently the price is moving close to SnD and is still held by the trendline, there is a possibility of a retrace. when the price drops but does not fall deeper than the invalid area, then the possibility is positive for bullish.
DXY Index Next Possible MovePair : DXY Index
Description :
Bullish Channel as an Correction in Short Time Frame with the Breakout of the Lower Trend Line and Retracement
Break of Structure
S / R Level
RSI - Divergence

DXY: The power of the economy!Mr. Biden revived the industry to compete with China, but this intervention could put the US economy and its allies at risk, according to the WSJ.
Jake Sullivan, President Joe Biden's national security adviser, is often preoccupied with foreign threats, such as the Ukraine conflict. But in April, in a speech at the Brookings Institution, he addressed the threat from within, of the long-held view of Washington elites that "the market has always allocated capital efficiently. and perfomance".
Some in policy circles call this view neoliberalism, or free trade, which has been bipartisan for decades. But Sullivan argues, this doctrine has emptied America's industrial base, weakened the middle class and made the country more vulnerable to climate change, Covid-19 and the weaponization of its supply chains. hostile countries.
To solve it, he said that the US needs a new approach, a "modern industrial strategy". Accordingly, the government supports stronger investment in industry and commerce to strengthen the middle class and national security.
Since the 2020 election, Mr. Biden has tried to come up with a unified theory for his economic policies. And Sullivan's recent remarks on the White House's domestic and foreign goals toward China have more clearly depicted what could be called "Bidenomics," with three pillars. With that comes some blind spots and contradictions in this economic policy, according to the WSJ.

DXY SHALL WE!!!Honestly, this move depends on the CPI data today and FOMC tomorrow
Still think no matter what we will be going back to 101