DXY US Dollar Bearish DivergenceThe US dollar is losing strength after getting rejected from the 2nd top. It also formed bearish divergence.
Currently, it is holding above the trend-line support and a breakdown below it, would be a bearish confirmation for it and if it gave a close above 2nd top then that would confirm more upside move in the price of the US dollar.
Dxyforecast

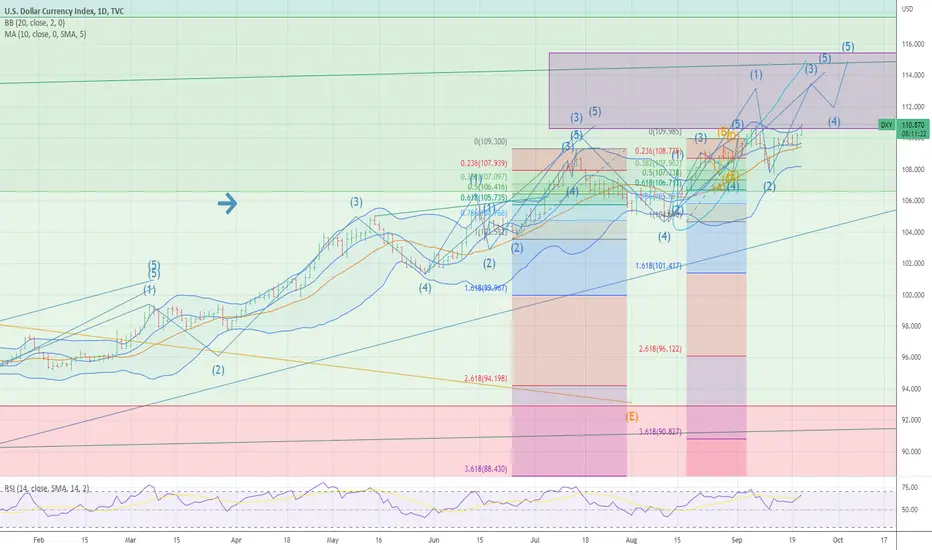
DXY Dollar Next Possible MoveTechnical Analysis Chart Update
DXY - Dollar
Time Frame - H1
According to the Elliot Wave it has completed the " 4th " impulsive wave and it will follow Buy Trend to complete its Impulsive waves " 12345 "
BULLISH CHANNEL in Short Time Frame #STF - H2
If it Rejects then XAUUSD , ABCUSD will Sell
If it Breaks then XAUUSD , ABCUSD will Buy

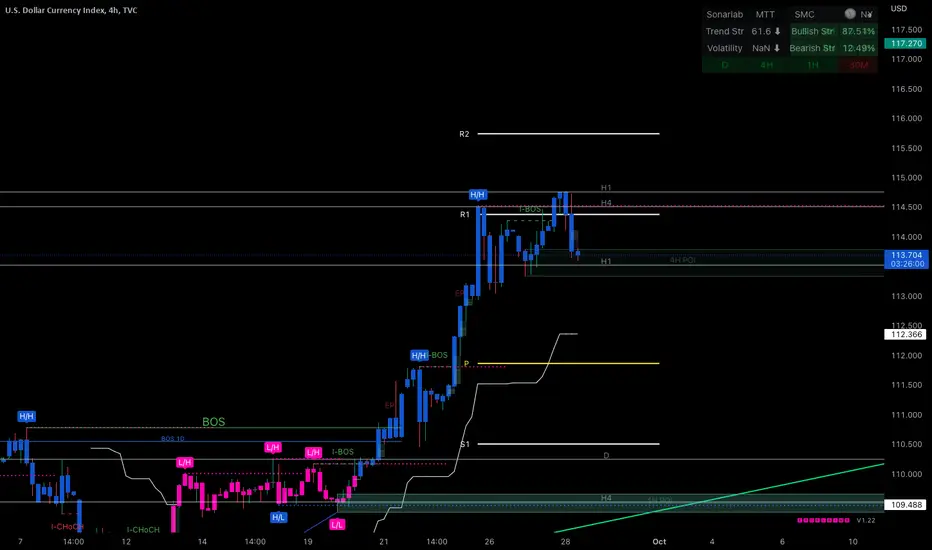
dxy where is the dollar going!we are at a very very key area right at this bullish order block on the 4hr dxy needed to pull back to in order for it to be the next leg up only if it holds of course but this is a area you want to watch if your trading and dxy pairs could be giving entries on a lot of pairs for a medium to long term swing
a break below this level can show bullish ness in dxy pairs but once again the trend is up so it has to show us bears are in control by break that green area which i dont see after a major pull back that size with no news
i would love to see the bulls take control soon but this is the 4hr so we have to wait for some more closes showing rejections at this level
[DXY] WHAT IS THE MARKETS SHOWING USdisplaying how dxy is controlling the markets at the moment anything that has to do with the dollar is at a key level just like the dollar so lets let the dollar show us the next move ..... trend continuation or a retrace we just be patient and wait for it to talk to us but be ready for the call
follow like subscribe all of that
any question dont hesitate to hmu on here
#dxy #dxyanalysis #dxyforecast #dxyanalysistoday #dxyexplained #dxymtp #dxymashup #dxyewanalysis #dxyprediction #dxyindex#xauusd #xauusdforecast #xauusdanalysis #xauusdlive #xauusdstrategy #xauusdpredictiontoday #xauusdanalysisthisweek #xauusdanalysistoday#nas100 #nas100tradingstrategy #nas100strategy #nas100scalpingstrategy #nas100scalping #us100 #nas100analysistoday #nas100forecast ##nas100

DXY top-down analysisHello traders, this is a complete multiple timeframe analysis of this pair. We see could find significant trading opportunities as per analysis upon price action confirmation we may take this trade. Smash the like button if you find value in this analysis and drop a comment if you have any questions or let me know which pair to cover in my next analysis.

DXY - Dollar Next MoveTechnical Analysis Chart Update
DXY - Dollar
Time Frame - H1
ELLIOT WAVES - " 123 " wave completed and making correction for 4th Wave
BULLISH CHANNEL in Long Time Frame #LTF
Symmetrical Triangle in Short Time Frame #STF

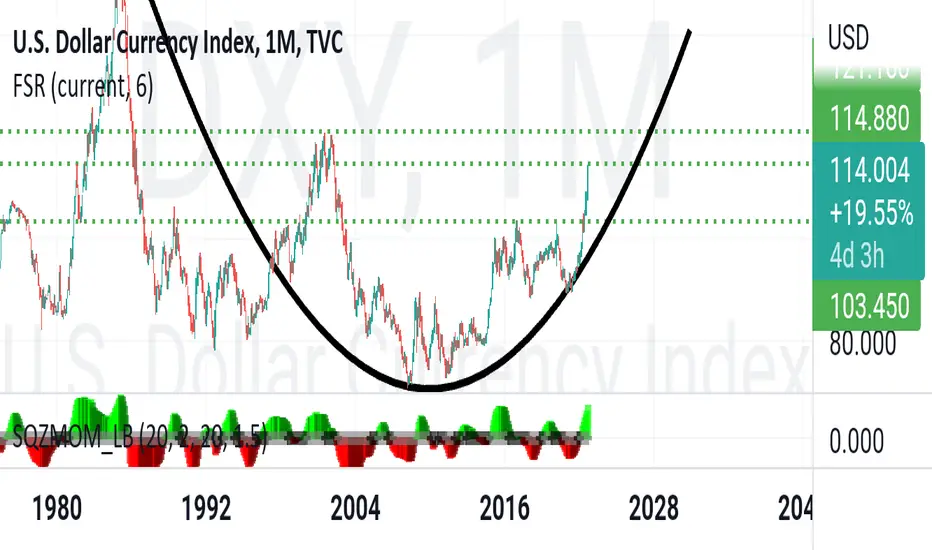
Is DXY making a cup an handle pattern?So as for now we can see DXY is probably making cup and handle pattern but its inside strong support/resistances which can indicates if yes or not.
We can also see that is looking for his supply which can be another clue about bullish trend in monthly chart.
Also can explain my other post about USDMXN which is about to pullback in H-C-H pattern.
Even above behavior already explained I saw in CRSI that for now overbought which makes me doubt a little bit, so I hope it is just a 4th Elliott's wave in lower timeframe.
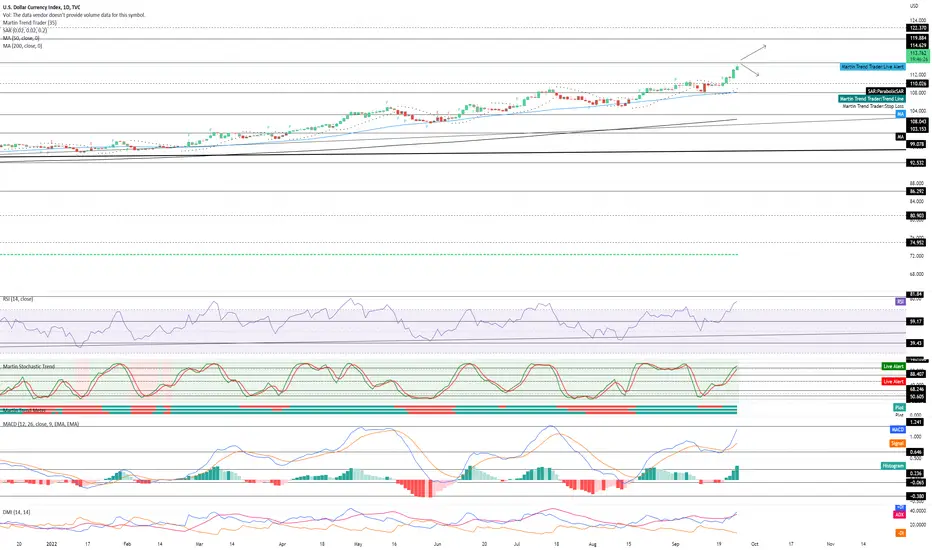
DXY Daily TA Cautiously BullishDXY daily guidance is cautiously bullish. Recommended ratio: 90% DXY, 10% Cash.
*Equity Futures, Agriculture, Metals and EURUSD are down to start the week while DXY, US Treasuries, Energy and Crypto are up. As long as the Federal Reserve's federal funds rate keeps going up and Russia keeps escalating the war in Ukraine, DXY will likely keep going up. Key Upcoming Dates: September US Consumer Confidence Index at 10am EST 09/27; August US New-Home Sales at 10am EST 09/27; Final US Q2 GDP revision at 830am EST 09/29; August US PCE price index at 830am EST 09/30.*
Price is currently trending up at ~$113.78 after briefly testing $114.62 resistance earlier in today's session. Parabolic SAR flips bearish at $108.84, this margin is mildly bearish at the moment. RSI is currently trending up at 77.21 and is beginning to form a soft peak as it approaches 81.84 resistance. Stochastic remains bullish and is currently trending up at 96 and is beginning to form a soft peak as it still technically tests 88.40 resistance. MACD remains bullish and is currently trending up at 1.16 as it approaches 1.24 resistance with no signs of peak formation. ADX is currently trending up at 35 as Price continues going higher, this is bullish.
If Price is able to break above $114.62 resistance then the next likely target is a retest of $119.88 resistance for the first time since January 2002. However, if Price is rejected here at $114.62 resistance, it will likely retest $110 minor support . Mental Stop Loss: (two consecutive closes below) $107.91.
Dollar index H4 more continue upsideDollar index H4 more continue upside are you ready for flying so becarefull

Why aren't we talking about this?The US dollar index continues to batter emerging markets and their economies whilst making all time highs. Why can't we all just accept BTC as a legal tender to trade and screw the dollar? Wake up peeps

Dollar index ready to fall are you readyDollar index ready to fall are you ready market break in the two demand zone we expect a market bearish move to start valid till invalidation level if break then continue uptrend start

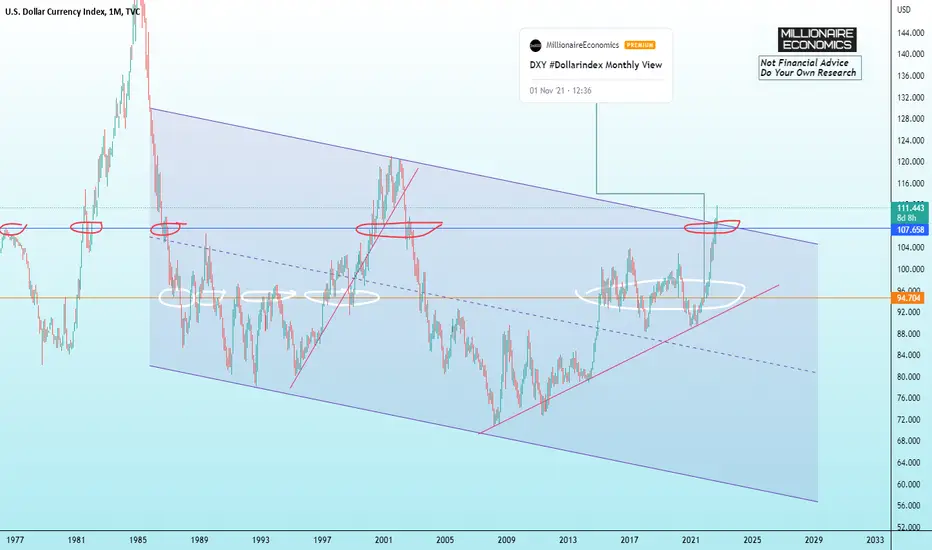
DXY Monthly Chart (Predicted in Nov 2021)The DXY (Dollar Index) is shown on a monthly chart. DXY has broken out of a very long term line of S/R (Support and Resistance). It may come back down to re-test the S/R line before heading higher.
It's interesting to see the parallel channel formation and the trend line it is walking on since 2008.
I have been calling for the DXY to start moving higher since November 2021.
What are your thoughts? Comment below and hit the like please. Thank you!
Disclosure: This is just my opinion and not any type of financial advice. I enjoy charting and discussing technical analysis. Don't trade based on my advice. Do your own research! #cryptopickk #bitcoin #altcoins
U S $ DXY 114 /115 next wave up has started move LONGThe chart posted is of the us $ I covered my short from 109.5 into the 108 area and now moving back to 75% net long HERE THIS MORNING 110.50 AS WE HAVE BROKE ABOVE FIB RES LOOK FOR A VERY SHARP MOVE UP into 112.60 /113/1 cycle peak is near oct 10th
DXY
Analysis of the DXY charts and other data also confirm the increase in interest rates and the strengthening of the dollar.
Follow, like, and ask if you have any questions
Caution today has important news so observe the money management .

Dxy- Stalling near hightsAfter the strong reversal from near the ascending trend line, DXY managed to get back above resistance, but the index is lacking conviction and is unable to continue.
Instead, DXY is stalling and is putting in Pin Bars on our daily chart.
This can be an indication that a correction could follow and a break back under resistance, now support would bring confirmation.
I've become slightly bearish on USD for now.
Wait and see is my approach on Usd pairs

DXY next moveAs my analysis before, I mentioned that DXY could started to bullish again from 107.9 and other asset are tanking.
This is my view of DXY for this week :
DXY is now in corrective move and could sweep the liquidity between 109-108 area before continue upwards
We will have FED % rate news release on 21th Wednesday with 75bps forecast
This news will decide the next DXY move.

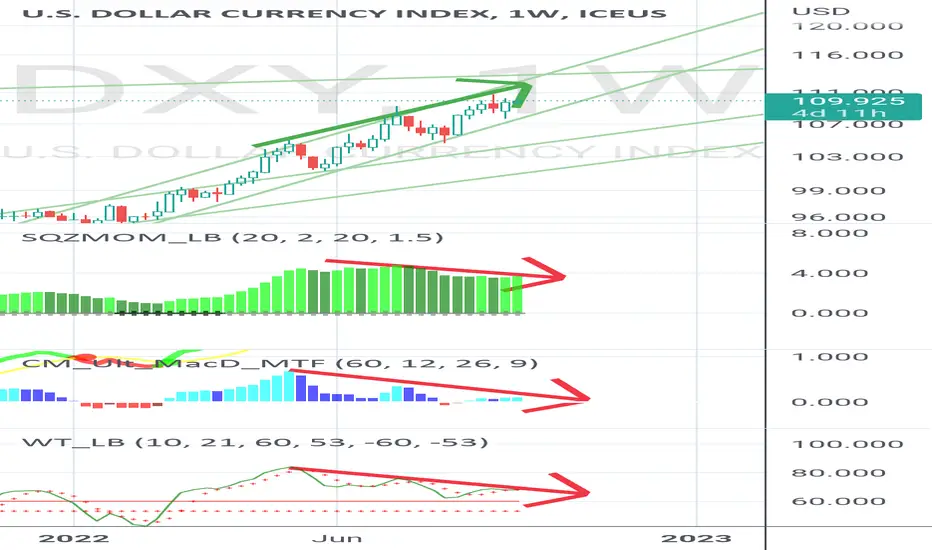
DXY bearish divergencesThe DXY is approaching a meaningful trend change! Don't be fooled by the Fed, the USD will soon reverse course no matter how much the federal reserve wants a strong dollar, the fiat currency seems to be approaching extreme overbought territory on the weekly chart on every momentum and price oscillator I could find. Be on the lookout for risk on assets to reverse course, crypto, stocks and precious metals will benefit from imminent DXY weakness.
Triple Top on the DXY? 109.9 (Opinion)No position was opened. If so, a pullback for its next move up is required. Crypto could be making its next move up. Correlations in TOTAL and the DXY are very noticeable right now.
A slight pull back could mean cryptos next leg up.

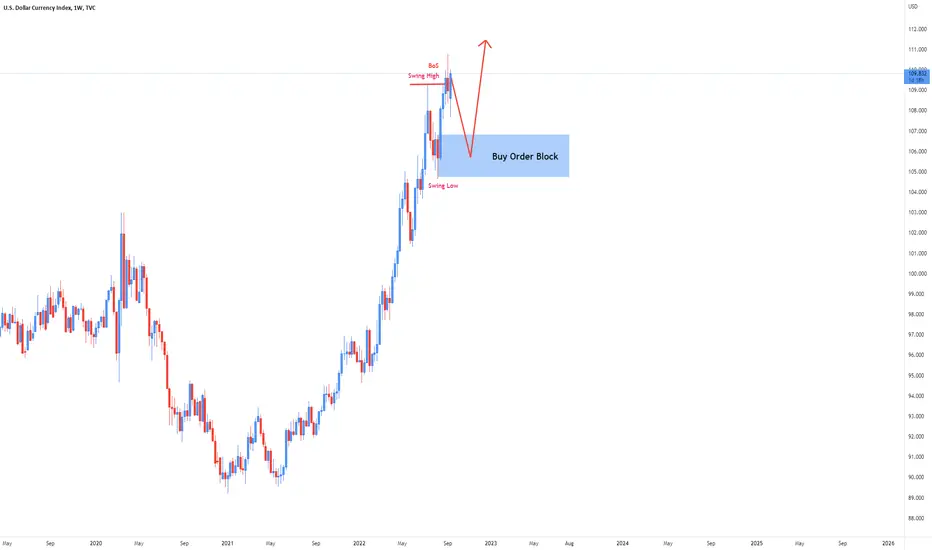
DXY Weekly PredictionHere is my view for DXY on W1. The price could go up, you can put a pending order on the Order block or find an entry on LTF within OB Zone. Trade Safe!
DXYVideo Analysis. Includes Crypto BTC targets.
Thinking we are in W5 now and will likely top around $112-$115 EOY.

20 Reason for Long DXYUpdate 07/09/2022
1 Structure 1/2: Bear
2 imbalances : Correction target marked
3 Current Move1/2 : Corrective
4 Entry TF : D1
4.1 ETF Structure: Bull
4.2 move : impulse
5 Support Resistance: Pull Back support waiting
6 FIB: waiting according to drawing for buy entry
7 candle Pattern: shrinking candles
8 Chart Pattern:
9 Volume : decrease correction now
10 Momentum: Bullish
11 Volatility : Divergence
12 strength: full favor of bulls
13 Sentiment : No1
14 Final Summary: go with Bull buys all signs are favor of buyer
15Buy /Sell/Wait : wait for buy
16 Entry:108.222
17 Sl: 107.555
18 Tp: 114.555
19 Risk to reward Ratio: 1:13
20 Excepted Duration : 45

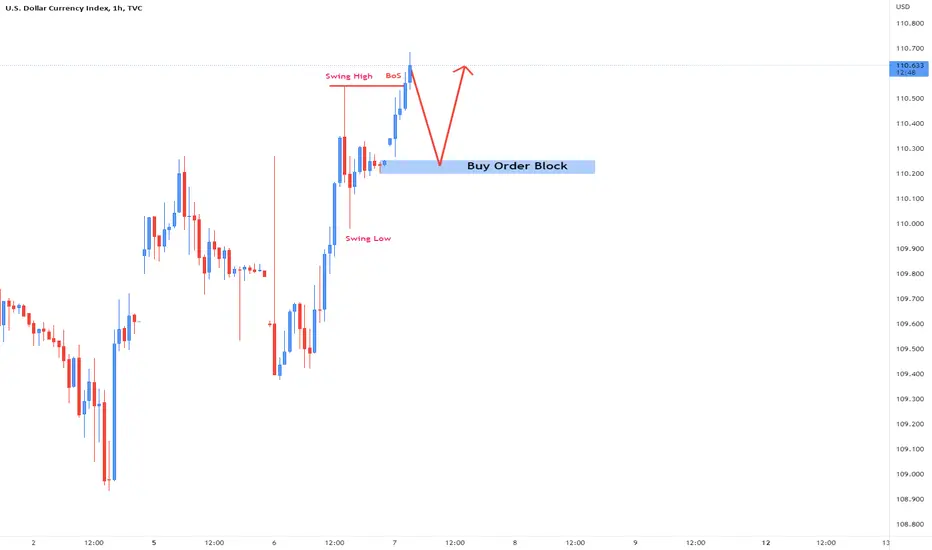
DXY Idea H1Here is my view for DXY on H1. The price could go up, you can put a pending order on the Order block or find an entry on LTF within OB Zone. Trade Safe!
DXY is on steroids 😂🤦♂️Dxy is moving in an uptrend channel for more than eight months so based on this channel I guess he will stop at 111.60 then it will start to fall to price level 108 then we can see if it's going to continue in this uptrend channel or will it fall.💵💰
Goodluck all If you like my idea like it and comment your opinion.
😊
