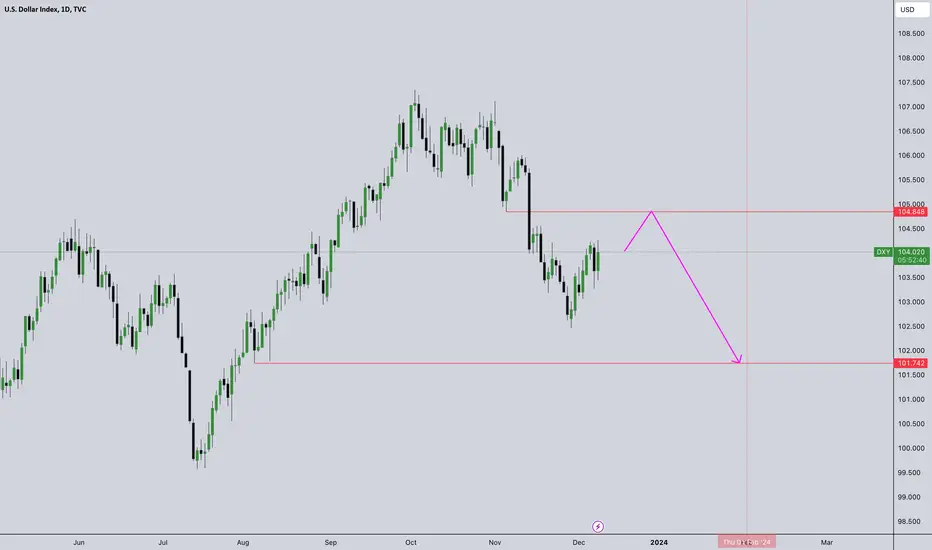
DXY Likely Scenario Given the time of the year, DXY is likely to keep a small range until FEb.
Possible 104.5 - 105.0 by December END.
Then Sells to begin the year toward 102 - 101.50
Not financial advice.
These are my opinions.
Dxyindex
USDX: Thoughts and Analysis Today's focus: USDX
Pattern – Continuation (Bullish)
Support – 103.65
Resistance – 103.96
Hi, traders; thanks for tuning in for today's update. Today, we are looking at USDX on the daily chart.
Today, we are asking if the USDX will set off on a new continuation higher after posting further bullish price action. The worry is if we don't see a close above resistance. This could set up a failed high, and if we don't see a break of resistance, this could set up a new extension lower.
Good trading.

DXY Dollar Index Technical Analysis and Trade IdeaOn the higher time frame, the DXY exhibits a bullish trend, characterized by recent retracement into the 50% level on the Fibonacci. As we delve into lower timeframes, our focus sharpens. Specifically, we are on the lookout for price to form a double bottom setup—a pattern that often signals a potential reversal. This setup involves a break below the previous range lows, followed by a robust rally and, subsequently, a formation of higher lows and highs.
Additionally, we pay close attention to the concept of retest and failure. If price retraces to a key support level and fails to hold, it can indicate a shift in market dynamics. In this case, we’re particularly interested in observing a retest and subsequent failure of a range at support.
However, it’s paramount to acknowledge the inherent risks associated with trading. Always conduct thorough research, considering both fundamental market drivers and the broader macroeconomic landscape. Combine this analysis with your technical insights. Furthermore, implement sound risk management strategies to safeguard your capital.
Disclaimer: This analysis provides a technical perspective on the U.S. Dollar Index (DXY) and should not be construed as investment advice. Tailor your trading decisions to your specific risk

DXY IndexPair : DXY Index
Description :
Rising Wedge as an Corrective Pattern in Short Time Frame with the Breakout of the Lower Trend Line and Retracement
Break of Structure
RSI - Divergence
Completed " 12345 " Impulsive Waves and " A " Corrective Wave


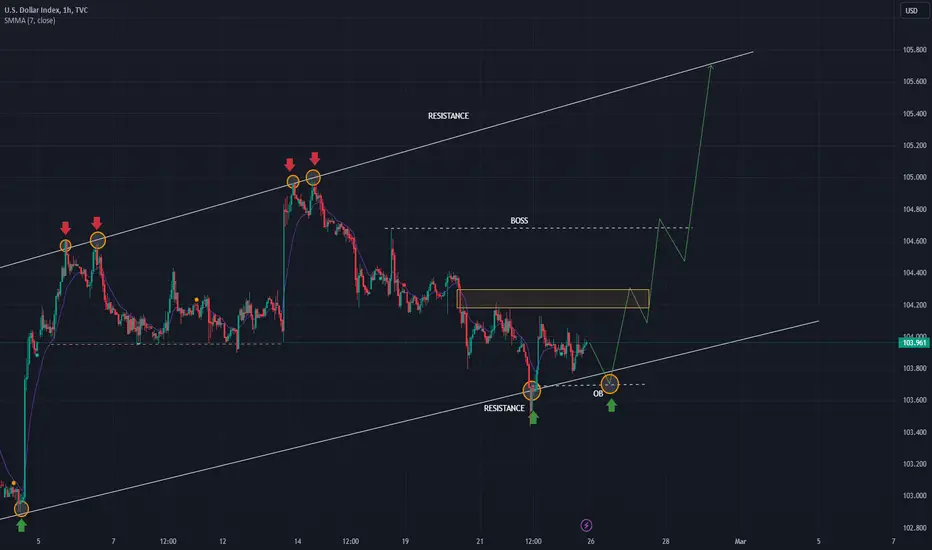
DXY H1 / BULLISH MARKET STRUCTURE SIGNAL => 📈✅ Hello Traders!
This is my idea related to the future movement of DXY H1. As we can see, the market is reacting from the resistance level, and at this moment, I'm looking for a bullish confirmation to execute a long entry. The perfect scenario would be to see a retracement until the OB that I mentioned and after that, to go bullish. In case of confirmation, I will execute this trade.
Traders, if my proposal resonates with you or if you hold a divergent viewpoint regarding this trade, feel free to share your thoughts in the comments. I welcome the opportunity to hear your perspectives.
____________________________________
Follow, like, and comment to see my content:
tradingview.sweetlogin.com
DXY BULLISH H & S SHAPE!! HELLO FRIENDS!!
As i can see DXY is creating a head and shoulder pattern this can be next move for DXY if US inflation data is good for $ Technically it is clear view for bull move till design levels friends it's just a trade idea we are looking forward for Ur thoughts in comment session it helps alote of other traders Stay Tuned for more updates.
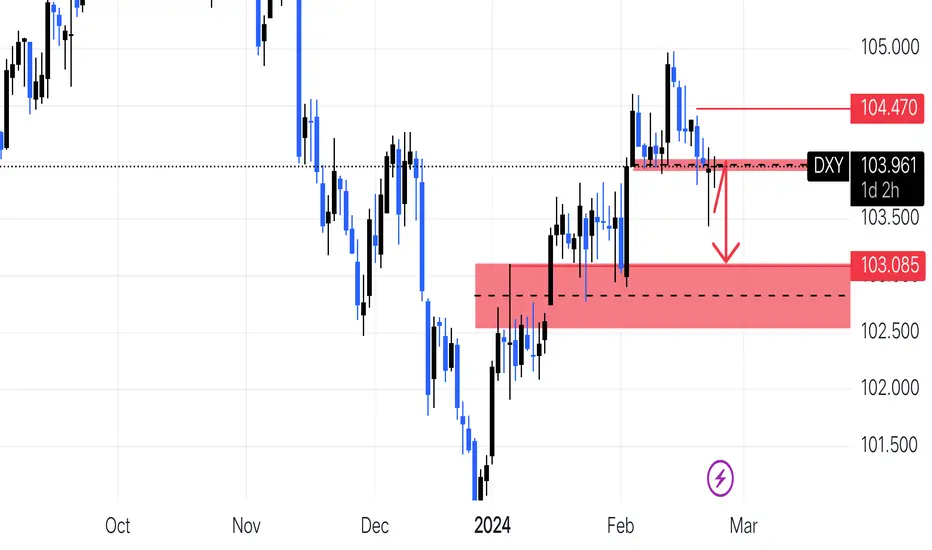
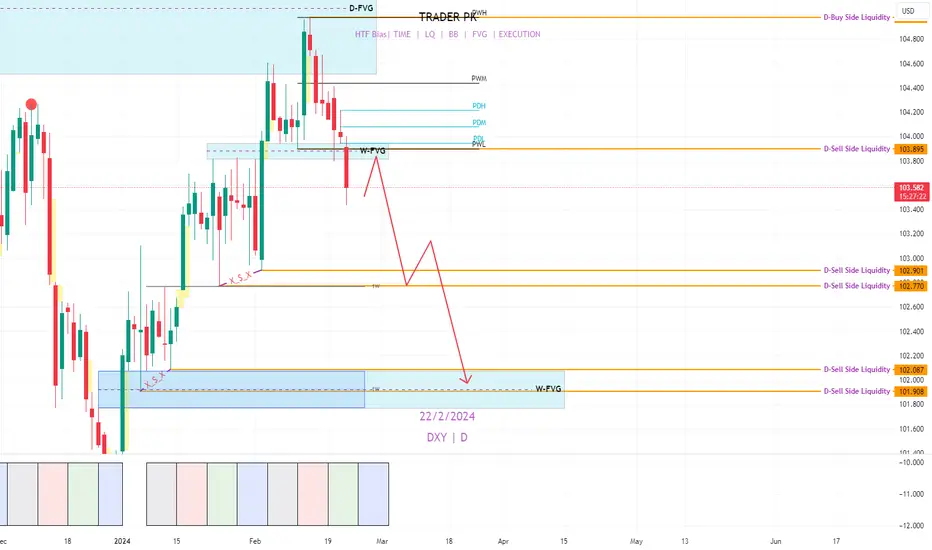
DXY Price analysis 22-Feb 2024Daily: In Daily TF, Bearish MSS has been Forming. If price closes above 103.785 Then we are going towards the D-SSL & LRLR-102.770 at least.
Daily Bias: Bearish.
In Hourly clearly bearish reversal has been confirmed.
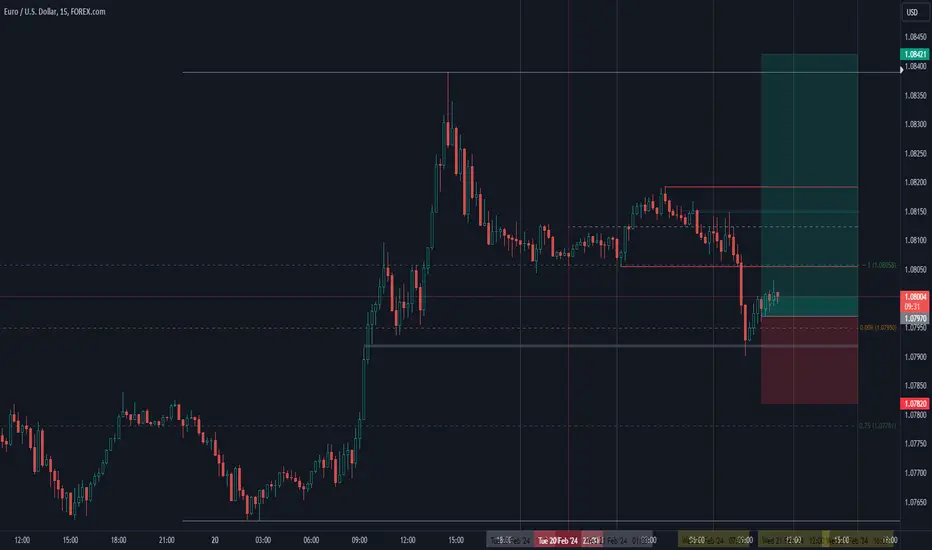
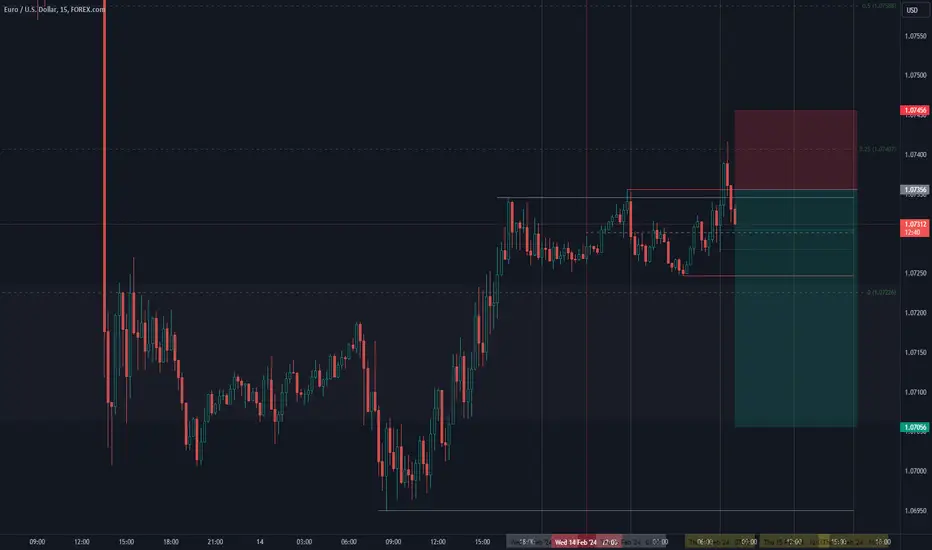
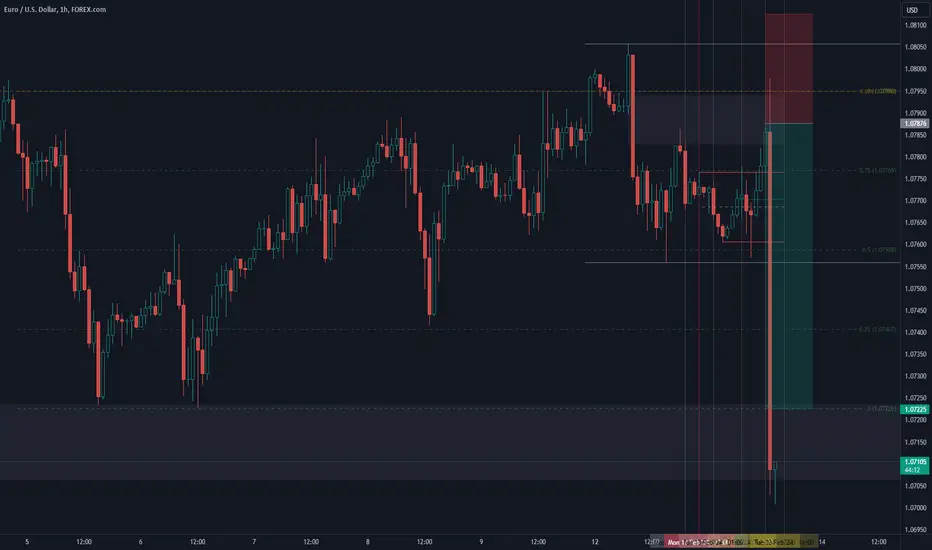
Long Trade Idea / EURUSD / 21st FEB 2024 - I want to see a bullish session targeting PDH.
- I believe this is manipulation under MOP
- London Judas swing.
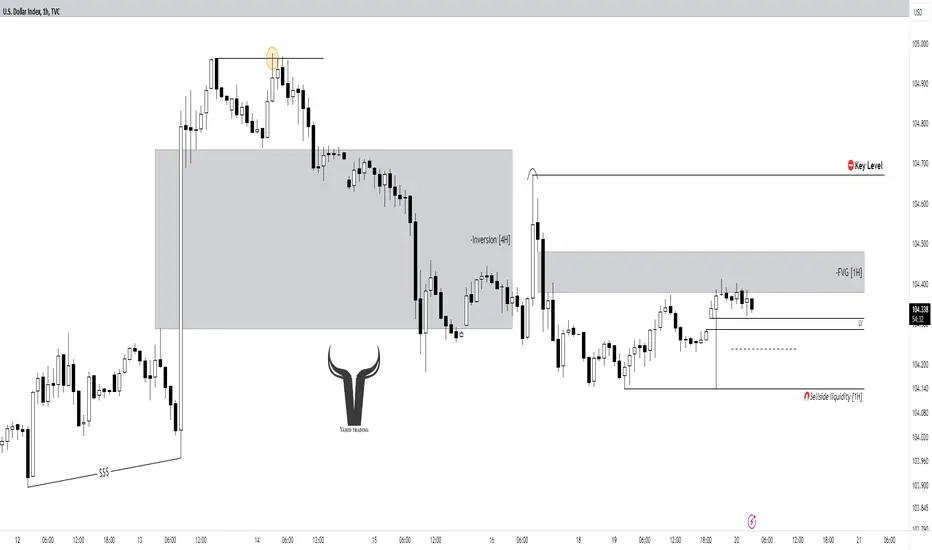
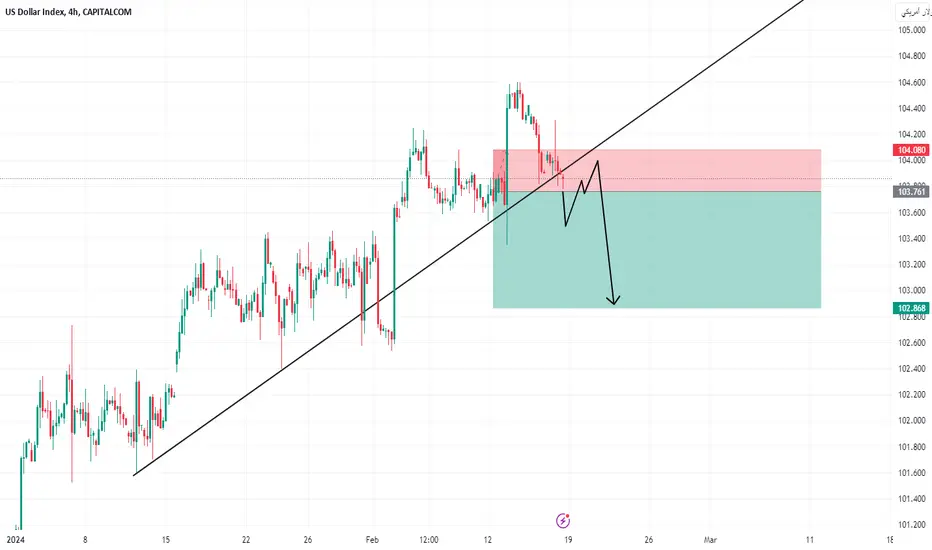
DXY(US Dollar),🔴Can grab the sell-side liquidity?🔴
As you can see the price consolidating for a while and we should see what happens next.
By looking at the chart, we can figure out the price created the sell-side liquidity that formed as equal lows that can be smart money targets. In that case, I don't want to see the price go higher than the key level (107.675).
In addition, there is the hourly bearish FVG that can keep the price and act as a resistance.
So if the price can close below the liquidity void (104.280), we can expect to see a lower price.
💡Wait for the update!
🗓️20/02/2024
🔎 DYOR
💌It is my honor to share your comments with me💌
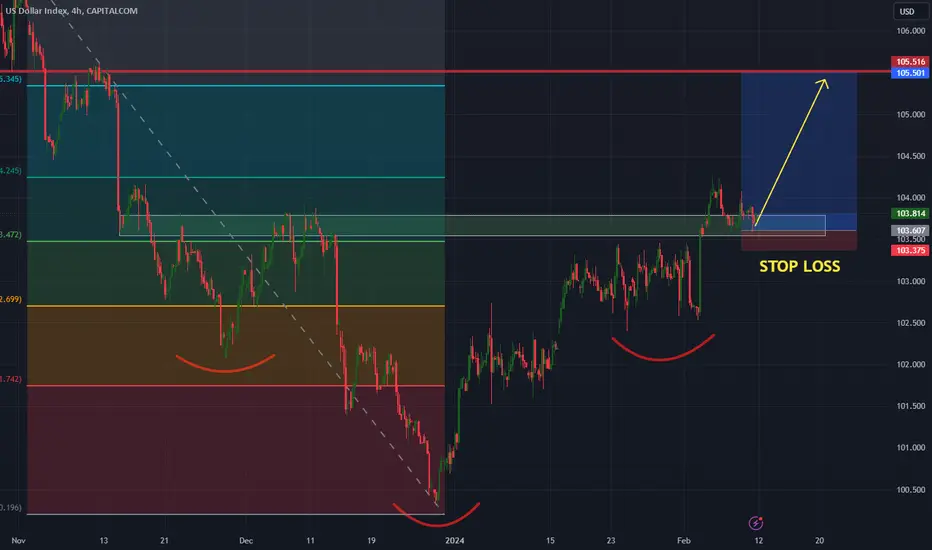
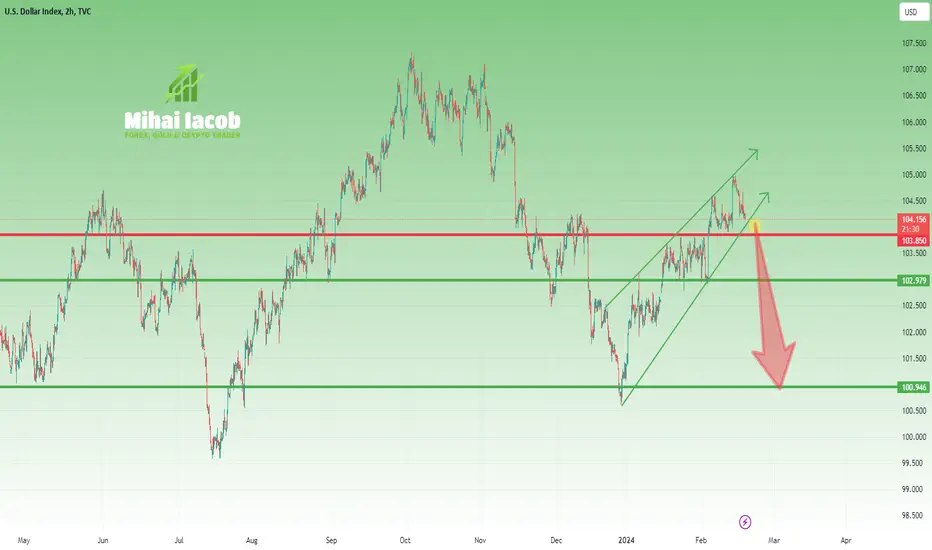
DXY at an important crossroadsSince the beginning of the year, the USD Index has risen 5% from its lowest point to its peak. However, trading USD pairs has proven to be quite challenging due to the choppy price action and significant volatility between support and resistance levels.
Upon analyzing the chart, the upward movement appears staggered and resembles a rising wedge pattern. This suggests that it may actually be a correction of the previous leg down from 107 to 100, indicating a potential impending decline.
Confirmation for this hypothesis lies around the 103.80-104 zone. If the price breaks below this level, we should pay close attention to the next support levels, including 103, 102, and the crucial psychological and technical support at 100.
DXY Technical Analysis and Trade IdeaTechnical Outlook:
- The DXY (US Dollar Index) maintains a bullish trajectory within its broader uptrend.
- Recent price action indicates a retracement to a significant daily (1D) support zone.
- This technical setup presents potential buy opportunities in line with the prevailing bullish bias.
Trade Suggestion:
- Entry: Consider long positions upon confirmation of bullish trend shifts on a lower time frame at the current support level.
- Targets: Aim for 105, 105.5, and 106 as price objectives.
- Stop-Loss: Strategically place stop-loss orders below the immediate support to manage risk.
Important Disclaimer:
This analysis reflects my individual market assessment for informational purposes. It does not constitute explicit financial advice. Independent research and comprehensive risk management are crucial before executing any trades.

SHORT IDEA 3RR / EURUSD / 15th FEB 2024- I believe the price will present a bearish session.
- Price has performed so far a London Judas Swing.
- Price has made the initial high at 25% of the PWR.
- Asia’s RELs are my first target.
- PDL is my target for the day.
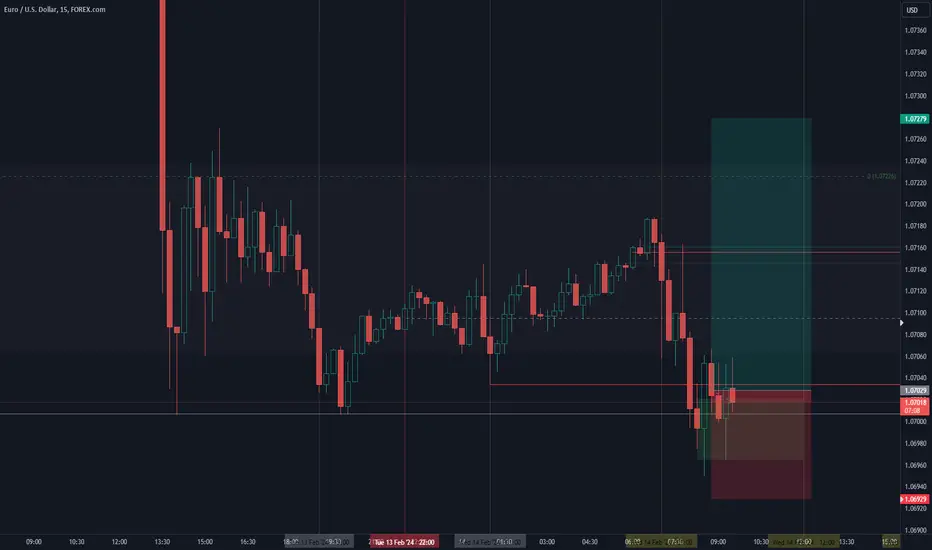
EURUSD Trade Idea / 14th FEB 2024- I want to see a bullish session if the price finds support at Asia’s equilibrium.
- Price is within the monthly FVG, may use this as an IFVG to rebalance CPI’s range.
- 25% of the PDR is my target.
ONLY IF THE PRICE FINDS SUPPORT AT ASIA'S EQUILIBRIUM!
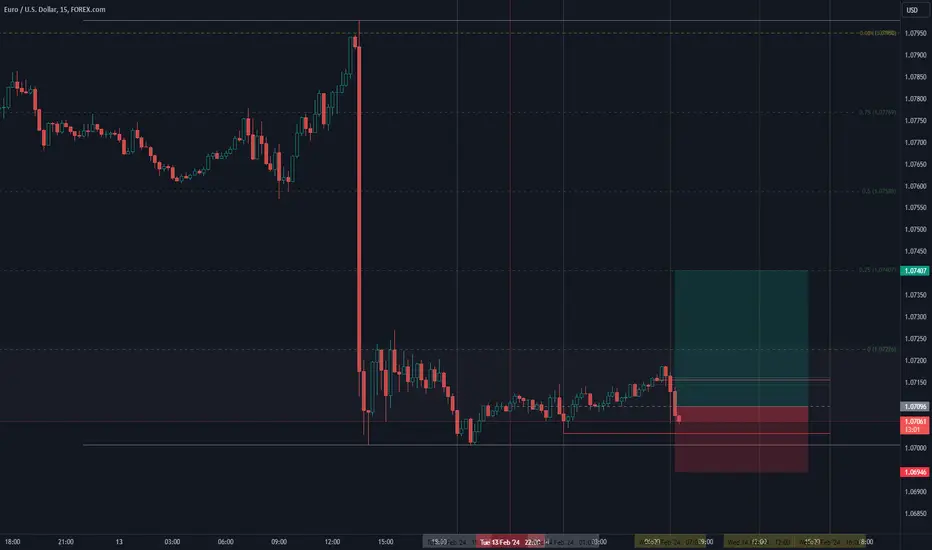
CPI SHORT EURUSD / 13th Feb 2024 The directional bias was perfect.
The price traded to the monthly FVG as expected
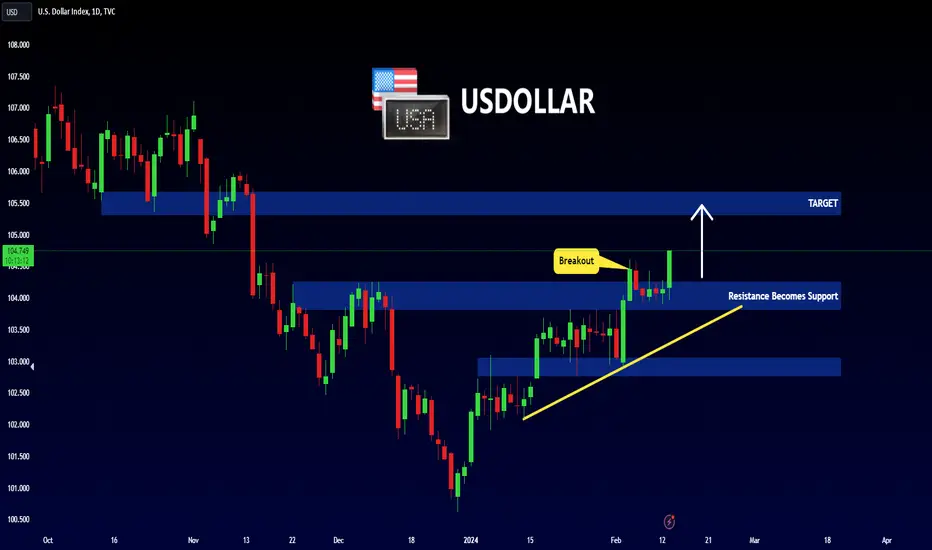
DXY - BULLISH MOVE 📈Hello Traders !
On The Daily Time Frame, The US Dollar Index Price Broke The Resistance Level (103.817 - 104.262).
This Key Level Becomes a New Support Level.
So, I Expect a Bullish Move.
-------
TARGET: 105.320🎯
DXY Dollar Index Technical Analysis and Trade IdeaThe #DXY is currently exhibiting range-bound behavior within a broader bullish trend on higher timeframes. While the overall bias remains positive, current price action does not present a compelling entry point for a long position. My strategy involves two potential scenarios:
1: Breakdown Scenario: A break below the current range support would provide a discounted long entry opportunity.
2: Breakout and Retest Scenario: A decisive break above the range high, followed by a retest and failure of that level as new resistance, would signal a potential long entry.
Key Technical Considerations:
- Trend Analysis: The higher timeframe bullish trend offers context for potential long setups.
- Market Structure: Understanding the current range structure guides entry and exit points.
- Price Action: Closely monitor price behavior around key support and resistance levels for trade signals.
Disclaimer: This analysis is strictly educational and does not constitute financial advice. Always conduct your own independent research and thoroughly evaluate your risk appetite before executing any trades.

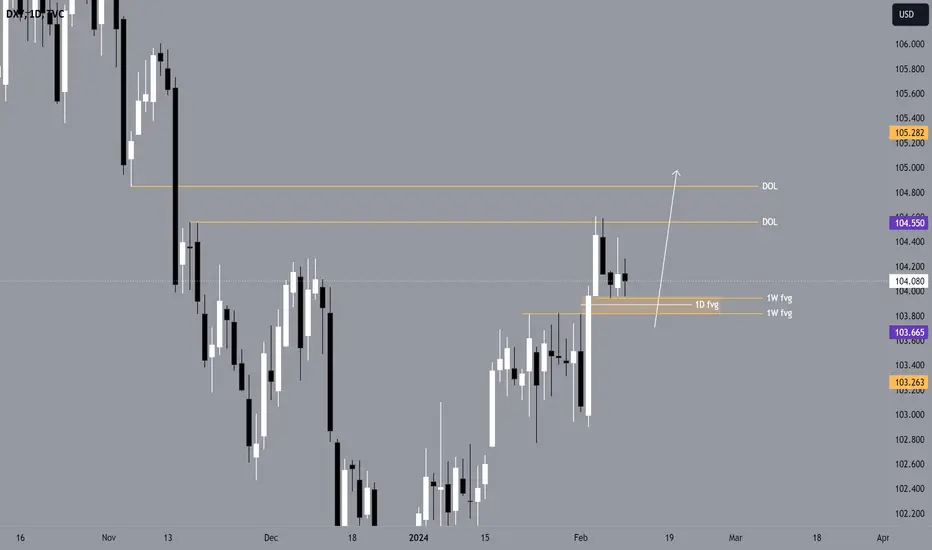
Dollar to the moonWeekly outlook
Bullish on TVC:DXY : 1W +fvg, 1D +fvg, h4 +brkr
Bearish on NASDAQ:EU : 1W -fvg, 1D -ob, h4 -brkr
Focus is on MIL:EURO shorts since FX:EURGBP is bearish overall.
Won't trade Monday. Focus is on Tuesday post #cpi, Wednesday all day and Thursday NY.
#trading $forex
DXY IndexPair : DXY Index
Description :
ELLIOT WAVES - " 12345 " Impulsive Waves and " AB " Corrective Waves Completed
Retracement for BREAK OF STRUCTURE
BEARISH CHANNEL as an Corrective Pattern in Short Time Frame with the Breakout of the Upper Trend Line and Retracement
FIBONACCI LEVEL - 61.80%
Divergence in RSI

DXY 103.523 +0.06% LONG IDEA MTF BREAKDOWN 🐮🐮📌HELLO TRADERS
Hope everyone is doing great 🛑
A look at DXY ahead of the WEEK 📌
DXY WEEKLY TF
* Bulish sentiment still in play on the weekly TF
* Violated the bearish FVG
* Tested and rejected from this PD ARRAY
* POSIBLE BULLISH CLOSE FOR OUR WEEK
DXY D TF
* Looking at DXY from the DAILY TF we see a break BELOW (SSL) which are Monday lows.
* Swept SSL but traded back into the range with some bullish momentum.
* If we see momentum back into the range i would be looking for long.
* Looking for long on the DXY because we do not have a bearish body closure.
* & we are still in an indecisive state, in wick city as well.
DXY 4H TF
* On the 4h alike, indecisive momentum in play.
* Retracement into some of the internal LIQUIDITY .
* looking for some retracement into PD ARRAYS ( FVG + OB & balance price range)
* & should they hold looking for continuations with the bulls.
* Violation of the FVG signals bullish momentum and some confirmations
DXY 1H TF
* Monday LOWS taken.
* Possibly signaling a bullish week ahead.
* might see a SEEK & DESTROY PROFILE
1. IRL - ERL
2.Looking for LQ RUNS.
HOPE YOU ENJOYED THIS OUT LOOK, SHARE YOURS BELOW🛑
lets see how it goes.
IF THIS IDEA ASSISTS IN ANY OR IF YOU LIKE THIS ONE
SMASH THAT LIKE BUTTON & LEAVE A COMMENT.
ALWAYS APPRECIATED
____________________________________________________________________________________________________________________
* Kindly follow your entry rules on entries & stops. |* Some of The idea's may be predictive yet are not financial advice or signals. | *Trading plans can change at anytime reactive to the market. | * Many stars must align with the plan before executing the trade, kindly follow your rules & RISK MANAGEMENT.
_____________________________________________________________________________________________________________________
| * ENTRY & SL -KINDLY FOLLOW YOUR RULES | * RISK-MANAGEMENT | *PERIOD - I TAKE MY TRADES ON A INTRA DAY SESSIONS BASIS THIS IS NOT FINACIAL ADVICE TO EXCECUTE ❤
LOVELY TRADING WEEK TO YOU!
