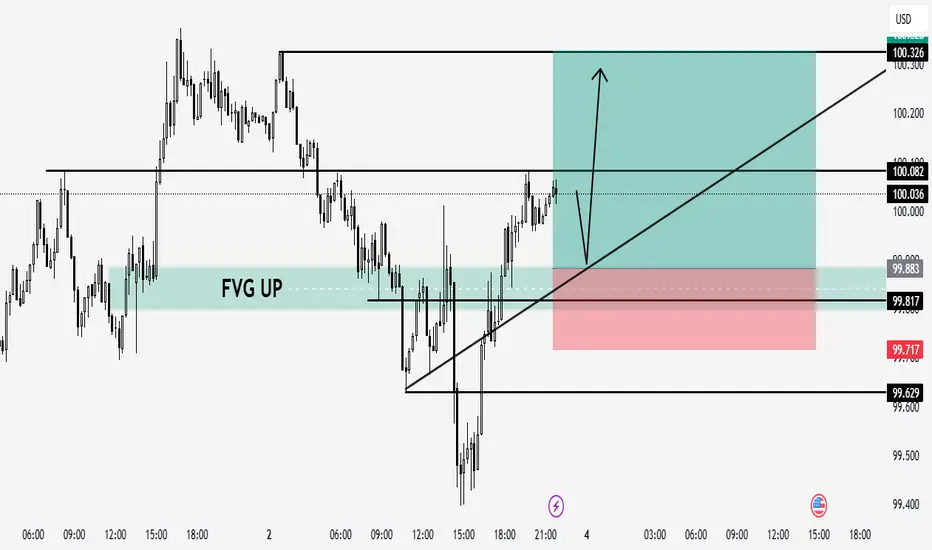
DXY (US Dollar Index) – Bullish Setup📊 DXY (US Dollar Index) – Bullish Setup from FVG & Trendline Confluence
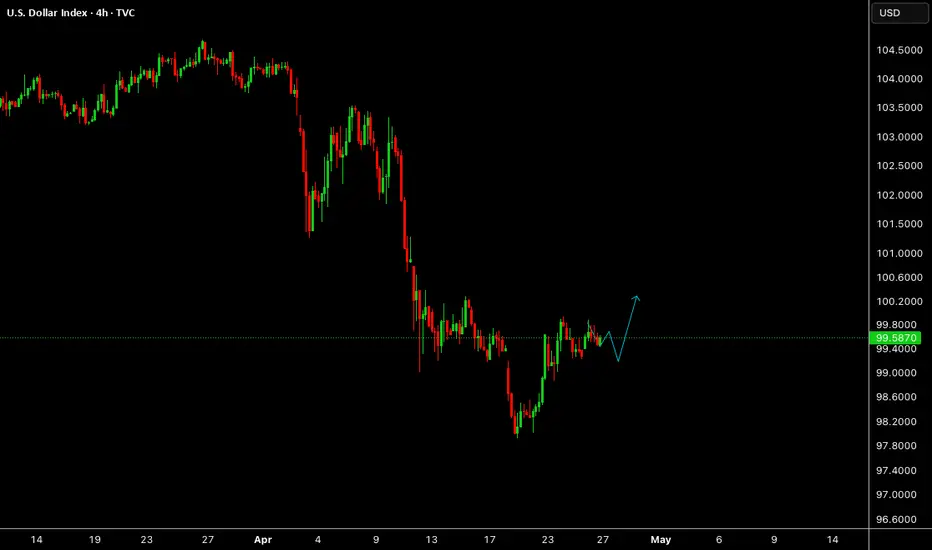
Price tapped into a well-defined Fair Value Gap (FVG UP) aligning with bullish trendline support. I'm anticipating a small retracement toward the 99.88–99.81 area before continuation upward.
📍 Entry Zone: 99.88 – 99.81 (FVG + Trendline)
🛑 Stop Loss: 99.71
🎯 Target (TP): 100.32
📐 RR: Approx. 1:3
Confluences:
Bullish market structure
FVG filled & respected
Ascending trendline support
Liquidity taken below previous lows
🔔 Watching for bullish reaction after the minor pullback for confirmation.
Dxyindex
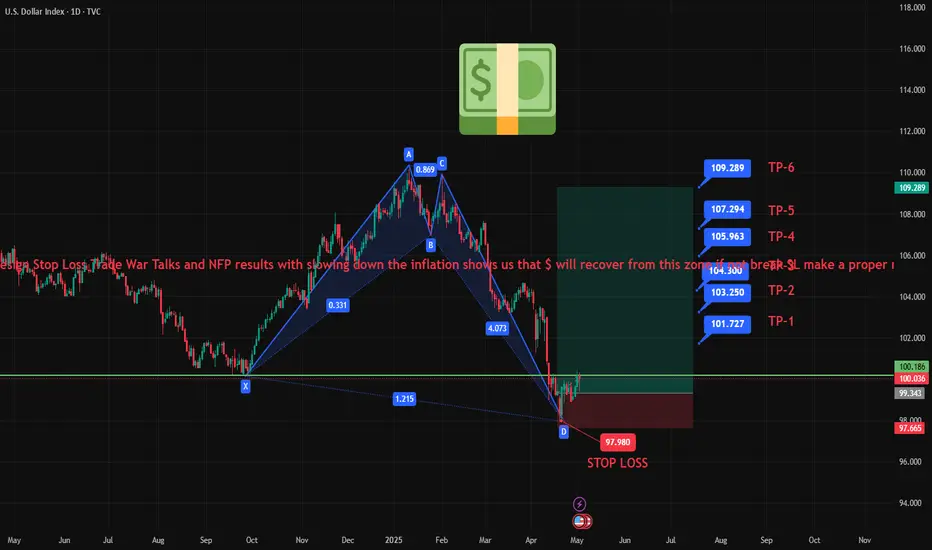
US INDEX (DXY) TIME TO BUY !!!HELLO TRADERS
As i can see this chart created a harmonic pattren and it crystal clear showing the levels till it hold above our design Stop Loss Trade War Talks and NFP results with slowing down the inflation shows us that $ will recover from this zone if not break SL make a proper research befor taking any trade we appriciate your cooments and support us Stay Tuned for more updates ...
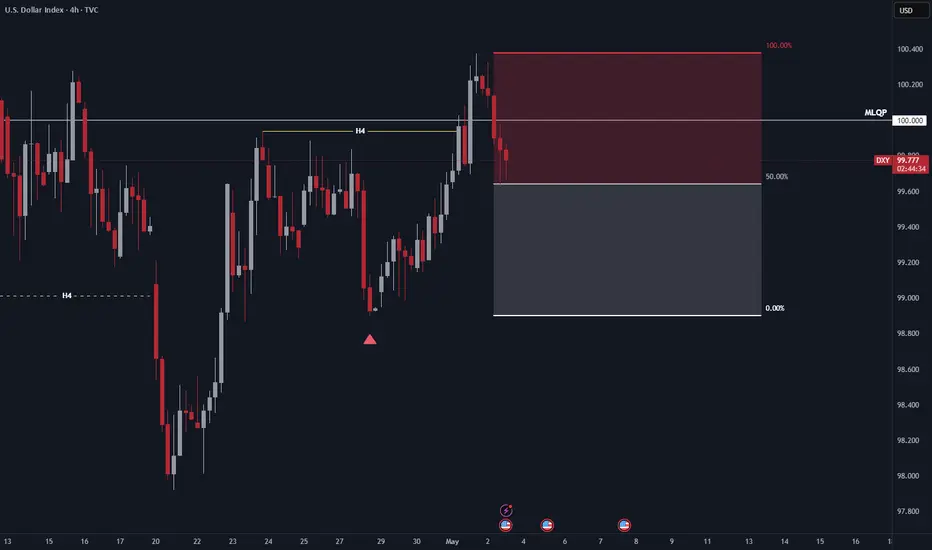
NFP Analysis: More Bullish Order Flow?The Dollar has broken structure to the upside and is now pulling back into equilibrium. From this discounted level, I'm looking to capitalise on any valid bullish setups, as break-of-structure moves often lead to continuation towards previous highs.
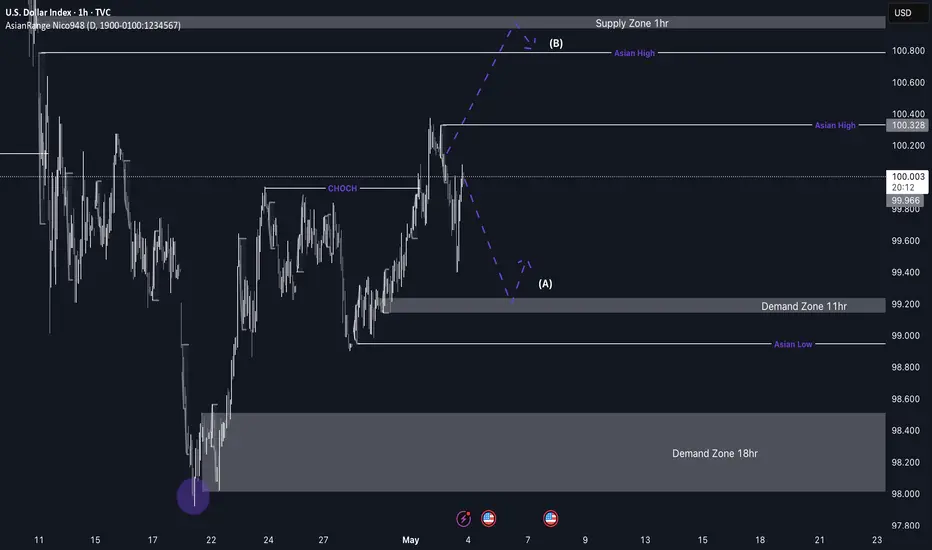
DXY (Dollar index) Shorts from 1hr supply zone My general outlook on the DXY this week leans bearish, as I expect price to continue trending lower. I’ve identified a nearby 1H supply zone, where we could see price react and begin pushing lower. There is also a larger supply zone further above, but it’s currently out of reach unless price pulls back significantly.
Looking back, the 2-day demand zone I marked over a week ago has played out well, with a strong bullish reaction from that level — price is still rising from that zone. During this move, a new 11H demand zone has formed, which also led to a change of character to the upside. If price revisits that zone, we may see another bullish continuation from there.
Key Points:
Overall bearish trend expected to continue in the short term.
1H supply zone nearby is a potential trigger point for a sell-off.
2D demand zone previously marked is still holding and influencing price.
11H demand zone has caused a bullish shift and could provide another long opportunity if price returns.
P.S. This is my general DXY outlook for the week. I don’t trade the dollar directly, but I use it as a key confluence when analysing and executing trades across other major pairs.
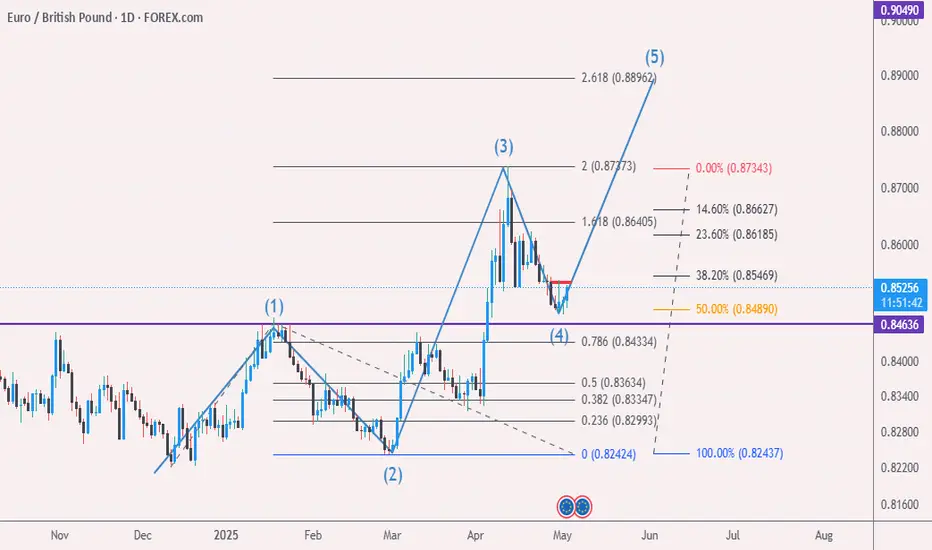
Eur/Gbp Elliott wave May/02 hello eveyone...
as you can see it seems wave 4 completed ( Holding 50% ) and wave 5 can start....
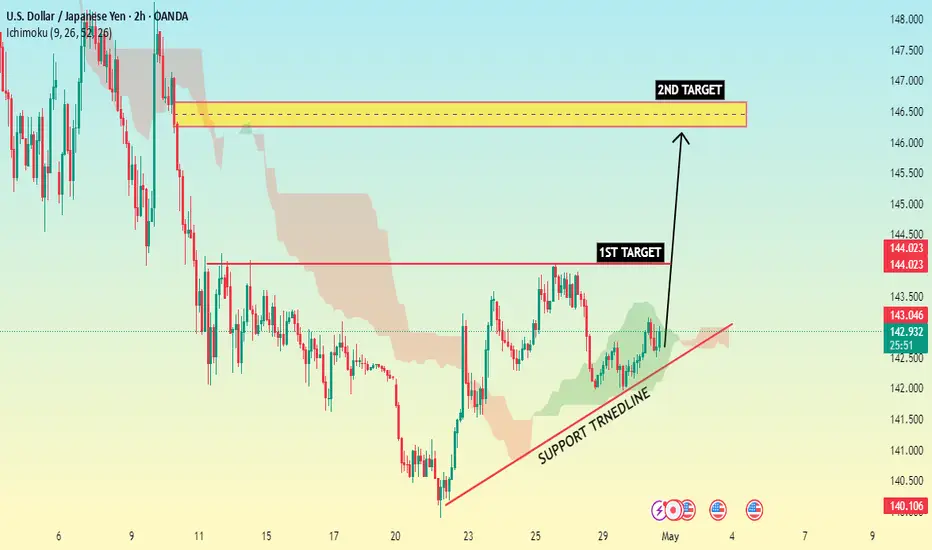
USD/JPY Bullish Setup with Ascending Trend line This is a 2-hour chart of USD/JPY showing a bullish setup. The price is currently respecting an ascending support trend line, indicating potential upward momentum. There are two marked resistance levels: the first target around 144 . and the second target near the 146.00– 146.50 zone . The chart suggests a bullish continuation if the price breaks above the first target zone, with the second target acting as a stronger resistance area. Ichimoku cloud support below the price also reinforces the bullish bias.
DXY Forecast: More Bearish OrderflowThis week, I anticipate further downside movement on the DXY, with price potentially reaching a key area of interest—a bullish order block. While the reaction at this level remains uncertain, my current bias remains bearish unless a break of structure to the upside signals a continuation of the bullish trend.

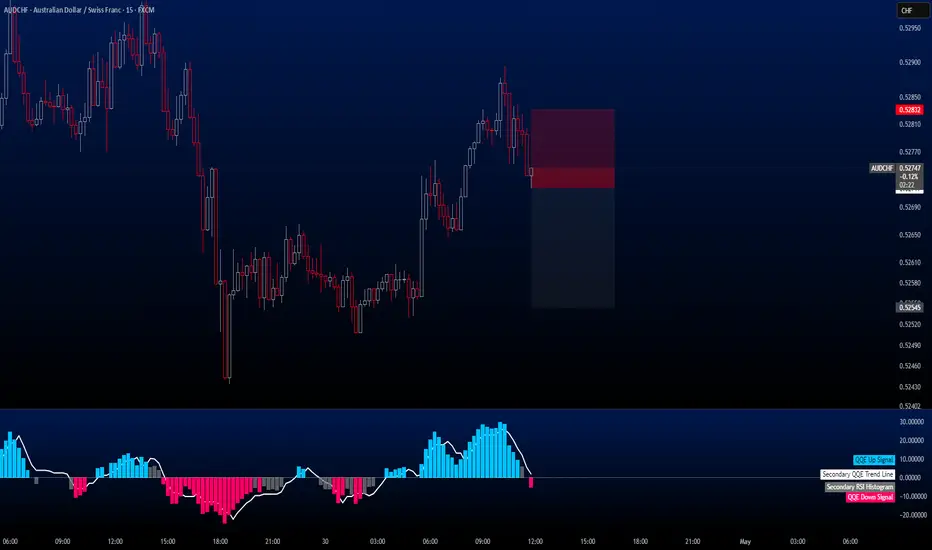
AUDCHF m15 SellLet the final trade of the day come from AUDCHF.
I expect the pair to decline first to 0.52545 and then towards 0.52419 / SL 0,52861.
Adjust your risk accordingly and activate the trade.
Wishing everyone a profitable day!
📊 Don’t forget — I share these trade ideas daily on my TradingView profile. Follow me there for full analysis and daily setups.
🔔 I post detailed trade ideas and daily market analysis like this every day on my TradingView profile.
👉 Follow me to get notified and read the full breakdowns.
NZDCHF m15 BuyHello everyone.
There's a perfect buy opportunity on NZDCHF right now.
You can even set your RRR to 1:4, but those who prefer a shorter target can close at RRR 1:2.
I expect the pair to reach the 0.49225 level during the day.
Wishing everyone profitable trades!
🔔 I post detailed trade ideas and daily market analysis like this every day on my TradingView profile.
👉 Follow me to get notified and read the full breakdowns.

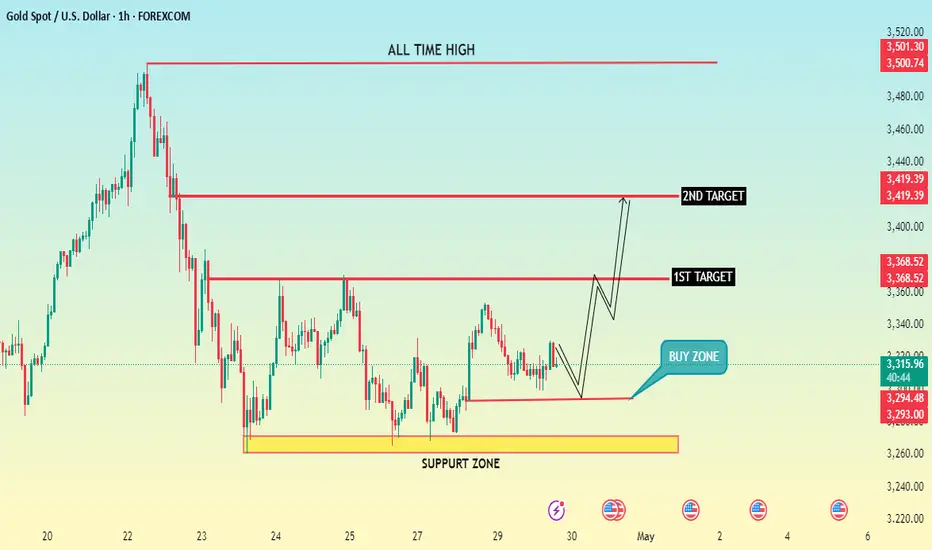
Gold Spot (XAU/USD) Bullish Setup: Buy Zone to Target Levels Gold Spot (XAU/USD) on the 1-hour timeframe. Key points:
Support Zone: Strong support is identified in the yellow zone around 3,290–3,293, where price has bounced multiple times.
Buy Zone: Market is currently in a potential buy zone just above support, signaling a possible long entry.
Targets:
1st target: Around 3,368
2nd target: Around 3,419
All-Time High: Marked as a potential long-term resistance above 3,500.
Outlook: If price respects the support and buy zone, the market may rally toward the 1st and 2nd targets. Watch for bullish confirmation before entering.
DXY Dxy has some more upside, let the market go above 100 and then we will see the reaction.
Disclosure: We are part of Trade Nation's Influencer program and receive a monthly fee for using their TradingView charts in our analysis.
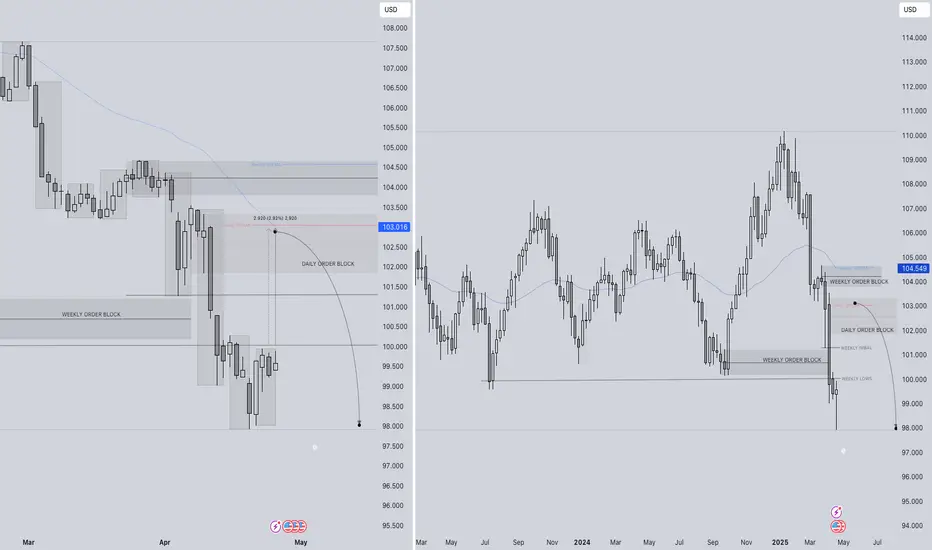
DXY USD INDEX FORECAST Q2 W18 Y25DXY USD INDEX FORECAST Q2 W18 Y25
Professional Risk Managers👋
Welcome back to another FRGNT chart update📈
Diving into some Forex setups using predominantly higher time frame order blocks alongside confirmation breaks of structure.
✅ U.S. dollar index is a measure of the value of the dollar against a basket of six foreign currencies.
✅The currencies are the Euro, Swiss franc, Japanese yen, Canadian dollar, British pound, and Swedish krona.
💡Here are some trade confluences📝
✅ Break an d close below July 2023 key 100.00 levels.
✅ Foresee a pull back to, weekly imbalance, daily order block, daily 50ema, weekly order block and or weekly 50 ema.
✅ Awaiting to identify a significant break of structure bullish to use the DXY as confluence for our trading week 18 of Q2 toward key points of interest mentioned above.
✅ Forecasting continued bearish pressure long term.
✅Initially bullish outlook however upon price turn around. DXY to break 100.000 level again.
🔑 Remember, to participate in trading comes always with a degree of risk, therefore as professional risk managers it remains vital that we stick to our risk management plan as well as our trading strategies.
Pairs to look out for -
EURUSD
USDCHF
USDJPY
USDCAD
GBPUSD
📈The rest, we leave to the balance of probabilities.
💡Fail to plan. Plan to fail.
🏆It has always been that simple.
❤️Good luck with your trading journey, I shall see you at the very top.
🎯Trade consistent, FRGNT X
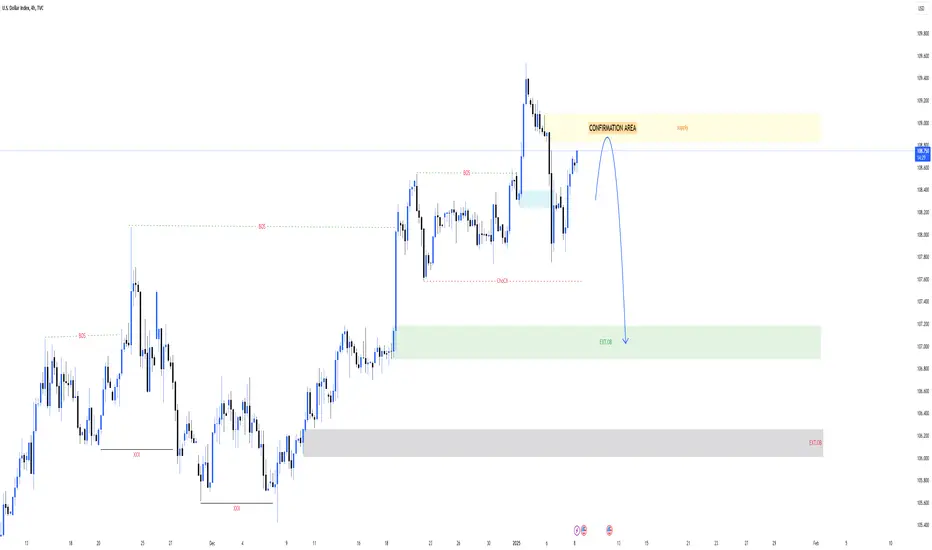
DXY TRADING SETUPDXY TRADING SETUP
Confirmation are in sight!
Get ready for a potential DROP!
Stay tuned for updates and confirmation signals!
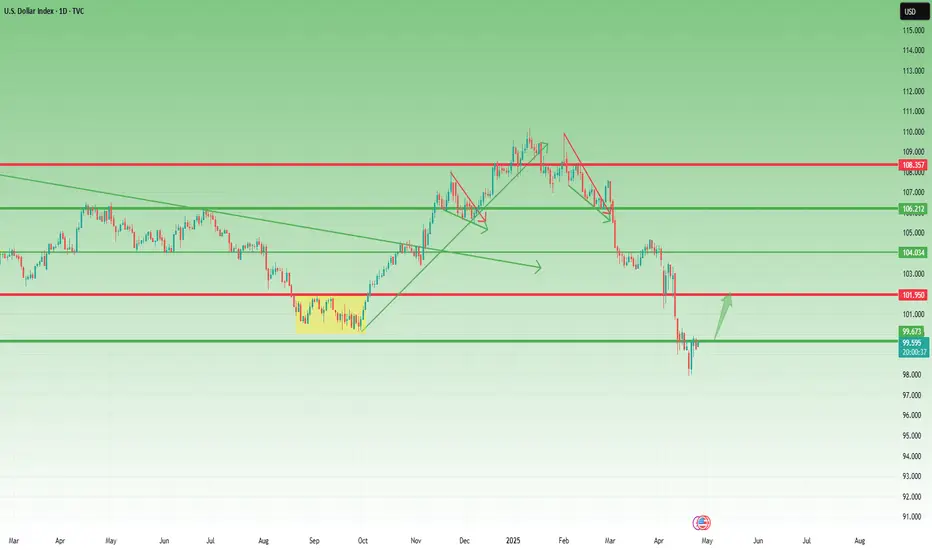
USD Index: A Possible Reversal in Sight?Since early February, right after Trump’s inauguration, the USD Index (DXY) has been under pressure, falling sharply by over 10%.
However, after hitting the 98.00 level, things seem to have stabilized. We're seeing the early signs of a relief rally.
🔍 Technical Perspective:
- This week’s candlestick pattern suggests a bullish reversal.
- The dip on Wednesday was quickly bought, showing buyer interest.
- A minor correction occurred yesterday, but dips are being well supported.
- Currently, the DXY trades around 99.60, just under the psychological level of 100.
🎯 Outlook:
As long as 98 remains intact, the bias shifts towards a potential rebound.
First target: 102 – a logical resistance zone and prior support.
This is not yet a confirmed trend reversal, but the price action is shifting. The key now is how the market reacts around the 100 level. A break above could trigger further bullish momentum.
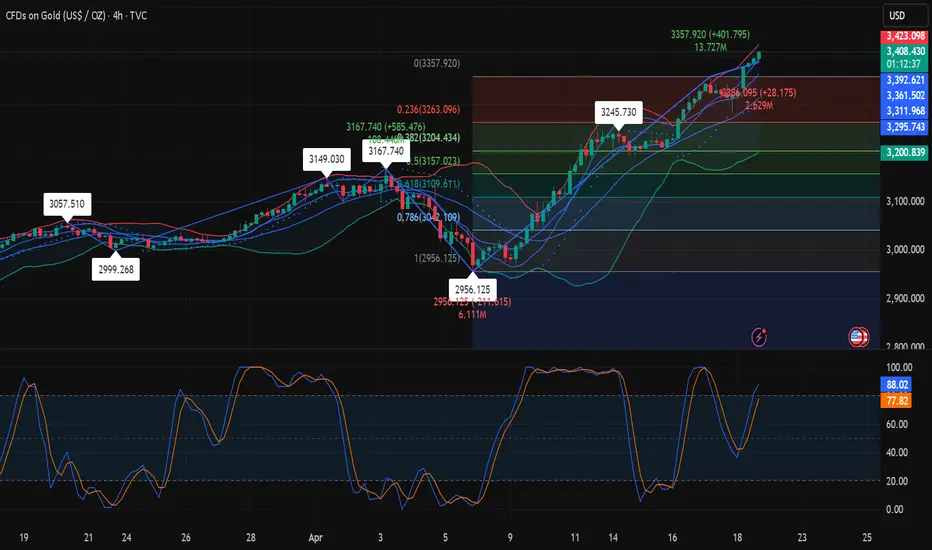
Interpretation of gold short-term operation ideasAfter a surge in the morning, gold was suppressed and fell again in the afternoon and has been in a narrow range of fluctuations!
Evening operation ideas:
If the European session does not continue the Asian session's pull-up and continue to strengthen, the probability of evening fluctuations will increase. After a sharp pullback, it is not easy for gold to turn strong in the short term, so before yesterday's opening is broken, the possibility of continued pullback will increase!
Short-term suppression of the US market: 3330-35, look at a high and then fall
Support below: 3310-3300-3293
Data reference: The Federal Reserve will release the Beige Book of brokerage conditions at 2 a.m.
Trump will sign an executive order at 5 a.m.
Technical analysis of short-term gold operationsGold rebounded to $3,339 and fell back after encountering resistance. It accelerated its decline after the opening of the U.S. market. After falling to $3,260 and stabilizing, gold began to rebound, and was still suppressed by the integer of $3,300 until the closing. Gold broke upward at the opening of Thursday, rising to $3,367, and fell back to $3,314 after encountering resistance and stabilizing. It is currently trading at $3,337. Overall, gold further retreated to $3,260 to stabilize, and rebounded to $3,367 and encountered resistance, which is basically consistent with the lower space of $3,250 and the upper space of $3,385 given by us.
Gold rebounded after hitting a new low in a week on Wednesday, mainly because Bessant said that tariff negotiations will not start soon and will be conducted at the current trade level between China and the United States. Trump did not propose unilateral reductions in tariffs on Chinese imports and denied any upcoming tax cuts, which increased uncertainty and caused some safe-haven funds to flow back into the gold market.

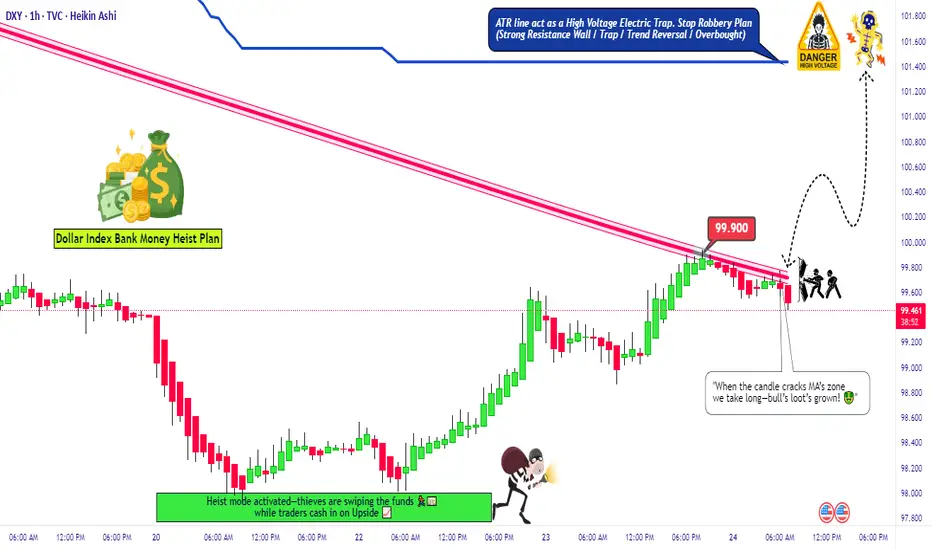
DXY "Dollar Index" Market Bullish Heist Plan (Day or Swing)🌟Hi! Hola! Ola! Bonjour! Hallo! Marhaba!🌟
Dear Money Makers & Robbers, 🤑 💰💸✈️
Based on 🔥Thief Trading style technical and fundamental analysis🔥, here is our master plan to heist the DXY "Dollar Index" Market. Please adhere to the strategy I've outlined in the chart, which emphasizes long entry. Our aim is the high-risk ATR Line. Risky level, overbought market, consolidation, trend reversal, trap at the level where traders and bearish robbers are stronger. 🏆💸"Take profit and treat yourself, traders. You deserve it!💪🏆🎉
Entry 📈 : "The heist is on! Wait for the MA breakout (99.900) then make your move - Bullish profits await!"
however I advise to Place Buy stop orders above the Moving average (or) Place buy limit orders within a 15 or 30 minute timeframe most recent or swing, low or high level for Pullback entries.
📌I strongly advise you to set an "alert (Alarm)" on your chart so you can see when the breakout entry occurs.
Stop Loss 🛑: "🔊 Yo, listen up! 🗣️ If you're lookin' to get in on a buy stop order, don't even think about settin' that stop loss till after the breakout 🚀. You feel me? Now, if you're smart, you'll place that stop loss where I told you to 📍, but if you're a rebel, you can put it wherever you like 🤪 - just don't say I didn't warn you ⚠️. You're playin' with fire 🔥, and it's your risk, not mine 👊."
📍 Thief SL placed at the nearest/swing low level Using the 1H timeframe (98.900) Day / Swing trade basis.
📍 SL is based on your risk of the trade, lot size and how many multiple orders you have to take.
🏴☠️Target 🎯: 101.400 (or) Escape Before the Target
🧲Scalpers, take note 👀 : only scalp on the Long side. If you have a lot of money, you can go straight away; if not, you can join swing traders and carry out the robbery plan. Use trailing SL to safeguard your money 💰.
💰💵💸DXY "Dollar Index" Market Heist Plan (Swing/Day Trade) is currently experiencing a Bullish trend.., driven by several key factors.☝☝☝
📰🗞️Get & Read the Fundamental, Macro, COT Report, Geopolitical and News Analysis, Sentimental Outlook, Intermarket Analysis, Index-Specific Analysis, Future trend targets with Overall outlook score... go ahead to check 👉👉👉🔗🔗
⚠️Trading Alert : News Releases and Position Management 📰 🗞️ 🚫🚏
As a reminder, news releases can have a significant impact on market prices and volatility. To minimize potential losses and protect your running positions,
we recommend the following:
Avoid taking new trades during news releases
Use trailing stop-loss orders to protect your running positions and lock in profits
💖Supporting our robbery plan 💥Hit the Boost Button💥 will enable us to effortlessly make and steal money 💰💵. Boost the strength of our robbery team. Every day in this market make money with ease by using the Thief Trading Style.🏆💪🤝❤️🎉🚀
I'll see you soon with another heist plan, so stay tuned 🤑🐱👤🤗🤩
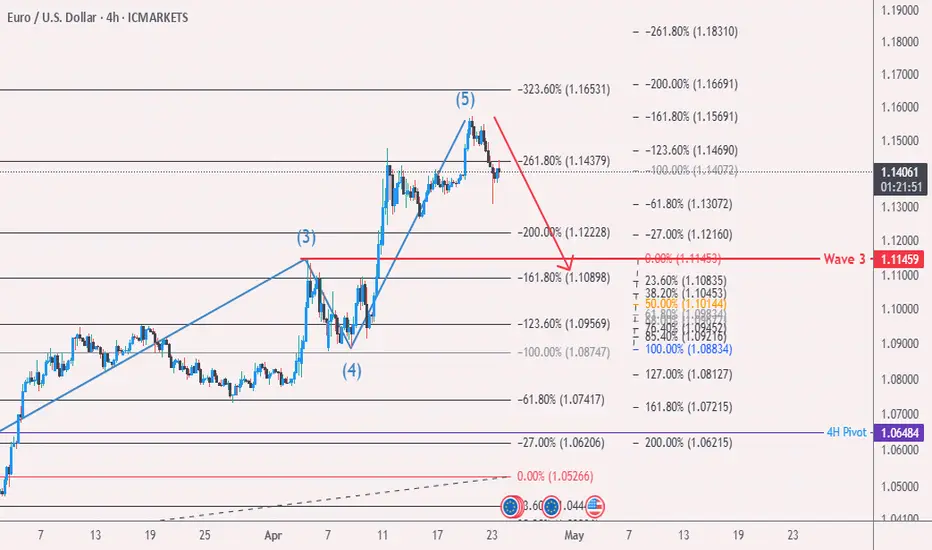
Eur/Usd Apr/23 Elliott wave AnalysisHello eveyone...
IMO 5th wave compelted...so i'm looking for Corrective Waves
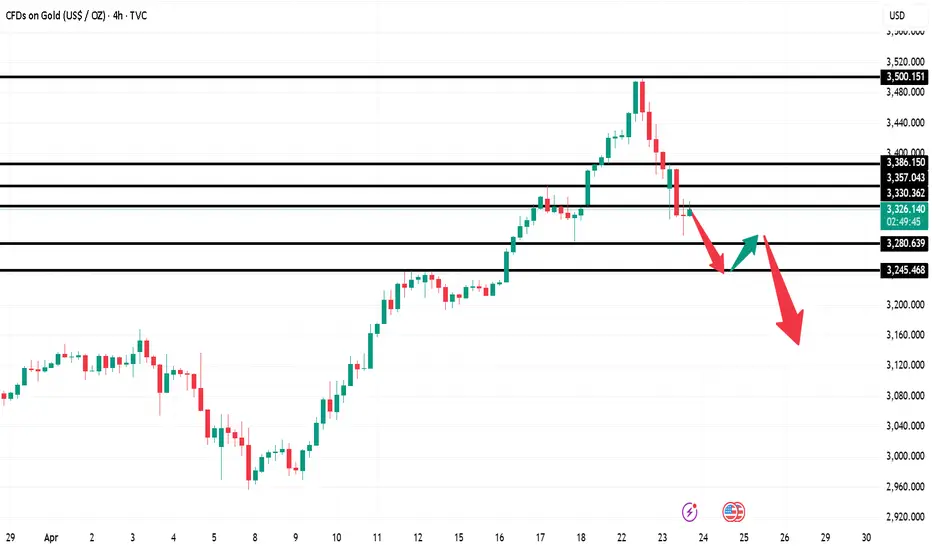
Analysis of gold short-term operation ideasGold price is currently trading below 3330. The downward trend in Asian session broke through the 3315 position in the morning. Our short position also successfully harvested a wave of big profits. Gold price showed signs of rebound in early European session. Now the upper pressure level can be moved down. The short-term pressure level is 3318, followed by the second highest point on the way up at 3357. The lower support level focuses on 3285. After effectively breaking through, we can focus on 3245. Now gold price is trading near the early low of 3315. The prudent operation idea is to go short at 3320 for protection at 3331 and wait for the gold price to reach 3285. After the break, wait for the rebound to 3300 and go short again to see the position of 3245. Long positions are not recommended.
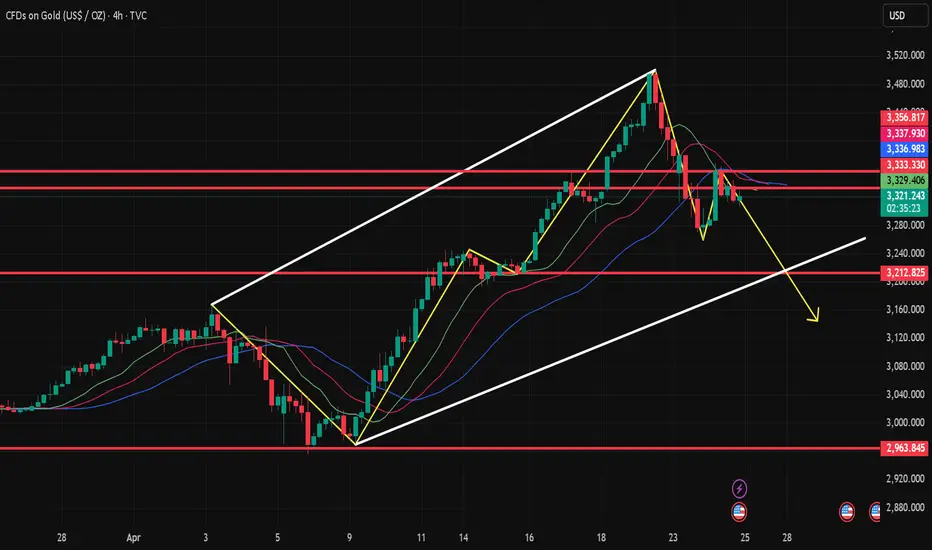
DXY Bearish Pennant Breakdown | More Downside Ahead?The U.S. Dollar Index (DXY) has broken down from a well-defined bearish pennant pattern on the 4H chart, signaling continuation of the prevailing downtrend.
🔹 Technical Setup:
Pattern: Bearish Pennant
Breakdown Level: Below 99.00
Target: ~94.50 based on pennant pole projection
Confirmation: Clear follow-through after breakdown, low volume consolidation
🔹 Fundamentals:
Weak U.S. economic data and dovish Fed expectations continue to weigh on the dollar.
Rising gold and commodity prices further support DXY downside.
📌 Outlook: As long as DXY trades below 99.00 resistance, bearish momentum is likely to extend toward the 94.50 target zone.
NOTE: This is not financial advice. Trade at your own risk. Always do your own research.

Gold 3500 mark is about to openThe gold market opened at 3331.4 yesterday morning, then fell back slightly to 3328.6, then strongly fluctuated and pulled up, breaking through the previous week's high of 3358 and the pressure of 3387 and the 3400 integer mark, and then reached the highest position of 3430.8, and then the market consolidated. The weekly line finally closed at 3424.8, and the market closed with a basically saturated big positive line. After this pattern ended, today's market still has bullish demand driven by risk aversion and bullish sentiment, with the target at 3465, and the break at 3480 and 3500

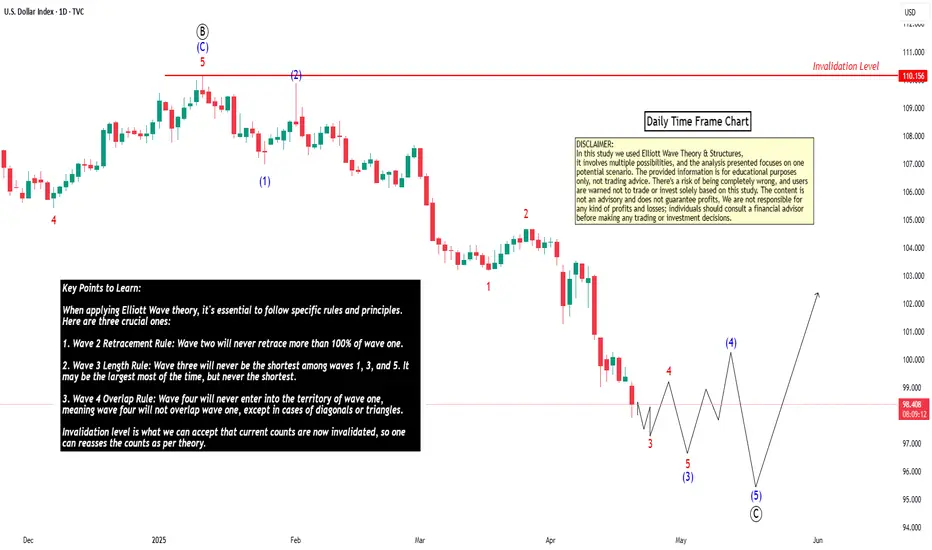
Elliott Wave Principles: A Study on US Dollar IndexHello friends, today we'll attempt to analyze the (DXY) US Dollar Index chart using Elliott Wave theory. Let's explore the possible Elliott Wave counts with wave Principles (Rules).
We've used the daily time frame chart here, which suggests that the primary cycle degree in Black weekly wave ((A)) and ((B)) waves have already occurred. Currently, wave ((C)) is in progress.
Within wave ((C)) in Black which are Weekly counts, Subdivisions are on daily time frame, showing Intermediate degree in blue wave (1) & (2) are finished and (3) is near to completion. Post wave (3), we can expect wave (4) up in Blue and then wave (5) down in Blue, marking the end of wave ((C)) in Black.
Additionally, within blue wave (3) Intermediate degree, we should see 5 subdivisions in red of Minor degree, which is clearly showing that waves 1 & 2 are done and now we are near to completion of wave 3 in Red. followed by waves 4 and 5, which will complete blue wave (3).
Key Points to Learn:
When applying Elliott Wave theory, it's essential to follow specific rules and principles. Here are three crucial ones:
1. Wave 2 Retracement Rule: Wave two will never retrace more than 100% of wave one.
2. Wave 3 Length Rule: Wave three will never be the shortest among waves 1, 3, and 5. It may be the largest most of the time, but never the shortest.
3. Wave 4 Overlap Rule: Wave four will never enter into the territory of wave one, meaning wave four will not overlap wave one, except in cases of diagonals or triangles.
Invalidation level is a level which is decided based on these Elliott wave Principles only, Once its triggered, then counts are Invalidated so we have to reassess the chart study and other possible counts are to be plotted
The entire wave count is clearly visible on the chart, and this is just one possible scenario. Please note that Elliott Wave theory involves multiple possibilities and uncertainties.
The analysis we've presented focuses on one particular scenario that seems potentially possible. However, it's essential to keep in mind that Elliott Wave counts can have multiple possibilities.
I am not Sebi registered analyst.
My studies are for educational purpose only.
Please Consult your financial advisor before trading or investing.
I am not responsible for any kinds of your profits and your losses.
Most investors treat trading as a hobby because they have a full-time job doing something else.
However, If you treat trading like a business, it will pay you like a business.
If you treat like a hobby, hobbies don't pay, they cost you...!
Hope this post is helpful to community
Thanks
RK💕
Disclaimer and Risk Warning.
The analysis and discussion provided on in.tradingview.com is intended for educational purposes only and should not be relied upon for trading decisions. RK_Charts is not an investment adviser and the information provided here should not be taken as professional investment advice. Before buying or selling any investments, securities, or precious metals, it is recommended that you conduct your own due diligence. RK_Charts does not share in your profits and will not take responsibility for any losses you may incur. So Please Consult your financial advisor before trading or investing.
Interpretation of gold US market operation ideas! ! !Gold continued to be bullish in the morning, and the 3400 mark has been broken. How will it evolve next?
The US dollar index directly fell on Monday morning, and the US Y index fell by more than 8% this year, causing gold to rise in a variable. The rise in gold caused by this situation will be greatly adjusted due to the recovery of the US dollar! The key to winning or losing tonight lies between 20 and 22 o'clock.
If the US stock market opens, it will fall below the 98 mark due to the southward movement of the US dollar, creating a new low since April 2022! The market's trust in the US dollar as a global reserve currency has declined! The possibility of turning to other safe-haven assets has increased, thereby increasing the variable of gold rising.
If based on this logic, tonight's 20-23 o'clock cycle is the main winning or losing day of this week!
Hypothetical principle: If it is postponed to the north during the day, everyone should pay attention to the selling pressure near 3415. As the price changes, the selling pressure is more likely to occur! And the defense line will rise in each round of corrective retracement!
Short-term defense line: 3355-3370-3383-3392
Pressure level above: 3430-3458
Risk notice: 1. When everyone is paying attention, long positions may fall at any time, and the range will not be less than 50-80 points!
2. The decline of the US dollar index will lead to a collapse in futures, which will trigger a chain reaction. Traders will face the possibility of gold settlement to fill the gap in other markets!