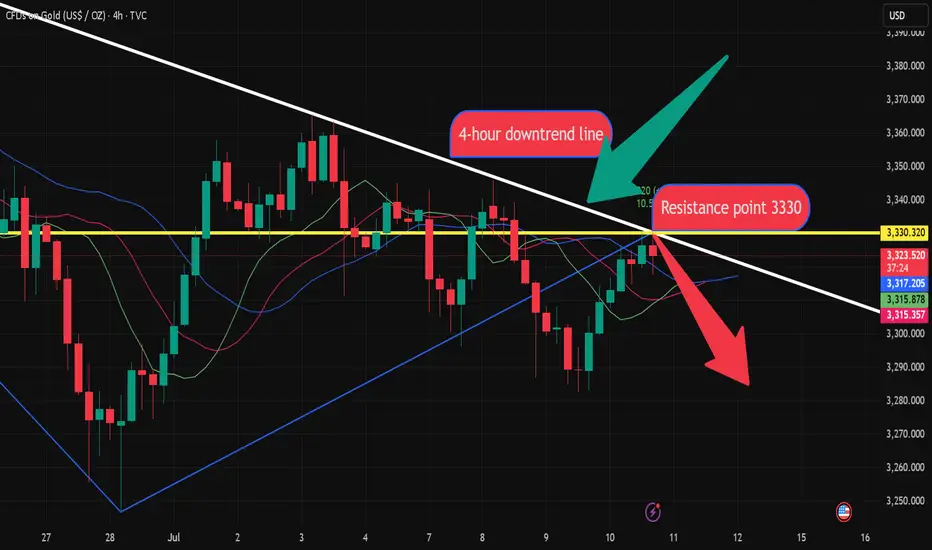
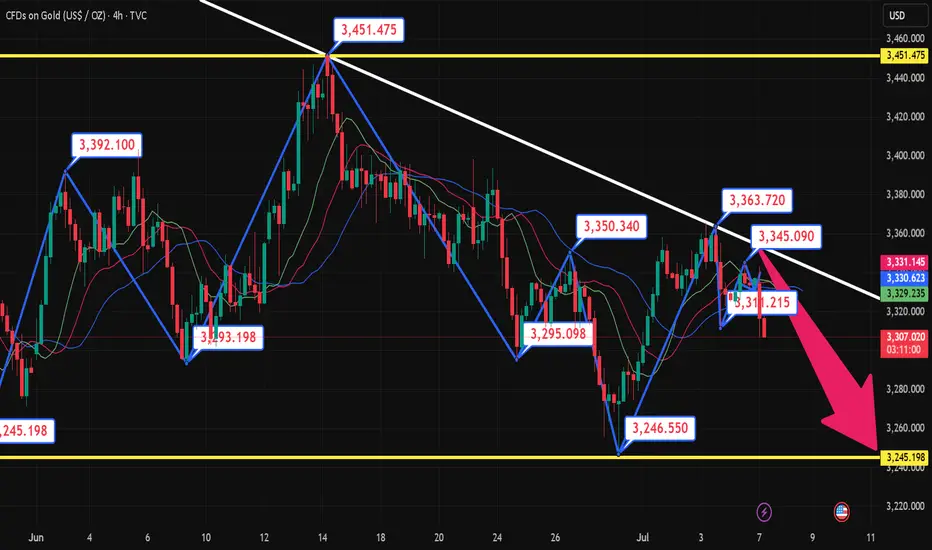
Gold 4-hour resistance point fluctuates, shorts comeOn Thursday (July 10), the 4-hour resistance point of gold price was formed before the US market. The logic of shorting at the resistance point can be considered. Spot gold maintained a strong trend in the European session, trading around $3,330. Although US President Trump's remarks on imposing a new round of tariffs on many countries triggered safe-haven demand, the FOMC meeting minutes showed differences in the path of interest rate cuts within the year, making gold bulls still cautious.
Spot gold continued to retreat after the previous high of $3,499.83, and has been blocked below $3,451.14 recently, forming a relatively obvious box consolidation structure. The current price is running below the middle track of the Bollinger Band at $3,343.69, indicating that the upward momentum of the bulls is weak. Analysts believe that the short-term key support level is at $3,250, which forms a resonance support with the previous low of $3,247.87. If it falls below, it may increase the downside risk.
Dxyshort!!!!!!!!!!!!!
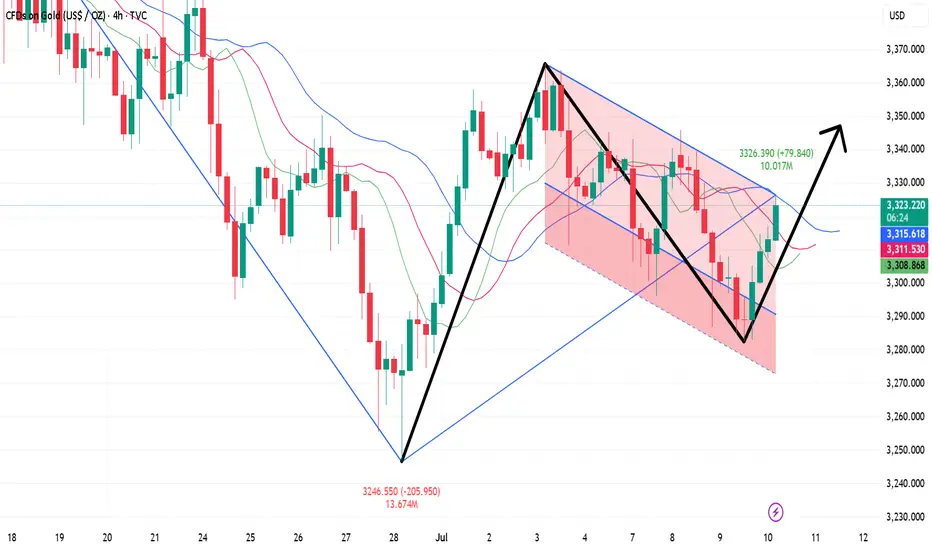
7.11 Gold bulls rise again, beware of the black swan coming on FYesterday, Thursday, the US dollar index rose first and then fell. It once approached the 98 mark before the US market, but then gave up most of the gains.
Yesterday, spot gold fluctuated around the 3320-30 US dollar mark. After the US market, it once touched 3310, but finally rebounded to above 3320 for consolidation.
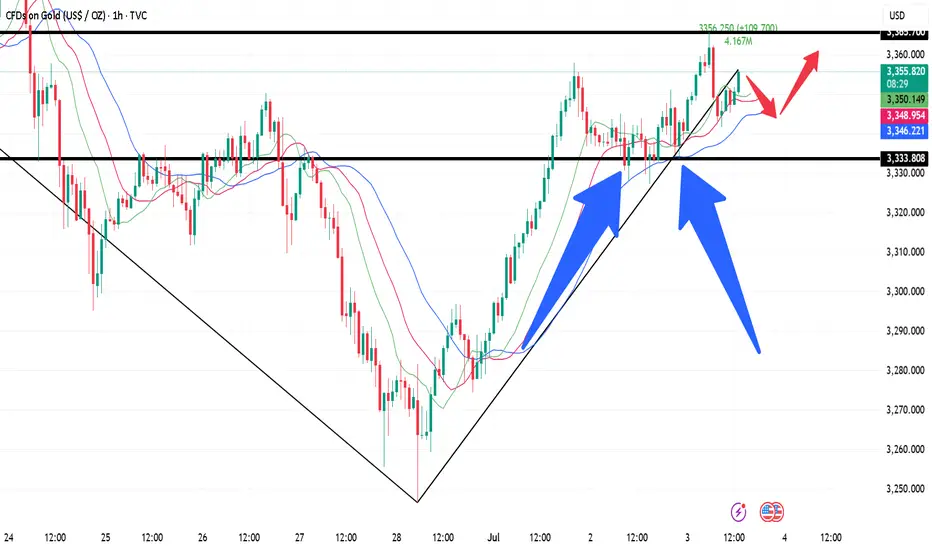
Today, Friday, gold broke through the high point of 3330 yesterday in one fell swoop in the early trading.
So this is relatively good news for bulls.
If the high point of yesterday breaks through and stabilizes, it means that the bullish upward trend may continue today.
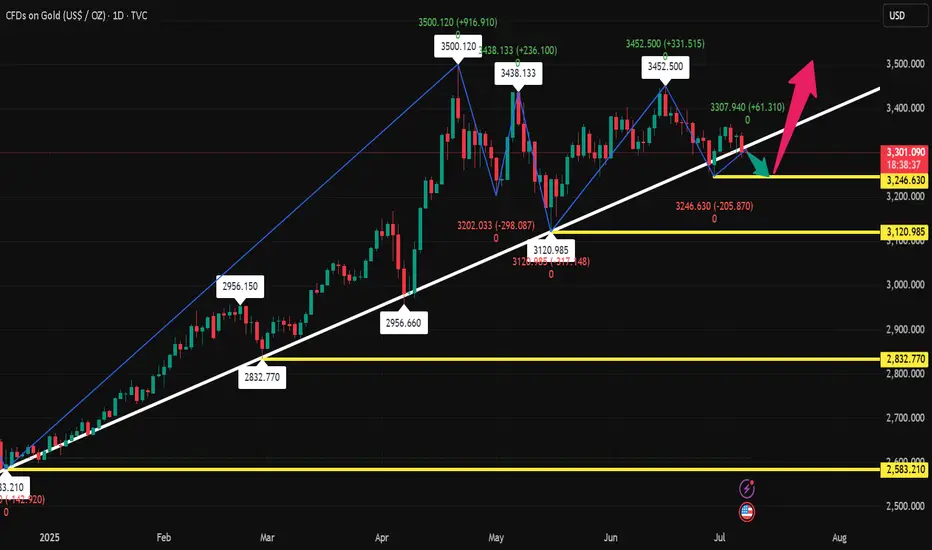
From the current 4-hour chart:
It can be found that the current 4-hour chart of gold has stabilized in the breakthrough range.
So if gold continues to go up, simply look at the previous high point.
The two recent high points are around 3345 and 3360.
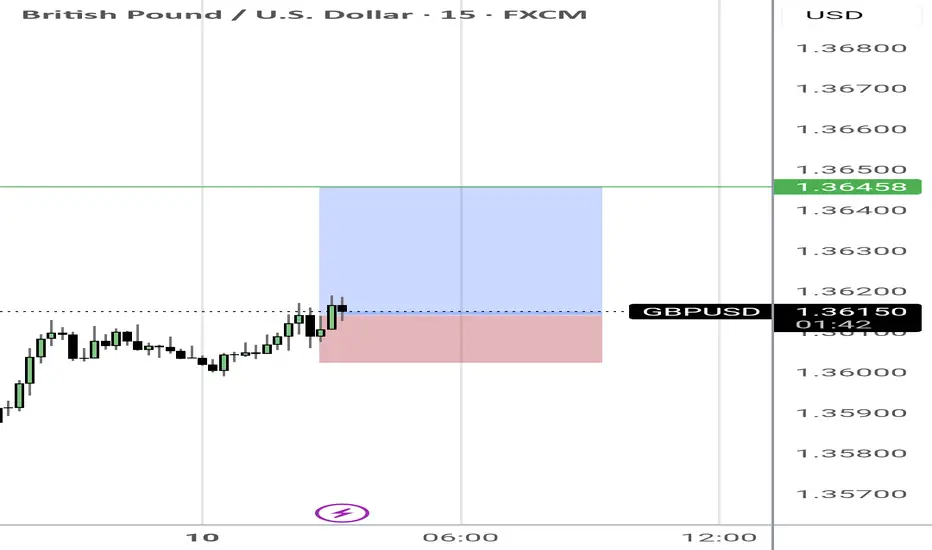
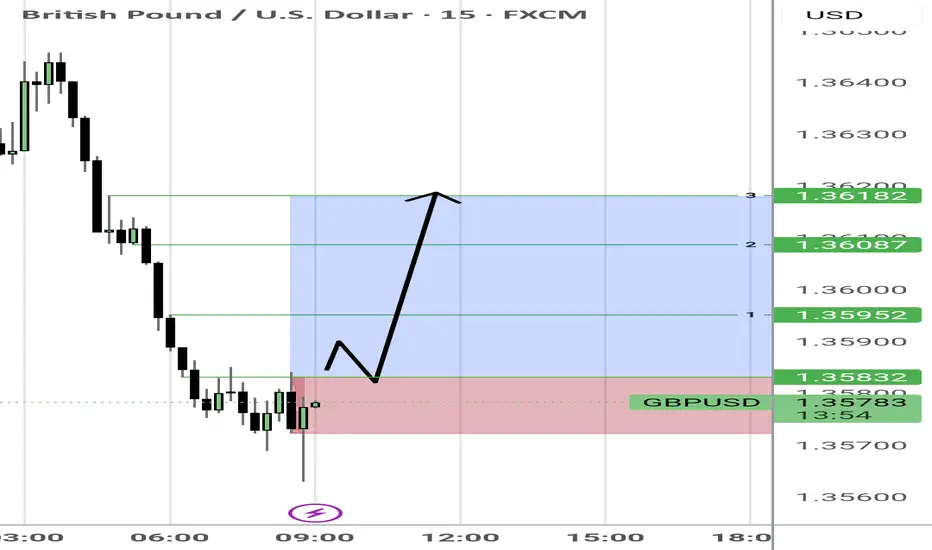
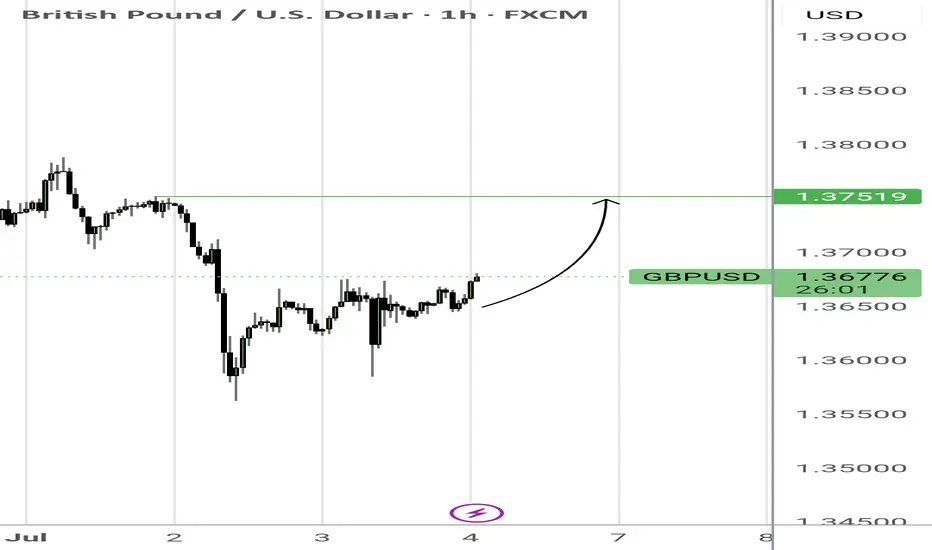
Gbpusd long scalp I like current consolidations near equal high depicted with green line.
I want to see a draw towards the equal highs.
This would be simulation trade #7 out of 100
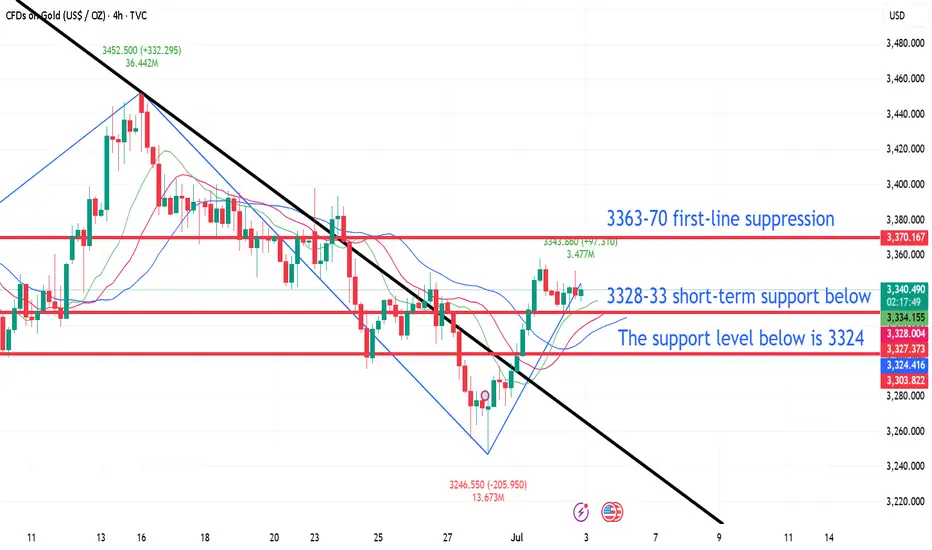
Gold's short-term decline is limited and will continue to riseWith the rise of gold in the US market yesterday, the trend line of the downward trend channel has been supported many times in the short cycle. After the rebound, we still need to pay attention to the suppression of 3328-30. This position is the suppression position of the 4-hour downward trend channel. If it breaks, the overall trend will be a rising flag, which may continue the upward trend. Of course, if it continues to not break through the suppression of 3328-30, it may fluctuate within the range. This requires further observation.
Intraday short-term suggestions: short-term long mainly, pay attention to the support of short-term long near 3307, stop loss 3297, take profit at 3328-30 suppression, break at 3348-50, pay attention to risks.
Technical analysis guide for gold in the US market!Technical aspects:
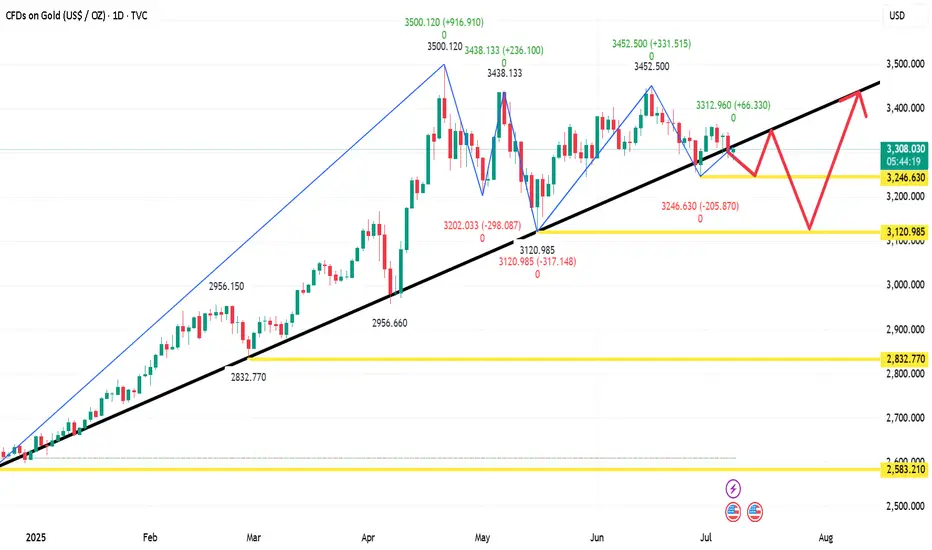
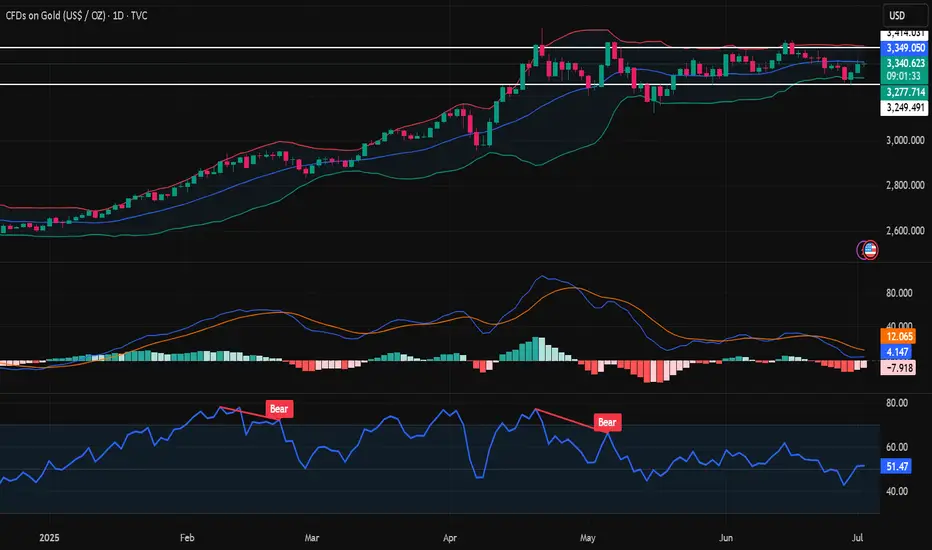
The gold daily chart shows an obvious shock consolidation structure, and is currently running between the middle and lower tracks of the Bollinger Bands, with an overall weak trend. Since hitting a high of $3499.83, the market has fallen into a sideways consolidation range, with top resistance concentrated in the $3400-3450 range and bottom support at $3250. The recent price retracement to around 3250 failed to effectively break below, forming an important support level.
The MACD indicator crossover continues, the green column is enlarged, the double lines are downward, and the momentum is weak. The RSI indicator runs around 44, and does not show oversold or rebound signals. The price is still in a weak consolidation stage. Analysts believe that if it falls below the 3250 line, it may open up further correction space, and pay attention to the 3170 area support; on the upside, if it can effectively stand above 3400, it is expected to retest the 3450 line high.
7.9 Gold long and short switches frequently!From the daily chart, the overall gold price is still in a weak position, the moving average is hooked, and the upper pressure is near the moving average 3319. Only if it breaks through and stands firm at this position during the day, can the bulls start to exert their strength. It happens that the MA10 position of H4 is also near 3319. At present, H4 is in a bearish trend, so the bullish pressure is still very large, but it rose in the early morning, and it bottomed out and rebounded. Combined with the recent non-continuation of the long and short trends, there is a high probability of rebounding during the day, so we can go long in the Asian session first, and go long directly at the current price of 3300, add positions to 3295, defend 3286, and look at 3312-19. The focus is still on the strength of the European session. If the European session is strong, continue to go long before the US session retreats; if the European session is weak, the US session will bottom out and rebound!
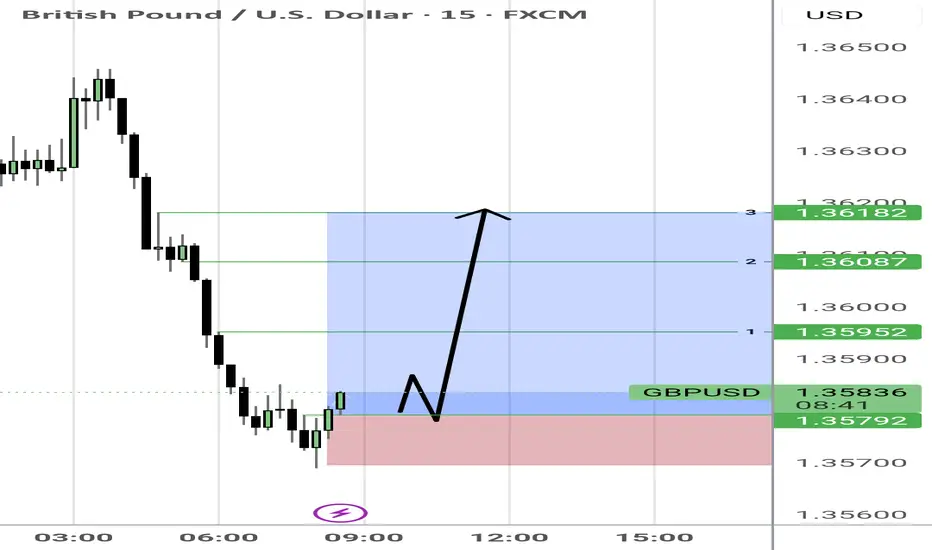
Gbpusd long scalp Same idea as previous post, I want to see a close above 1.35832 and a return into that level would be my entry. 3 targets as depicted.
Gbpusd long scalpWe've taken some sellside liquidity. I am expecting price revert back into the range. Simulated trade #6 already triggered at 1.35792 any return into this level would be a good entry or near this level allowing 3 pips.
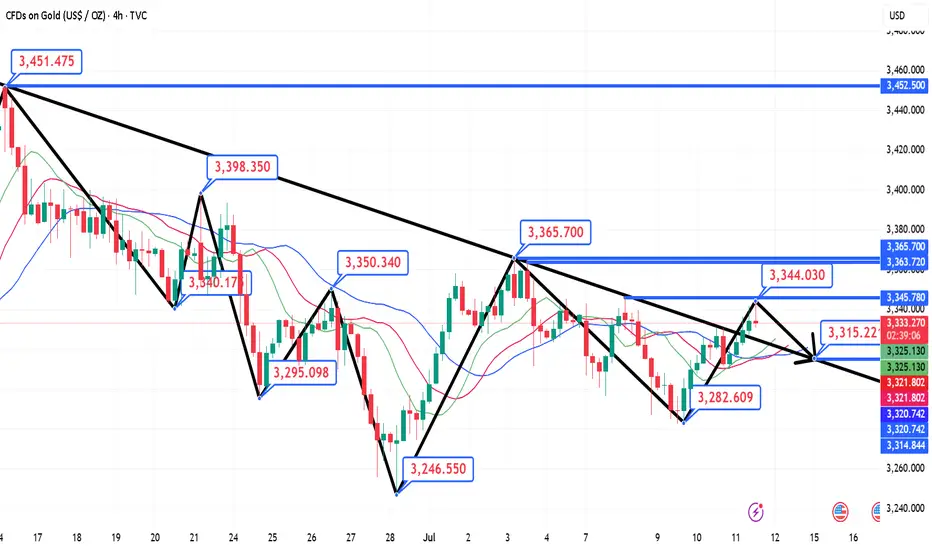
Weekly range to be continued, gold short and long this weekLast week, gold opened high at 3280.9 at the beginning of the week and then fell back. The weekly low reached 3245.8, and then the market was strongly pulled up by the support of this round of trend line and fundamentals. On Thursday morning, the weekly high touched 3366, and then the market fell strongly under the strong influence of non-agricultural data. On Friday, the market consolidated in the range due to the holiday, and the weekly line finally closed at 3337.2. The weekly line closed with a medium-sized positive line with equal upper and lower shadows. After ending in this pattern, today's market continued to move in the range. In terms of points, the stop loss was still at 3346 after the short position at 3342 last Friday. Today, it first rose to 3342 and the short stop loss was still 3346. The target below is 3330 and 3322. If it falls below, the support of 3310 and 3300-3292 will be targeted.
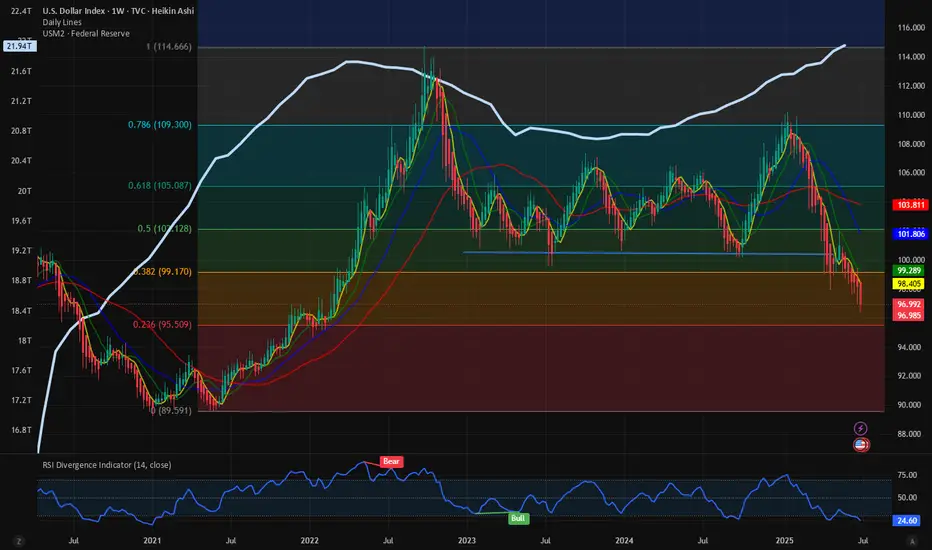
$DXY: New lows begets new lows. $USM2: Why is it increasing? Here we are again with one more TVC:DXY chart analysis. I think the US Dollar does not fail to surprise us week after week. Making new lows every week is giving a boost to the Equity markets. The SP:SPX and NASDAQ:QQQ are at ATH. In my articles on April 18 and June 16
Perfect trade setup: AMEX:GLD to 325; DXY to 95 for AMEX:GLD by RabishankarBiswal
TVC:DXY weakness and EM markets: NSE:NIFTY more upside? for NSE:NIFTY by RabishankarBiswal — TradingView
We have time and again said that in the near term TVC:DXY chart looks weak and could touch 95 by end of July. I think it might be achieved earlier. We have looked at the consequences of 95 handle on TVC:DXY on various asset classes like AMEX:GLD , NSE:NIFTY and EMs. These asset classes are reaching ATH every single week. But we have seldom investigated the reason behind the weakness in $DXY. Looking through my macro charts I found an amazing chart which might explain most of this weakness.
The ECONOMICS:USM2 is almost at 22 T $ surpassing its previous high on March 2022. M2 is basically the total amount of money in circulation in the economy on top of the nominal M1. Higher M2 indicates higher amount of liquidity which is then channelized into riskier assets like CRYPTOCAP:BTC , AMEX:GLD , SP:SPX , NASDAQ:QQQ and EMS like $NIFTY. And with such high ECONOMICS:USM2 in circulation, it is very clear why TVC:DXY is making new lows each week. This can also explain why US Fed is hesitant to reduce rates. With M2 so high US Fed should not hurry.
Verdict: TVC:DXY to 95 by 31 July, Cycle low of 90 by year end. ECONOMICS:USM2 keeps increasing. US Fed stays put.
Gbpusd long idea after reversalUpdate of previous call after we broke structure.
I see this one attacking buyside liquidity at equal highs formed on Tuesday.
Possible market maker buy model playing out here.
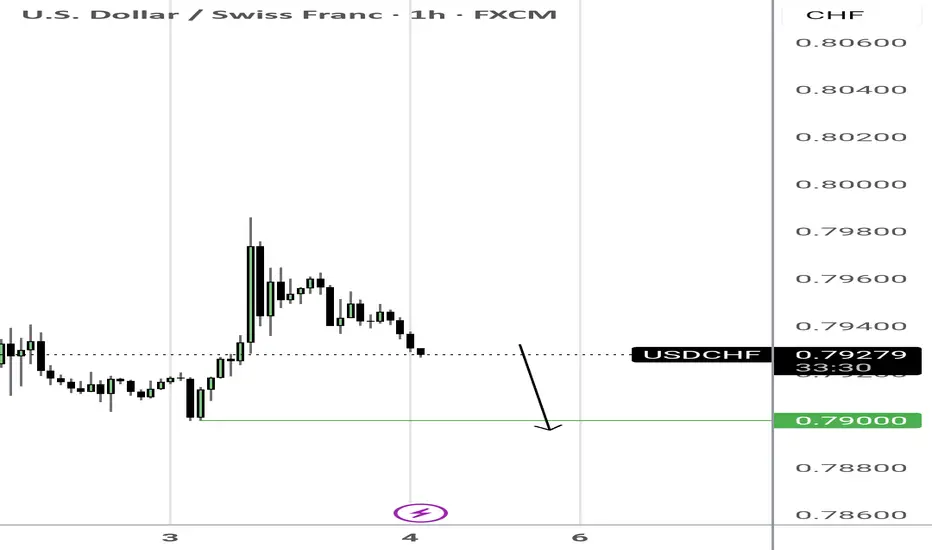
Usdchf short idea after reversalAn update of previous idea. I see this one in reversal mode.
Likely marker maker sell model playing out now.
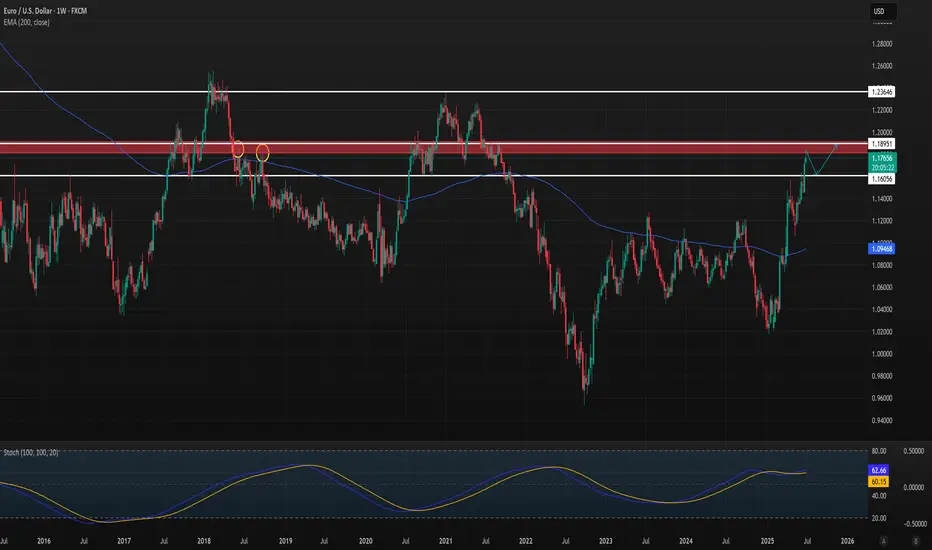
EURUSD Short Projections for Big Beautiful BillI think we may hit a resistance point soon and drop to around 1.16 or lower. Based on the fundamentals of the Big Beautiful Bill. I think this will be short term and the USD may lose strength.
It will have large economic impact, I think this will happen in short term.
FX:EURUSD
TVC:DXY
7.3 Prediction of gold price fluctuation before non-agriculturalAfter the release of ADP data last night, gold prices resumed their rise and crossed the high of 3357.88 this week and closed near this position. Today, gold prices opened high and then fell back. Pay attention to the strength of the correction in the morning session and choose the opportunity to go long and bullish. From the current market perspective, the support below can focus on the low point of yesterday's US session near 3333, followed by 3327; before the release of non-agricultural data, the upper pressure will focus on the early trading start point 3366, followed by 3375. The operation in the Asian and European sessions is mainly to go long on the correction, and the high-altitude thinking is abandoned. Specific operation ideas: Go long and bullish when the gold price falls back to around 3338, protect the position of 3330, and the target is to see whether the early trading high of 3365 can break!
7.2 Technical Analysis of Gold Trading in the US MarketGold fluctuated in the range of 3326-3355 today on Wednesday. The small non-agricultural bullish gold broke through the 3345 line and hit the 3351 line, and then fluctuated back to the current 3342 to adjust the momentum of rising again. If the positive line on Wednesday closed above 3345, it will continue to rise to 3363-3370; if the negative line on the closing fell below the middle track, it will continue to fluctuate and consolidate in this range. The support of 3324 below is the key position tonight; as long as this position is maintained, the bulls will rebound and rise, otherwise they will fall into the battle for support at the 3295-3301 line.
Technical analysis:
From the 4-hour analysis, the support below is around 3324. The main bullish trend remains unchanged after the evening retracement. The important support is 3314-16, and the focus is on the long-short watershed position of 3295-3301. The daily level stabilizes above this position and continues to maintain the rhythm of retracement and bullish trend.
Gold bulls and bears compete for non-agricultural dataTechnical aspects:
Currently, gold is in a typical ascending triangle structure, reflecting that the market bullish trend has not been broken but faces strong resistance. On the daily chart, gold as a whole maintains a range of $3250 to $3400, with obvious horizontal support and resistance bands formed at both ends of the range.
The Bollinger Bands are converging as a whole, indicating that volatility is shrinking, indicating that the large-scale direction selection is approaching. The green column of the MACD indicator has narrowed slightly, and the short-term momentum is still bearish but there are signs of weakening. The RSI indicator runs around 49, maintaining a neutral and bearish state, and there is no obvious deviation in the short term, suggesting that there is still the possibility of subsequent shocks and consolidation.
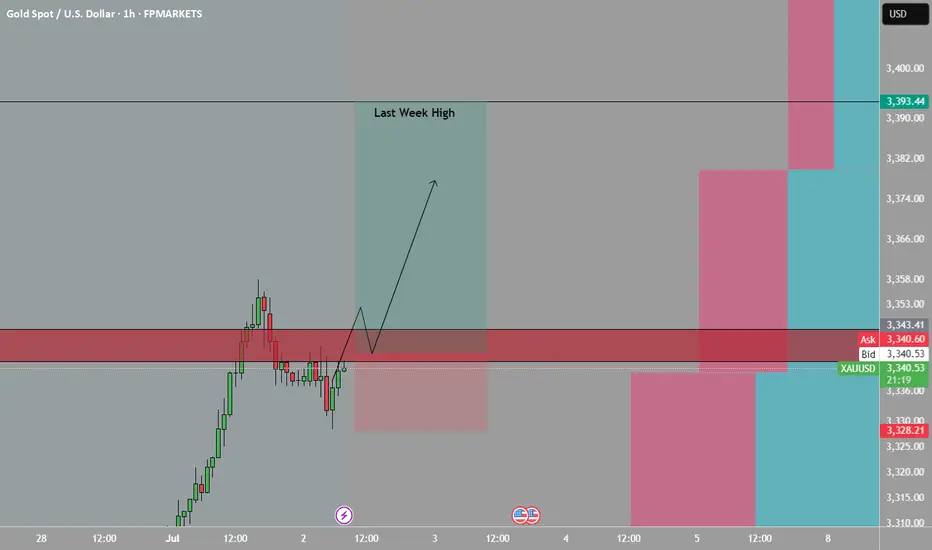
XAUUSD Free Signal: Bullish Breakout!!!Hello everyone.
I’m sharing a trade setup for GOLD.
Gold has shown strong bullish momentum this week. Picture is simple, The setup is straightforward: I’m following the gold uptrend, targeting last week’s high.
Type: Buy (Long)
Entry: $3,343 (after price breaks resistance at $3,340)
Stop Loss (SL): $3,328 (below the recent swing high)
Take Profit (TP): $3,393 (targeting last week’s high)
Risk-Reward Ratio: 1:3.3 (risking $15 to gain $50)
This trade offers a high reward, low risk (1:3 risk-reward ratio). Gold shows buyers dominating and sellers weakening. Additionally, the US dollar index (DXY) is in a strong bearish trend. On higher timeframes (1W, 1D), gold’s recent move appears to be a slow correction, supporting my long position.
What do you think of this gold setup? Share your thoughts in the comments! Follow for more free signals, and like if you’re taking this trade!
Disclaimer: This is not financial advice. Trading involves risks. Always do your own research and manage your risk carefully.
7.2 Gold price continues to fluctuate! Non-agricultural positionGold is still temporarily maintaining a wide range of fluctuations in the daily trend, and the price is temporarily under pressure around 3360. In the 4-hour level trend, after continuous high-level narrow fluctuations, the technical pattern has begun to weaken. The short-term moving average has gradually flattened from the previous upward divergence. After the continuous small-scale high-rise and fall back, the upward momentum in the short-term trend is insufficient. In the hourly level trend, the current running space is very compressed, but in the small-level cycle trend, after continuous fluctuations, the technical pattern has begun to weaken. The price has begun to slowly move out of the narrow range of fluctuations. Pay attention to the short-term adjustment and repair.
7.1 Technical guidance for short-term gold analysis!!!Gold hourly level: From the opening to now, it has been rising slowly with a small negative in the middle. It is all positive. This kind of pull-up pattern must not be tested for shorting. During the European session, it also broke through the upper rail resistance of the 3335 downward channel. There is a second pull-up in the US session; but it has not been able to step back, and even the 10-day moving average does not give a chance. If you want to step back and follow the long position, there is no chance for the time being, and going long directly seems more radical; conservative can wait patiently, be bullish, and don't go short; if it can be confirmed tonight that it is above 3335, you can try to follow the bullish trend, and the upper resistance target is 3374;
7.2 Gold bulls continue to rise, bears come to an end temporarilFrom the 4-hour analysis, the upper focus is on the 3345 line of suppression, the lower short-term support focuses on the 3314-3316 line, and the key support of 3295-3301 line is focused on. The overall support is based on this range to maintain the main tone of low-multiple participation. In the middle position, watch more and do less, be cautious in chasing orders, and wait patiently for key points to enter the market.
Gold operation strategy:
1. Gold 3316-24 line long, retrace to 3295-3303 line to add more positions, stop loss 3293, target 3340-45 line, continue to hold if broken;
7.1 London gold rebounds and rises, gold market trend analysis aGold rose to 3295 in the Asian session on Monday and was blocked. It fell in the European session as we expected, but the decline was not strong. After the lowest price of 3274.57, it rose again in the US session and stood firmly at the 3300 mark. The monthly line closed with a cross Yang K. The gold price continued to rise at the opening today. After the market on Monday, the 3247 below can be used as a reference for the bottom rebound position. Now the short-term trend belongs to the bulls, so we will continue this trend today and look at the upward trend first, wait for the European session to see the strength of the decline and then formulate the idea of the US session.
From the market point of view, after the gold price stood above the 3300 mark again, it is used as a short-term support level reference for the bulls. The Asian session can rely on this position to arrange long orders to see the continuation of the upward trend; the initial pressure on the upper side focuses on the 3328 position, followed by 3345. Now that the idea is established, the idea for intraday operations is: wait for the gold price to pull back to around 3308 in the Asian session and then go long and bullish, protect the 3300 mark, and target around 3328; if there is pressure at 3328 in the European session, you can arrange short positions with a downward trend, wait for the US session, and then decide whether to go long again based on the pullback position and target around 3345.

Gold's rally has not reversed yet? The consolidation pattern hasTechnicals:
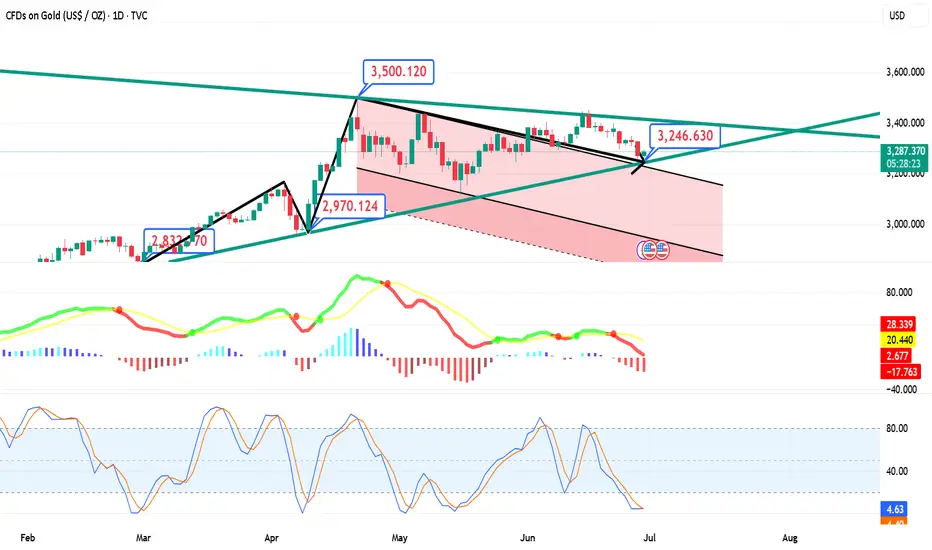
Short-term risks remain skewed to the downside as the momentum of the relative strength index (RSI) and the moving average convergence divergence indicator (MACD) weakens. The RSI hit a new low below the neutral 50 mark. If short pressure intensifies in the next few trading days, gold prices may retest the upper track of the previous falling channel at 3215, followed by the rising support line from October 2024 at 3150. If it falls below this level, the decline may accelerate towards the psychological level of 3000, or even lower to 2970.
On the upside, if a strong catalyst pushes gold to rebound above the 20-day and 50-day moving averages (currently 3320-3350), the next resistance level may appear in the 3400-3435 range. A decisive close above this boundary may pave the way for gold prices to move towards 3500, or test resistance near 3530, and then may target the 3600 level.
Overall, despite the weakening technical indicators, gold has not completely lost its bullish reversal potential. As long as the price remains within the sideways structure above 3150, the downward pressure may still give rise to a "buy on dips" strategy.
6.30 Safe haven disappears, gold loses its luster!Gold did not break through the upper pressure at midnight last Friday. Gold fell directly after opening in the morning on Friday. The bears broke through the previous 3295 support line, and the lowest reached 3255 in the evening. It closed at around 3274, and the daily line also closed in the form of a big Yin line.
From the 4-hour analysis, the upper short-term resistance focuses on the 3295-3301 line, and the 3316 line is focused on. In terms of operation, it is still rebounding and continuing to be short and follow the trend to fall. The short-term support below focuses on the 3250-3255 line. The overall high-altitude participation tone remains unchanged relying on this range. I will remind you of the specific operation strategy during the session, and pay attention to it in time.
Gold operation strategy:
1. Short gold rebounds at the 3295-3301 line, and short gold rebounds at the 3314-16 line, stop loss at 3326, target 3255-3260 line, and continue to hold if it breaks;
