Gold hits 3500 retracement adjustmentGold Technical Forecast:
From a technical perspective, gold is confidently moving along a bullish trajectory. There is no doubt about that. But the signals now sent by the Relative Strength Index (RSI) and other momentum indicators are worth paying attention to. The daily RSI reading is close to 80, which has entered the severely overbought area. However, this does not necessarily indicate impending doom. It just confirms what we already know: buyers are in control.
So, is the price close to a top? Possibly. But I would not sound the alarm bells just yet. These high indicators are more of a warning than a battle cry. It is more of a "stay alert" than a "get out of here".
Spot Gold Technical Levels to Watch
Gold's climb to a record $3,500 was impressive, but as expected, it has begun to retreat slightly from this psychological high, most likely due to some conventional profit-taking. There is no natural resistance above this level; all we have are round numbers. However, on the way down, the situation is different.
Technical Analysis
Initial support includes Monday's high of $3,430 and the round number mark of $3,400 on the daily chart. Looking further down, $3,357 is last week's breakout level, followed by reliable support at $3,300. If a more meaningful pullback occurs, $3,245 and $3,167 will be worth watching, both of which were previous resistance ranges and are now likely to become support levels.
Dxyshort!!!!!!!!!!!!!
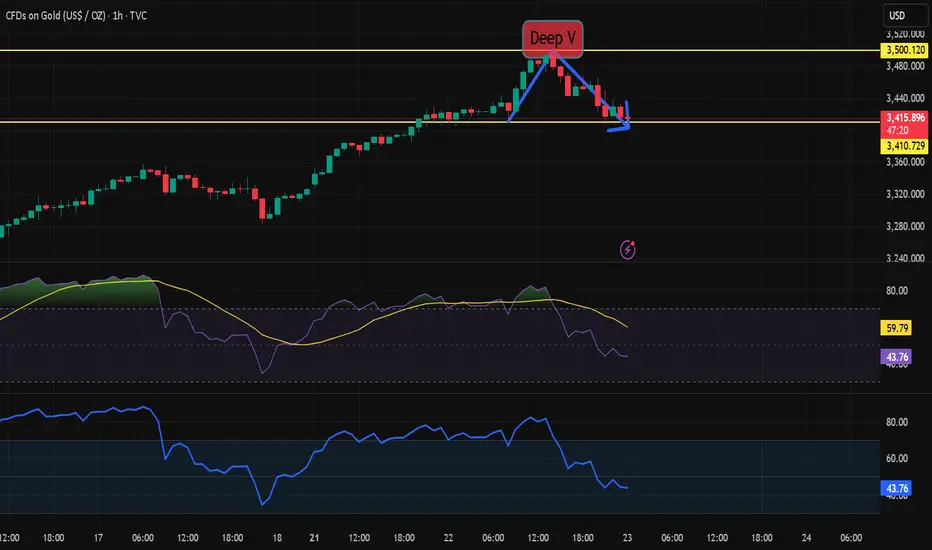
Gold price breaks through a new high of 3500 and enters the key Gold price hit a new record high of 3500. After reaching this point, it showed obvious pressure and went down to find the 3461 area. This is the largest correction since the rise of 3284 last Thursday.
Today's early trading price also continued to rise and break through the new high, but there was an episode, that is, it first broke through the high of 3444, then fell sharply to 3412, and finally confirmed the strong rise at 3418 to break through the new high, and continued to break through the sprint
Until noon, it sprinted to 3495 and suppressed the decline to find 3473 support, and then pulled up again to sprint to break the high of 3500. This time the decline was relatively strong, falling to the 3461 area
So far, the rising process can be slightly slowed down and enter a wave of adjustment
Accumulate momentum to provide power for the next round of start-up
During the adjustment process, pay attention to the golden section line
This wave from Since the rise from 2970, the largest adjustment squat is 0.382, and now this position is 3417, which is close to the Asian market acceleration starting point 3418. The two together become the stabilizer of the bullish trend: 0.382 position 3417 area
This is the first focus of today. During the adjustment process, pay attention to the position of the golden section line
0.382 position is 3417, close to the acceleration starting point
0.500 position is 3391, close to the 3384 area along the channel line
0.618 position is 3366, close to the four-hour lifeline
The current price space is large and the speed is fast. Articles and analysis are only auxiliary, and are more temporary reminders. Plans cannot keep up with changes. The three key points mentioned above can be kept in mind. If there are price variables during the process, they can also be adjusted accordingly.

Gold 3500 mark is about to openThe gold market opened at 3331.4 yesterday morning, then fell back slightly to 3328.6, then strongly fluctuated and pulled up, breaking through the previous week's high of 3358 and the pressure of 3387 and the 3400 integer mark, and then reached the highest position of 3430.8, and then the market consolidated. The weekly line finally closed at 3424.8, and the market closed with a basically saturated big positive line. After this pattern ended, today's market still has bullish demand driven by risk aversion and bullish sentiment, with the target at 3465, and the break at 3480 and 3500

Interpretation of gold US market operation ideas! ! !Gold continued to be bullish in the morning, and the 3400 mark has been broken. How will it evolve next?
The US dollar index directly fell on Monday morning, and the US Y index fell by more than 8% this year, causing gold to rise in a variable. The rise in gold caused by this situation will be greatly adjusted due to the recovery of the US dollar! The key to winning or losing tonight lies between 20 and 22 o'clock.
If the US stock market opens, it will fall below the 98 mark due to the southward movement of the US dollar, creating a new low since April 2022! The market's trust in the US dollar as a global reserve currency has declined! The possibility of turning to other safe-haven assets has increased, thereby increasing the variable of gold rising.
If based on this logic, tonight's 20-23 o'clock cycle is the main winning or losing day of this week!
Hypothetical principle: If it is postponed to the north during the day, everyone should pay attention to the selling pressure near 3415. As the price changes, the selling pressure is more likely to occur! And the defense line will rise in each round of corrective retracement!
Short-term defense line: 3355-3370-3383-3392
Pressure level above: 3430-3458
Risk notice: 1. When everyone is paying attention, long positions may fall at any time, and the range will not be less than 50-80 points!
2. The decline of the US dollar index will lead to a collapse in futures, which will trigger a chain reaction. Traders will face the possibility of gold settlement to fill the gap in other markets!
Gold is hard to break through 4000, short sellers are coming
Gold prices rose strongly in the Asian session on Monday, approaching the historical high of $3,400 per ounce, as concerns about the global trade situation intensified and the dollar fell to a two-year low due to concerns about economic recession. Despite the overbought signal on the technical side, the market's expectations of the Fed's rate cut and trade concerns continue to attract safe-haven funds to flow into the gold market.
Technical side:
Gold opened higher on Monday and has now risen from 3330 to 3394, with a range of $65. At present, gold indicators are expected to be severely overbought and a large correction may be needed at any time. In addition, the main force continues to push up gold to prevent the main force from fleeing. Gold is mainly shorted at highs below the 3400 mark!
SELL: 3394 Stop loss 3405
TP1: 3375
TP2: 3360
Bearish sentiment on the USD index (DXY)TVC:DXY
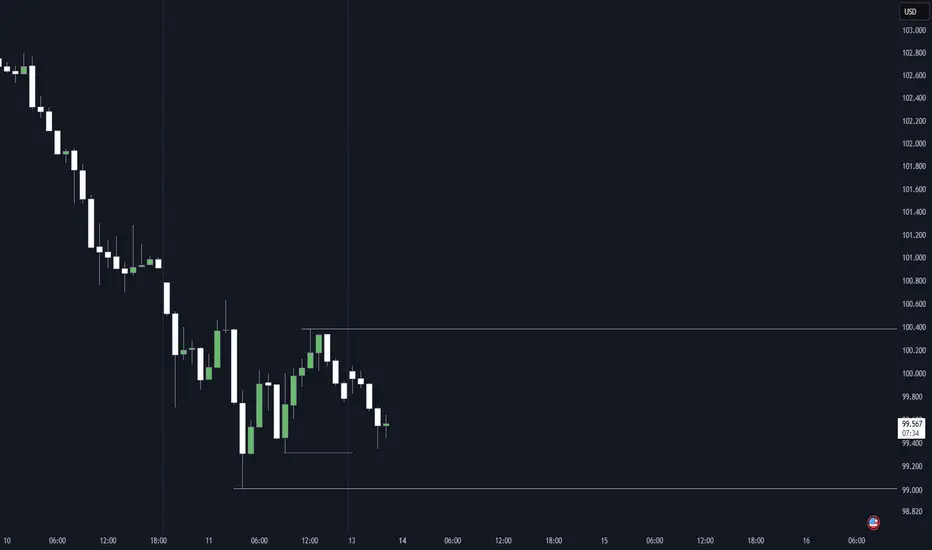
On this trading week (April 14-18), we have not seen much volatility in the USD index, with its highest trading point at approximately 100.3 and lowest 99.2, partly due to a long bank holiday for Good Friday and Easter on the following Monday. On last week's Friday, price briefly tapped into the weekly demand zone and gave a quick reaction upwards to the 4-hour supply zone, which then quickly rejected and cooled price back down. Currently, price is still sitting at the lower point of the weekly range, we can expect DXY to have a very short-term push back to this strong 4-hour swap zone above, possibly creating a higher high, before pushing it back down. Price is very likely to take out the weekly lows and continue to push towards the bottom of the weekly demand zone.
On fundamentals, Bank of America's analysts had identified close relationship of its depreciating USD, with its falling US asset and equities values. Economic activities have also declined due to trade wars and huge uncertainty of the upcoming policy changes by the Trump administration; asset managers and central banks may also continue to sell USD. Besides, the US is very likely to continue reducing its interest rates in order to boost its economic activity. One of the reasons why Trump imposed high tariffs into many countries was to reduce international dependency on the manufacturing sector and trade deficits, and to attract foreign investments to set up factories in the US, in order to sell to consumers at the 'good price'. However, it is still very controversial on how effective it is, business owners abroad may perceive Trump's policies as bipolar, which changes depending on his mood, therefore, majority of businesses would rather partner elsewhere than to put themselves through this hassle. USD has also dropped 10% since the start of 2025 and has reached its lowest in three years.
References:
www.investing.com
www.cbsnews.com

Interpretation of technical analysis of gold market opening operDue to the influence of Easter, the market was closed on Friday this week. After hitting a high of 3357, gold also ushered in a short-term adjustment! In the previous interpretation, we also emphasized to everyone that after hitting a new high, we should guard against the pullback caused by profit-taking. Especially at the critical time point when the market is about to close, but this does not mean the end of the bullish trend. After the sharp rise in gold, although there is selling pressure, gold still rose by 2.5% this week and closed above 3300.
So how should we trade gold next week?
The biggest driving factor for the rise in gold prices this time is Trump’s repeated tariff policy, coupled with the recent tense geopolitical situation, and the pace of global central banks buying gold. In the medium and long term, it is still a driving force for gold to rise.
Short-term operation: Pay attention to the first support level, which is 3310, which has been touched many times.
Short-term key support below: 3285-90
Short-term focus on high points above: 3340-45
If the breakthrough accelerates to the historical high point, everyone should be cautious in chasing more!

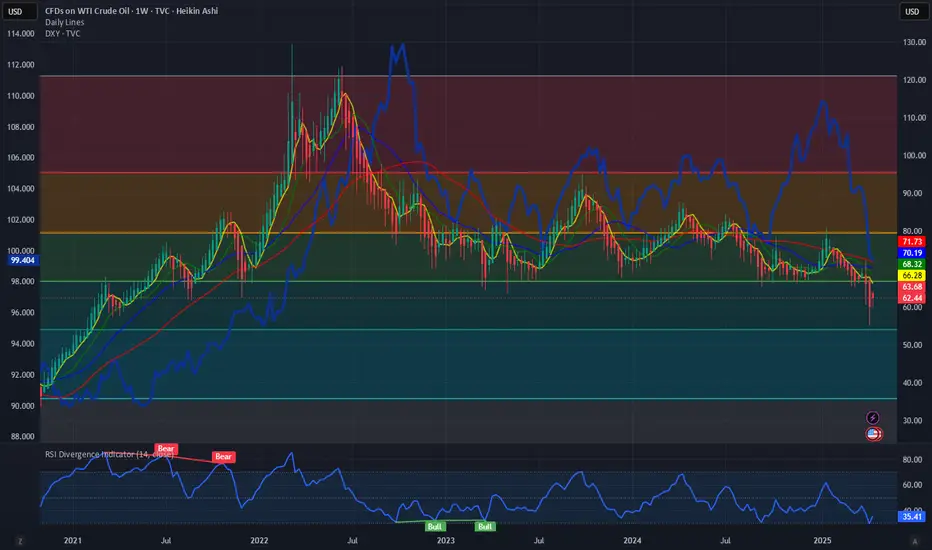
Recent correlation breakdown between $USOIL and $DXYUsually, market watchers will say if the Dollar index TVC:DXY is down then commodities like Crude Oil and Gold should outperform. But recent market events have invalidated this assessment. Since 2022 we see that there is a correlation breakdown between TVC:USOIL and $DXY. These 2 indexes have been moving in tandem recently. In 2025 we saw a massive sale in the TVC:DXY and a similar downturn in the US Dollar index. With TVC:DXY below 100 and TVC:USOIL recently below 60 $, these 2 indexes are clearly indicating a US recession with low Oil demand.
IN this chart we see that the next key support levels in TVC:USOIL is 54 $. If we go below 54 $ then the next level to watch will be 35 $. That will be a recessionary scenario last seen during COVID lows. That can bring down the TVC:DXY to 90 levels. All those will indicate a deep recession which is not my base case scenario. My assessment we will see TVC:USOIL @ 55 $ and TVC:DXY @ 95 and then we will hover around those levels.
Verdict: TVC:USOIL can touch 55 $ if TVC:DXY touches 95.
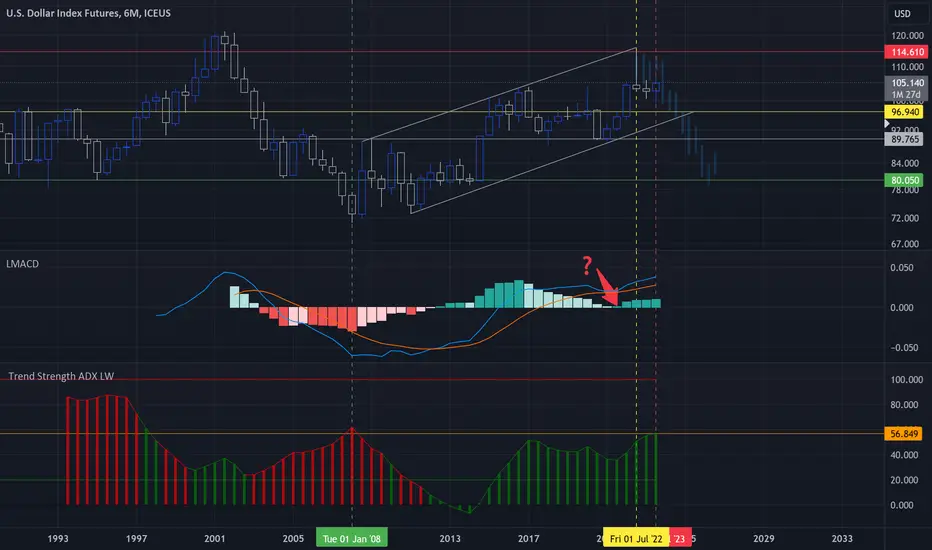
DXY The Fake Dance- One of the most important barometers for global currencies and markets in the world.
- Most of the time DXY is a well used machine to supress markets (forex, stocks, cryptos, etc..)
- When they don't start the printing machine, DXY keeps is strength.
- When they start to print DXY starts to dip and markets boom up.
- it's really basic and based on "BRRR Machine".
- i had a hard time to decrypt this fake peace of resilience.
- actually there's none visible divergences on the 1M or 3M Timeframes.
- So i decided to push my analysis to 6M Timeframe and noticed few things :
- You can notice that from 2008 ( Post crises ), DXY was in a perma bullish trend.
- So now check MACD and will notice this fake move on January 2021 ( in graph the red ? )
- MACD was about to cross down, columns smaller and smaller, then a Pump from nowhere lol.
- i rarely saw that in my trading life on a 6M Timeframe.
- So to understand more this trend, i used ADX (Average Directional Index)
- ADX is used to determine when the price is trending strongly.
- In many cases, it is the ultimate trend indicator.
- So if you look well ADX columns, you will notice that a strong divergence is on the way.
- First check the Yellow Doted Line in July 2022 when DXY reached 115ish and look the size of the green columns.
- Now check today (red doted Line), and look again the ADX green columns is higher, but DXY diped to 105ish.
- So like always, i can be wrong, but i bet on a fast DXY dip soon or later.
- it's possible to fake pumps, but it's harder to fake traders.
Happy Tr4Ding !
Perfect trade setup: $GLD to 325; DXY to 95Gold has been in a raging bull market since 2023 with the index making new higher highs and higher lows as shown in the weekly candle stick chart. In contrast the Dollar index TVC:DXY is making new lows every single day shown in dark blue line chart. In this blog space we have been continuously talking about the weakness in the Dollar and the major support and resistance levels in TVC:DXY for more than 3 months. As the TVC:DXY is below the psychological level of 100 and most probably heading lower where 95 is the key support level, I think the time for commodities like Gold has arrived. SPY Gold Spot ETF AMEX:GLD has made an ATH of 302 which is above the key psychological level of 300.
In my opinion AMEX:GLD is not done going up. If we plot the Fib retracement levels for the previous bear market ending in 2022, we see that AMEX:GLD can effectively reach 325 level which is the 4.236 fib level. This will indicate another 7% upside, a similar amount of potential downside in the $DXY.
Verdict: Long AMEX:GLD , Short TVC:DXY until trend reversal.

The DXY shows a downward tendency.In the long run, the implementation of tariffs will prompt trading partners to take countermeasures 😡, resulting in a contraction of the global trade scale 😔. American enterprises will face higher import costs for raw materials, and their export markets will be restricted, thus curbing the economic growth of the United States 😩. This will put depreciation pressure on the US dollar, causing the DXY to decline 📉.
U.S. Tariff Policies
Since April 9th, the United States has levied tariffs ranging from 10% to 25% on goods from China, the European Union, Canada, and other regions. These tariffs cover crucial sectors like automobiles, steel, and semiconductors 😒.
Countermeasures of Various Countries
China: On April 4th, China declared that it would impose a 34% tariff on U.S. goods starting from April 10th. Then, on April 9th, the tariff rate was further hiked to 84%, applying to all U.S. goods 😠.
The European Union: Announced that it would impose a 25% tariff on U.S. motorcycles, diamonds, and other goods as of May 16th 😤.
Canada: On April 9th, imposed a 25% retaliatory tariff on U.S. automobiles, while exempting auto parts 😏.
💰💰💰 DXY 💰💰💰
🎯 Sell@ 100 - 101
🎯 TP 98 - 97
Traders, if you're fond of this perspective or have your own insights regarding it, feel free to share in the comments. I'm really looking forward to reading your thoughts! 🤗
👇The accuracy rate of our daily signals has remained above 98% within a month! 📈 We sincerely welcome you to join our channel and share in the success with us! 👉

DXY for this week.uhhh, last time i kinda gave yall a short bias, it worked, now with these prices, i reckon it will reverse at that little 1H low i marked out there, or, it will literally smashed ts out of the 4H low i marked at the bottom
The impact of tariffs on the DXYIn the long term, the imposition of tariffs will trigger countermeasures from trading partners 😡, leading to a shrinkage of the global trade scale 😔. The import costs of raw materials for American enterprises will rise, and their export markets will be restricted, which will curb the economic growth of the United States 😩. This will exert depreciation pressure on the US dollar, causing the DXY to decline 📉.
U.S. Tariff Policies
Since April 9th, the United States has imposed tariffs ranging from 10% to 25% on goods from China, the European Union, Canada, and other regions, covering key sectors such as automobiles, steel, and semiconductors.😒
Countermeasures of Various Countries
China: On April 4th, China announced that it would impose a 34% tariff on U.S. goods starting from April 10th. On April 9th, the tariff rate was further increased to 84%, covering all U.S. goods.😠
The European Union: Announced that it would impose a 25% tariff on U.S. motorcycles, diamonds, and other goods starting from May 16th.😤
Canada: Imposed a 25% retaliatory tariff on U.S. automobiles on April 9th, but exempted auto parts.😏
This upward movement has led to the clearing of many traders' accounts or significant losses 😫. You can follow my signals and gradually recover your losses and achieve profitability 🌟.
💰💰💰 DXY 💰💰💰
🎯 Sell@103 - 100
🎯 TP 96 - 94
Traders, if you're fond of this perspective or have your own insights regarding it, feel free to share in the comments. I'm really looking forward to reading your thoughts! 🤗

4.11 Interpretation of gold technical ideas4.11 Interpretation of gold operation ideas: Gold prices rose sharply to a new high. How to trade next?
The daily line closed with a big positive line, and the closing price was far away from the previous high. This is a truly effective breakthrough!
There are two types of breakthroughs: 1. The amplitude and strength of the breakthrough! 2. The closing price after the breakthrough!
At present, the intraday pattern of gold prices is unbalanced. The rise and fall depends entirely on the international situation. The US dollar has fallen below 100 points, which has led to panic selling by investors and a sharp rise in gold prices. Therefore, if the situation eases, we must be wary of a rapid decline in gold prices. After a wave of accelerated rises in the morning, today's main focus is on the trend of the afternoon and US markets.
At present, the price of gold is hovering in the 3210 range. If it falls back, it is expected to rebound in the 3200-3190 range. If the European market breaks through the high for the second time and continues to strengthen during the day, then the US stock market will usher in a bullish opportunity again.
The market is always full of opportunities! The above strategies are for reference only, and personal opinions are for reference only. The specific operation is subject to real-time operation. If you want to obtain core member signals and increase account profits, please contact Ailen❤️❤️❤️

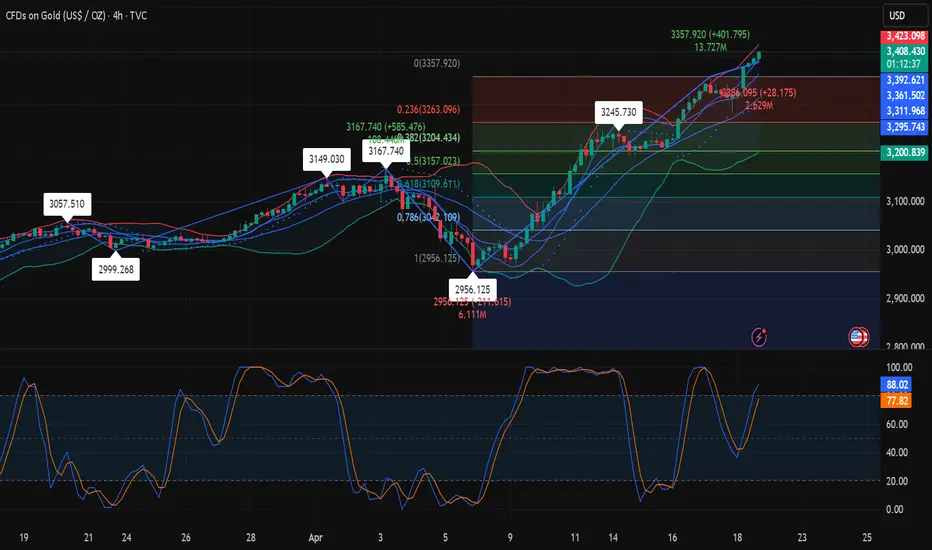
Gold continues to strengthen and fluctuates widely in the short Gold stabilized near the 200-period moving average at the beginning of this week, and the current upward trend is supported by the daily chart oscillator indicators. Both the daily RSI and MACD remain in the bullish range, with obvious momentum;
The upper target is concentrated in the 3167-3168 US dollar line, which is the historical high set at the beginning of this month; if it successfully breaks through this area, the gold price may enter a new upward channel.
In the short term, the support level below $3100 is concentrated in the 3065-3060 US dollar range, and a break below it will open a downward channel to $3000. The $3000 mark coincides with the 200-period moving average of the 4-hour chart, which is the key long-short dividing point;
If it falls below this point, it means that gold has entered the correction stage, and bulls need to remain vigilant; but the current fundamentals and market sentiment still strongly support the gold price to maintain high volatility.

Gold continues to rise and break through!Gold was driven by risk aversion news, and soared more than $100 in a single day yesterday, with a huge positive line on the daily line! At present, it has broken through the 3100 mark. It is difficult for gold to continue to be long and short. The next step is more of a big sweep!
At present, the 3100 mark will be the key to the next long and short positions. It is under pressure to continue to be bearish. The key 3055-50 area below is the long breakthrough point, which is also the support area for the two declines in the US market. Once it breaks down, it indicates that the rise started at 2970 yesterday has ended and returned to the short position.
If gold breaks upward and stands above the 3100 mark with the help of news, the long position will gradually rise to 3115-20 and 3135-40 (last Friday's high point) and even test the historical high of 3167 to build a daily double top!
Intraday operation:
The 3100 mark is used as a long-short boundary. If it breaks through, you can consider short-term long positions. After pulling up, refer to the above target position, which is also a resistance position, and arrange short positions again.

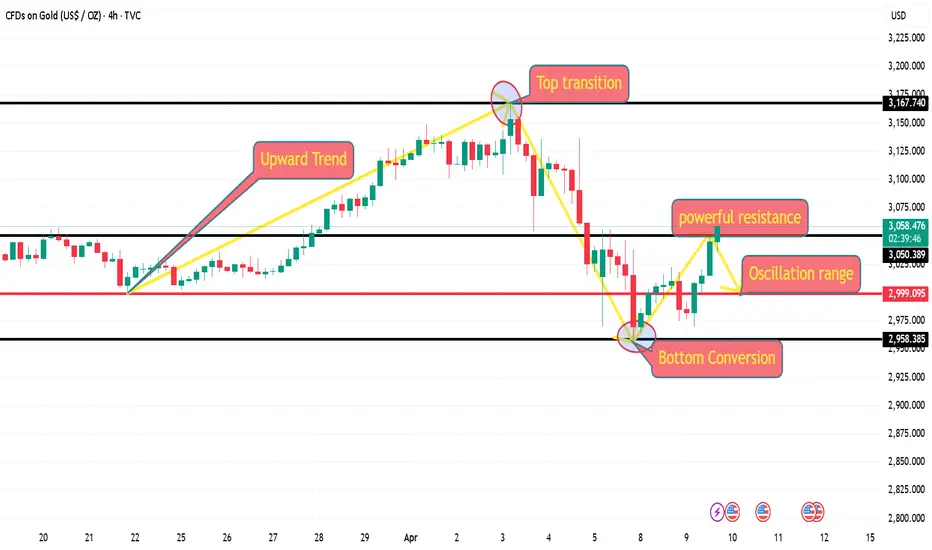
Technical analysis of short-term operations in the US market on 4,9 US trading operation interpretation ideas:
Today, there was a bottoming out and rebound. In the morning, it first went south and then north. It fell sharply to 2970 and then quickly counterattacked 3000 after entering the Asian session! I emphasized in the morning that the gold short may be coming to an end! It will enter a short-term sharp decline and then rebound! But the current trend is obvious that today's increase has exceeded expectations!
We must beware of the possibility of a V-reversal in the US market! Although the large-scale purchase of gold caused by the selling of US bonds is still difficult to confirm the long position in the US market!
The intraday increase is close to 90 points! There may be two emotions.
1: The market impact after the tariffs are implemented has not been eliminated
2: If the bullish trend continues in the US market, it may retreat to around 3045 in the future, and continue to be bullish later!
Short-term support: 3045---3030----3000
Pressure level: 3075---3080---3100---3135

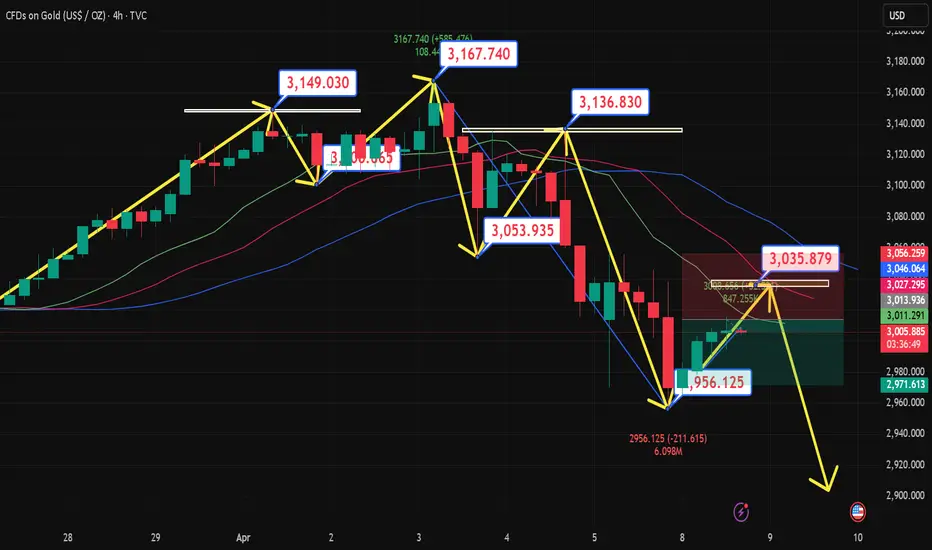
4.9 Gold price trend after the Fed meetingIn the early European session, spot gold maintained its amazing intraday gains, and the current price is around $3046/oz, up $64 on the day.
Gold's latest technical trading analysis:
Gold's recent sharp decline from its all-time high has stalled near the 61.8% Fibonacci retracement level of the February-April rally. The support level is around the $2957-2956/oz area, or the multi-week low hit on Monday, followed by the 50-day moving average (currently around $2952/oz). If gold falls below the latter, it will be seen as a new trigger by bearish traders and drag gold to the next important support level around $2920/oz, and then all the way down to $2900/oz.
On the other hand, the momentum of gold breaking through the overnight high (around the $3023/oz area) could push gold prices to the $3055-3056/oz barrier. Some follow-up buying should pave the way for gold to return to the $3,100/oz mark, with some intermediate barriers around $3,075-3,080/oz.
Support: 3,030 3,018 3,000
Resistance: 3,045 3,068 3,080
We will update regularly every day to introduce how we manage active thinking and settings. Thank you for your likes, comments and attention. Thank you very much
4.9 Technical analysis of short-term gold operations!Gold market analysis
Gold idea: We need to pay attention to whether the daily line will rise after reaching a low. The daily line is hovering at the bottom. In a volatile market, we must find a range of volatility. Finding the rhythm is the most important thing. Yesterday, the daily line formed a cross star again. Today, the white market is expected to fluctuate. In addition, there are many fundamentals in the near future. The market has been led by the rhythm. Gold rose well before. The sharp drop was also due to Trump’s tariff policy. The global tariff war is inevitable in the future. It will support the US dollar in the long term and suppress gold. The short-term top of the weekly line may be a long-term top.
Today’s idea: Let’s focus on the 2969-3022 volatility range. If the white market rebounds first and approaches 3022, go short first. On the contrary, if gold breaks and stands on 3022, it will also fluctuate, but the center of gravity of the volatility will rise to the 3000-3055 range. The volatility requires patience to wait for the position, and waiting is also part of the transaction.
Support level: 2990-2969,
Pressure: 3022 3035

4.9 gold rebound increases resistance level and continues shortiFundamentals:
On Tuesday (April 8), the price of gold fluctuated slightly higher in the early US trading. The market is currently expecting a continuous decline, and at the same time paying attention to the logic of short selling at resistance points. After briefly hitting a four-week low on Monday, the price of gold rebounded quickly and rebounded strongly to above $3,000 in the Asian and European trading on Tuesday.
Against this background, gold, as the ultimate safe-haven asset with "zero credit risk", has once again become the main allocation target of market funds. Every macro policy imbalance and external shock will bring cyclical buying to gold, and this time the intensity may be stronger. The current gold price has stabilized at the psychological level of $3,000 and is showing a short-term rising structure. From a technical perspective, the gold price in the daily chart quickly rose after stepping back on the Fibonacci 61.8% retracement level ($2,956), showing the resilience of buying. If the gold price breaks through the short-term resistance of $3,020, the upward target will be the $3,055 and $3,080 areas, and further may rise to the $3,100 mark. The key support level below is still around $2956. If it fails, it may test the 50-day moving average support (about $2947). Once this level is lost, it may trigger more technical selling pressure. The biggest variable facing the current market is no longer inflation data, but the destructive impact of Trump's tariff increase on the global trade pattern. The Fed's policy space is opening up rapidly. Driven by the expectation of interest rate cuts and risk aversion demand, gold not only stabilizes the $3,000 mark, but is also likely to re-enter the main upward trend.
Personal operation analysis:
Trend: shock trend
Support: 3000----2983------2965
Resistance: 3008-----3030-------3050
Strategy:
Viewpoint logic:
Short view near 3030, stop loss 3036, take profit near 3000----2970, and track stop loss 300 points.

4.8 Gold continues to run at a low point!Gold stabilized and rebounded on Tuesday (April 8), with an intraday increase of nearly 1%, successfully recovering the losses of the previous trading day. The rebound ended the three-day correction trend, and the gold price rebounded significantly from the key support level of $2,955. The current market focus is on the evolution of the Fed's policy path and the geopolitical trade situation. Under the interweaving of long and short factors, the short-term volatility of gold has risen significantly.
Fundamentals: The struggle between risk aversion and interest rate expectations
The rebound of gold at the beginning of this week was mainly driven by two factors:
1. The escalation of geopolitical trade risks
US President Trump's recent remarks on tariffs have triggered market concerns about the renewed tension in the global trade system.
2. The Fed's interest rate expectations fluctuated sharply
The interest rate futures market has undergone dramatic changes this week: On Monday, the market once bet that the Fed would cut interest rates five times in 2025, a significant shift from the expectation of "one or no interest rate cut" a week ago.
3. The coordination of the US dollar and capital flows
The US dollar index weakened slightly on Tuesday, reducing the cost of holding gold for non-US investors.
Technical aspect: Attack and defense of key support level
From the perspective of the market structure, the trend of gold this week showed typical "sharp drop and slow rise" characteristics:
Support confirmation: On Monday, the gold price accurately tested the support of $2955 and then rebounded. This position corresponds to the neckline of the platform that broke through in mid-March, and formed a double defense line with the 55-day moving average (US$2930). The intraday lows were densely bought, indicating that medium- and long-term investors viewed the correction as an opportunity to build positions.
Resistance distribution: The first resistance above is at US$3040 (daily line R1), and after breaking through, it may test US$3057 (March 20 pivot point) and US$3097 (R2). The historical high of US$3167 is still a psychological barrier, but it is difficult to challenge it directly in the short term.
In the short term, the trend of gold will depend on two major catalysts: 1. The minutes of the Fed's March meeting on Wednesday: If the minutes suggest an open attitude towards rate cuts, it may push gold prices to test the $3,050-3,070 range; conversely, if the emphasis is on inflation stickiness, it may trigger long profit-taking. 2. Progress in trade negotiations: Any substantive implementation or easing of tariff policies may trigger fluctuations of more than 5% in gold prices. In the medium term, the upward trend of gold has not been broken. Institutional research reports show that the current global central bank's demand for gold purchases is still at a historical high, and in the downward cycle of interest rates, the relative attractiveness of interest-free assets will continue to stand out. If the technical side breaks through $3,057, it will open up space for the impact of the previous high; the defense strength of the $2,950-2,930 area needs to be closely monitored below.
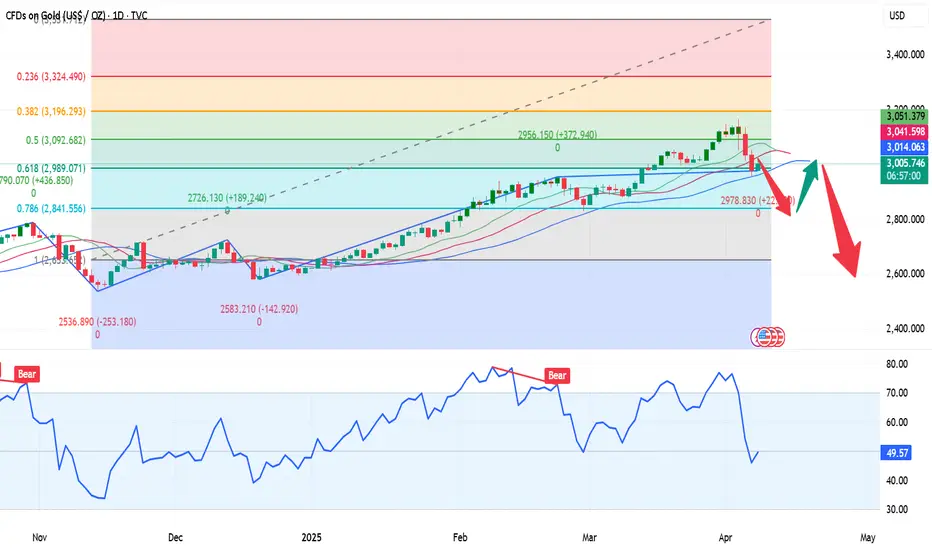
4.8 Technical analysis of short-term gold operations!Spot gold rebounded slightly during the Asian session on Tuesday (April 8), once rising above the 3,000 mark, and is currently trading around $2,995.51 per ounce. Spot gold may rebound to $3,049 per ounce, as the price has previously completed a five-wave cycle starting from $3,168.
Analysts pointed out that the peak of wave d is around $3,049, which can be used as a rebound target. It is still difficult to judge whether this cycle is an impulse wave cycle or a correction wave cycle.
If it is an impulse wave cycle, it means that the downward trend will extend to well below $2,950. The correction wave cycle shows that despite the sharp drop from $3,168, the upward trend from $2,831 remains intact.
The information shown on the daily chart is very clear. The sharp drop in the past few days seems to be driven by wave (4), which may end near the strong support level of $2,970. The next wave (5) will push the upward trend above $3167.
Resistance level: 3015----3038-----3050
Pressure level: 3000---29833-----2970
4.8 Interpretation of gold short-term operation ideasGold price has fallen below the previous row support band in the daily trend. The K-line continues to be under pressure from the short-term moving average and maintains a weaker trend of shock. In the short term, pay attention to the pressure band around 3030. In the 4-hour level trend, the K-line is currently under pressure from the short-term moving average and is maintaining a low-level shock repair. The strength and continuation of the intraday rebound are not too large. Pay attention to the continued downward trend after a small break in the 4-hour level trend. At present, after continuous shocks in the small-level cycle trend, the technical pattern has begun to gradually adjust. The K-line has begun to slowly stand on the short-term moving average and tends to have a certain rebound space in the short-term trend. Pay attention to the short-term adjustment.
Operational suggestions:
Short near 3017-8, stop loss 3023.9, or long near 2945-6, stop loss 2939.1.
Real-time market intraday guidance.
We will update regularly every day to introduce to you how we manage active ideas and settings. Thank you for your likes, comments and attention. Thank you very much
