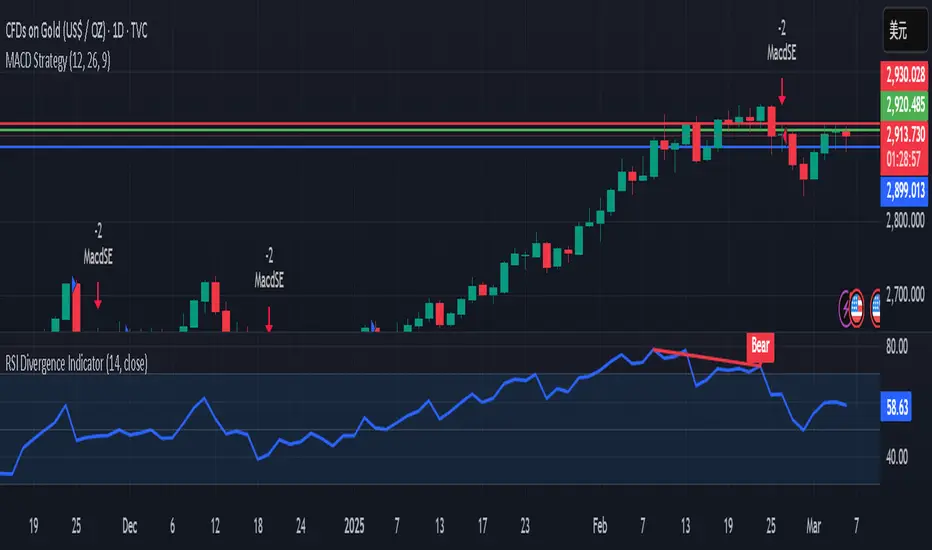
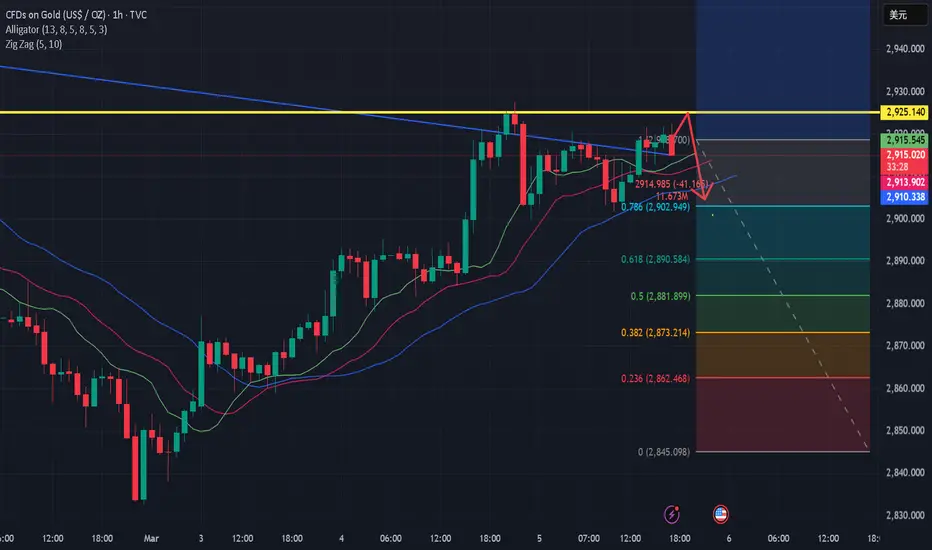
3.11 Gold’s short-term signal resistance levels are mixedSpot gold rebounded slightly in the Asian session on Tuesday (March 11) and is currently trading around $2,896.52 per ounce.
The technical signals of spot gold are a bit mixed. It has successfully stabilized near the support level of $2,879 per ounce and started to rebound. The focus on the resistance near 2,915 is on the top.
Between March 4 and March 7, a temporary top was formed in the range of $2,894 to $2,927. This indicates that the target is $2,861. However, after a brief confirmation, the top became invalid as the price of gold climbed above the neckline of the pattern at $2,894.
The rebound increases the possibility of resuming the upward trend from $2,832. A breakthrough of $2,909 will be seen as a strong signal to resume the upward trend.
Before the price of gold climbs above $2,915, the price of gold may still be biased to the downside, as the current rebound may just be a correction to the top, and the correction is a bit excessive.
On the daily chart, gold is also neutral in the range of $2891 to $2934, similar to the situation on the hourly chart.
When gold moves out of the range, the signal will become clearer. The wave pattern suggests that the market may experience a small decline first, followed by a strong rebound.
Dxyshort!!!!!!!!!!!!!

3.11 Analysis of gold short-term operation suggestionsOn Monday (March 10), the latest spot gold (XAU/USD) was quoted at $2915.01, up 0.10% on the day. In the Asian session, the gold price remained in a narrow range around $2914, but since 15:25 Beijing time, gold has fluctuated downward from $2915.39, reaching a low of $2896.73.
Fundamental analysis: The Fed's interest rate meeting is approaching, and the market is cautiously watching
At present, the gold market has entered a sideways consolidation phase, and investors are evaluating multiple factors, including the Fed's upcoming policy meeting on March 19 and the latest economic statements of US President Trump. In an interview with the media, Trump said that the US economy is in a "transition" stage, and the market has generally believed that the US economy is at risk of recession.
Market sentiment and capital flows: Short-term funds are cautious, and gold is still supported
Technical analysis: Long and short divergences are increasing, key support and resistance levels
From a technical perspective, the gold price is currently consolidating around $2890. The key resistance above is the intraday high of $2918.19, followed by the intraday R1 resistance of $2927 and the R2 resistance of $2945. If the gold price breaks through $2945, the market may challenge the historical high of $2956 set on February 24.
In terms of support below, the $2900 integer mark and the S1 support level of $2893 constitute double support. If it falls below this area, the gold price may test the S2 support level of $2878. Technical analysts believe that if Trump does not release additional tariff policy signals in the near future, market sentiment may gradually stabilize, and gold may pull back to the support range in the short term to accumulate power for subsequent gains.
Conclusion: Short-term consolidation, pay attention to the dynamics of the Federal Reserve
Overall, gold is currently maintaining a range of fluctuations, and the short-term trend is subject to the expectations of the Federal Reserve meeting and the uncertainty of the US economic outlook. Investors need to focus on the interest rate meeting on March 19 and the impact of the remarks of Federal Reserve officials on market sentiment in the coming weeks. In the current context, the market still tends to look for buying opportunities in pullbacks. If the gold price remains above $2,893, the bulls will still have a certain advantage.

3.11When will gold break out of its range?Will gold continue to adjust downward after the wash, or will it break upward after this period of consolidation?
1: Trump announced on the 7th that Russia launched a fierce attack on Ukraine. In order to encourage the two sides to sit down at the negotiating table for friendly negotiations, sanctions and tariffs will be imposed on Russia, including banks, until both sides are willing to stop the exchange of fire. This has increased the uncertainty of geopolitical risks, which will be a boost for gold.
2: Fed Chairman Powell reiterated at a press conference on Friday that the current US economic performance is relatively ideal, and the Fed does not intend to rush to cut interest rates next. As we all know, interest rate cuts will stimulate gold to rise, and slowing down the pace of interest rate cuts will form resistance for gold.
Since gold entered the adjustment on February 11, the repeated high-level roller coaster shock wash has been brewing for a month, and it is time to end. The gold price has repeatedly fluctuated around $2,900, and even the non-agricultural data failed to break the support of $2,890 and the pressure of $2,930.
As for gold, the focus is still on $2890 as the support point. As long as it is not lost here, it is still mainly based on reaching the bottom of the box. For players of physical gold, it is not recommended to repeatedly get on and off the gold when the funds are idle. It seems smart but will eventually miss it perfectly.
Trading strategy:
You can consider getting on the train within the range of 2900-2895, and defend below 2880 US dollars. The focus above is on the breakthrough of the 2920-30 pressure area.

3.10 Gold short-term operation analysis and suggestionsIn early Asian trading on Monday (March 10), spot gold fluctuated in a narrow range and is currently trading around $2,912.60 per ounce. Gold prices have fluctuated at high levels for three consecutive trading days, but they still rose 1.65% on a weekly basis, helped by safe-haven inflows and the U.S. employment report showing that job growth in February was lower than expected, suggesting that the Federal Reserve is expected to cut interest rates this year. In addition, the volatile tariff policy of U.S. President Trump has also increased uncertainty.
Gold continues to fluctuate in a range, and the overall trend is in an upward trend. After the adjustment, the price of gold will continue to rise. The idea is to continue to step back on low-multiple operations. Pay attention to the 2898 support during the day. Relying on this position, short-term long, stop loss 2889, stop profit at 2922/2932. Breaking the 2932 suppression is expected to further rush to a new high.
In addition, if it falls below the support near 2889, coupled with the recent strength of the U.S. dollar, gold may fall further, so if it falls below the support, don't consider continuing to go long, pay attention to the risk.
March 10th gold short-term trading: long near 2898, stop loss 2889, take profit 2922/2932
Backup ideas: (fall below 2889, rebound to 2896 and continue to short, stop loss 2904, take profit 2880-2876)

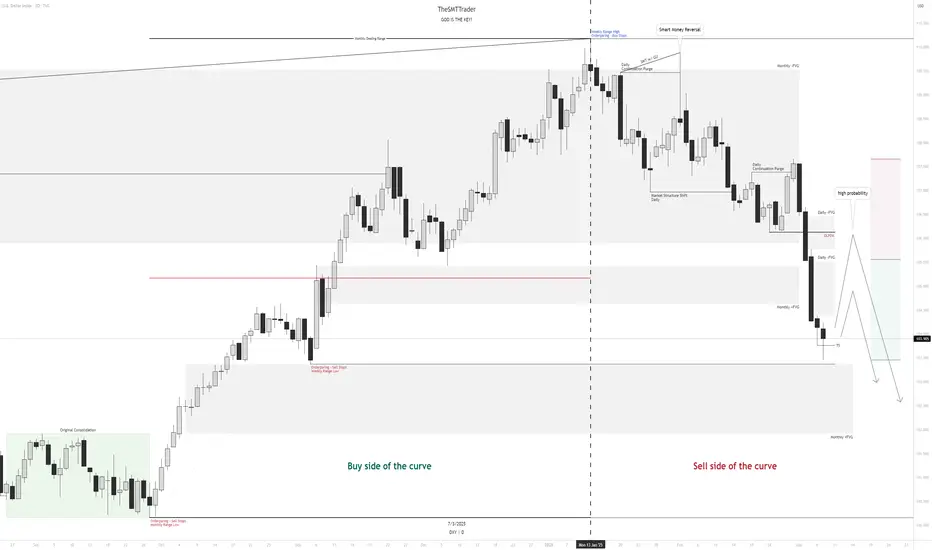
$DXY MMSMIn my view, the DXY could have a bullish bias this week, but only as a correction after last week's sharp drop. The main bias is still bearish, as we are on the sell side of the curve. Therefore, long trades should be approached with caution since the price can reverse to the downside at any moment—after all, the market is sovereign, and only it determines its movements.
I remain firmly bearish until the monthly range lows are taken out. I will only reconsider this outlook if the price holds at a high-timeframe PDA and institutional order flow (IOF) signals a potential shift in direction.
DXY will be fine (95)The dollar index expects to fall into the 95 area. Regardless of who wins tomorrow, the dollar will fall until 2025. The new government's realization of how sad everything is now will delay the process of a sound market. Vote!

Dollar idex is ready to drop next week are you ready ?This week, the market was slow with little movement. However, starting next week, keep an eye on the dollar. The order flow is showing a strong sell, and the daily chart reveals an FVG that indicates a sell from this level. Additionally, the current low aligns with the monthly FVG level. Trading next week should be exciting!
3.7 Gold short-term non-agricultural comingFundamental analysis
Tariff policy shows signs of easing, but risks have not been completely eliminated
Recently, the United States has postponed the implementation of the auto import tariff plan for Canada and Mexico, which has eased the economic and trade tensions in North America to a certain extent. However, this postponement is not indefinite. More importantly, import tariffs in other countries and regions are still in the process of being prepared or implemented, and potential uncertainties may still erupt again at any time. Driven by a series of previous tariff policy news, gold prices have repeatedly received safe-haven support. Although there is a slight correction at present, it is still near the historical relative high.
Technical analyst interpretation:
Currently, gold is fluctuating around $2,900/ounce. Overall, bullish confidence remains solid, but it also faces a large technical barrier in the short term. The following are several key observation points:
Key levels and support and resistance
Intraday key level: $2,914/ounce
If this position can be effectively broken through, it may attract more bulls to enter the market and pave the way for further impact of $2,934/ounce (R1).
R1 resistance during the day: $2934/oz
If the gold price breaks through this level, the next target will be $2950/oz (R2), and approach the historical high of $2956/oz on February 24. Once it approaches this high again, the market may experience a new round of violent fluctuations.
S1 support below: $2899/oz, coinciding with the $2900/oz mark
This area is a short-term long-short watershed. Once the shorts successfully suppress the price below $2900/oz, the bullish sentiment is vulnerable, and the risk of a short-term correction will also increase significantly. If it effectively falls below $2899/oz, the gold price may continue to fall to $2879/oz (S2), which is another possible long defensive position.
High consolidation and correction risk
From the overall market situation, the gold price has been strong since the end of last year, constantly refreshing the interim highs. However, as the market digests the Fed's expectations of rate cuts, bullish sentiment may be blunted at the current position. In addition, if the ECB or the United States' policy expectations change again, causing funds to reassess the prospects of global economic recovery and monetary policy, gold may also face certain pressure to fall from highs.
Pay attention to the operation of gold prices in the range of $2,900-2,934/ounce: If the bulls continue to fail to break upward, it is advisable to be alert to the potential correction caused by high-level profit-taking; and once the positive news is released, the possibility of gold prices quickly breaking through $2,934/ounce and heading straight to the $2,950-2,956/ounce area cannot be ignored.
3.6 Technical Analysis of Short-term Gold OperationsThe US ADP employment data for February fell sharply. The market expected 140,000, but only 70,000 were released last night, which was cut in half. This data is not surprising. Since Musk established the efficiency department at the oval table on January 20, a large number of government employees have been reduced, and the reduction in employment is reasonable.
However, the consensus is that the number of employed people will decrease, which is good for gold, and washing the market has become a routine operation. After the data was released, gold not only did not rise, but fell rapidly, all the way to $2,894, and it seemed that it was about to fall by a waterfall. At that time, I said internally that we should be careful of the double kill of longs and shorts, but it was pulled back to above $2,920 in the late trading.
In 1 hour, the US market quickly returned to the top and bottom conversion of $2,894 last night. After this retracement, it was pulled up again, indicating that the market bulls are still dominant, but the current market is still dominated by fluctuations, not a unilateral rise, so try to avoid chasing more and wait for the decline before intervening.
Today, the dividing point is still 2895-2900. We will continue to go long after the pullback. The upper target is 2920-2935 US dollars. The US dollar has begun to weaken. Gold is just in the process of brewing. The single negative on the weekly line does not form a stage top.

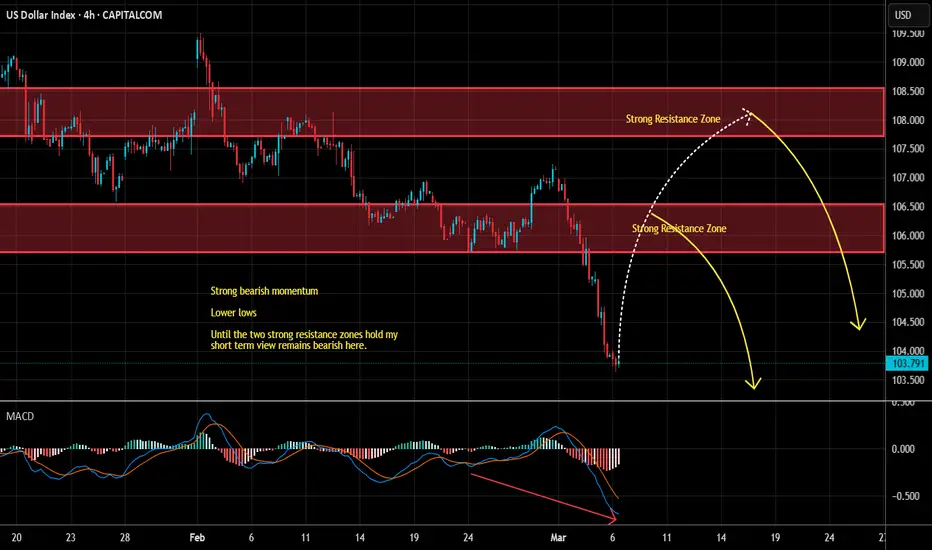
US Dollar Index Short Term Sell IdeaH4 - Strong bearish momentum
Lower lows
Until the two strong resistance zones hold my short term view remains bearish here.
3.5 Technical Analysis of Short-term Gold OperationsThe non-farm payrolls (NFP) and consumer price index (CPI) data to be released this week will be the focus of market attention. If the data is strong, especially the inflation data is higher than expected, the market may reduce the bet on the Fed to cut interest rates. The market currently expects the Fed to cut interest rates by 75 basis points this year, an increase from the 44 basis points expected last week.
Gold Technical Analysis - Daily Chart
From the daily chart, gold received support near $2,832 last Friday and rebounded to $2,900 driven by tariff concerns. However, from this time frame, market information is limited, so it is necessary to further zoom in on the analysis period to get more details.

3.5 Technical analysis of gold short-term operation Key point 25Looking back at the overall market, gold has rebounded for two consecutive days, but from the perspective of the morphological structure, it is not yet in a state of reversal. Beware of the risk of a fall after a surge.
From the perspective of the one-hour and four-hour structures, the overall trend is still in a downward trend. Although there has been a strong rebound in the past two days, the rebound is not a reversal.
Today, we need to focus on $2925, which is 680 yuan, as the dividing line between today's long and short turns. Below this area, given the rebound in the past two days, I think we can try to go south to see a fall. Refer to the 2895 or 2880 area below.
However, if the box continues to oscillate today and closes above $680 or $2925, it will bottom out and turn to long! At that time, we will adjust our thinking and look north to see new highs!
Note that the short-term market is approaching a turning point, and 2925 needs to be paid attention to.
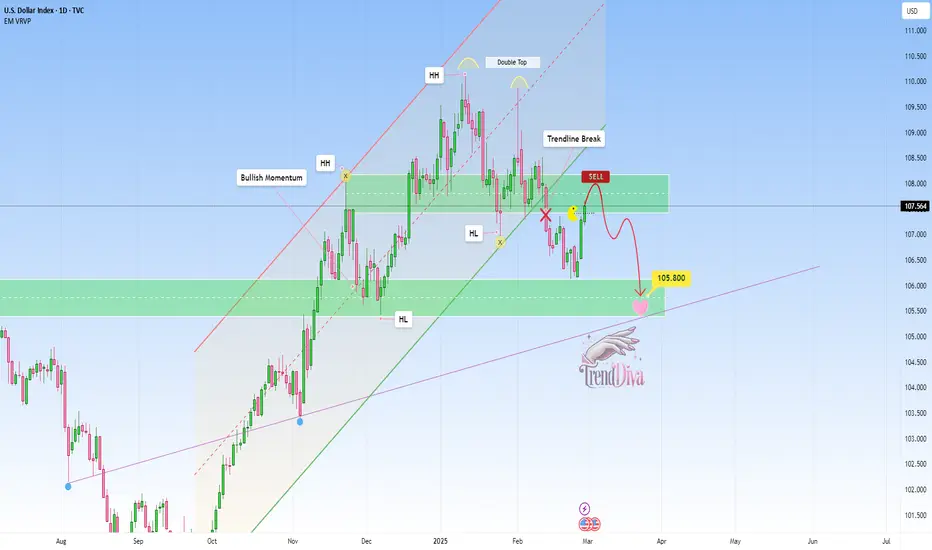
US DOLLAR: Sell Opportunity after support breakTVC:DXY has broken below a key support zone, indicating a potential shift in momentum. The price is now retesting this zone, which previously acted as support and could serve as resistance, aligning with a potential bearish continuation.
If sellers confirm resistance at this level, the price is likely to decline further toward the 105.800 target , which aligns with a major support level. Conversely, a breakout above the zone could signal further upside.
Before considering short positions, look for bearish confirmation signals such as bearish engulfing candles, strong wicks rejecting the resistance zone, or increased selling volume.
Just my take on support and resistance zones—not financial advice. Always confirm your setups and trade with solid risk management.
Best of luck!
3.5 Technical analysis of short-term gold operationsOn the first trading day of March, the US dollar index fell sharply. Data released by ISM showed that the US ISM manufacturing index in February was 50.3, lower than the expected 50.8, and the previous value in January was 50.9. 50 is the dividing line between prosperity and recession. Although the ISM manufacturing PMI continued to expand in January, the amplitude was small and tended to stagnate. Both new orders and employment shrank. At the same time, the material purchasing price index soared to the highest level since June 2022. After the data was released, the US dollar index fell further.
Gold rebounded sharply, challenging the 10-day moving average. The 5-day and 10-day moving averages still showed a dead cross. The daily RSI rebounded and reached the key pressure zone of 2900-10 in 4 hours. The short-term trend turned to bullish, but it was still not a strong bull market. You can wait for the opportunity to stabilize and go long near 2875.

3.4 Short-term operation of gold within the dayIn February, gold closed with a long upper shadow line, the MACD indicator golden cross high volume, and the dynamic indicator SRO hooked up into the overbought area, indicating that the monthly line is still bullish. At the current monthly level, we focus on the support of the MA5 moving average and the strong support of the MA10 moving average, which correspond to 2763 and 2647 respectively.
The weekly line fell last week, including the previous day's positive column to form a negative cover, so the gold price will continue to weaken this week. The 2936-42 above the weekly line is a short-term top suppression, and the low point of last week is 2832. If it falls this week, it will definitely break the low point of last week. The current support below is the MA10 moving average near 2802, and the middle track support is 2732.
The daily line is more interesting: after the bottoming out and rebounding last Friday, the big positive pulled up yesterday; if the price continues to rebound and repair, then today's low will not exceed yesterday's low of 2857-58, and the current moving average MA60 supports near 2861. The upper pressure is at the middle track 2902-2910. The daily indicator macd is dead cross at high level and runs with large volume, and the smart indicator sto is repaired upward, which represents the daily level of shock.
The current macd is running at a low golden cross with large volume in 4 hours, and the smart indicator sto is entering the overbought area upward, which means that the current 4-hour shock is strong. At present, the upper pressure of the 4-hour is also at the intersection of the moving average MA60 and the upper track at 2913-14.
The current macd at high golden cross of the hourly line shrinks and sticks, and the smart indicator sto is repaired downward, which means that the hourly line is currently oscillating and tends to fall back. The current support is 2879, followed by 2870-58.
In summary:
During the day, we will mainly focus on yesterday's low point of 2857-58. If it is not broken, we can go long near 2867-68. In the short term, we can go long in the 2883-80 range in the Asian session, and the target is 2900-2910. The first short position is also in the 2909-20 range.
Strategy:
Go long in the 2880-83 range in the Asian session, defend 2875, and target 2890-2900-2910
Go long near 2866-68 during the day, defend 2858, and the target remains unchanged
Go short near 2909-12 during the day, defend 2918, and target 2900-2892

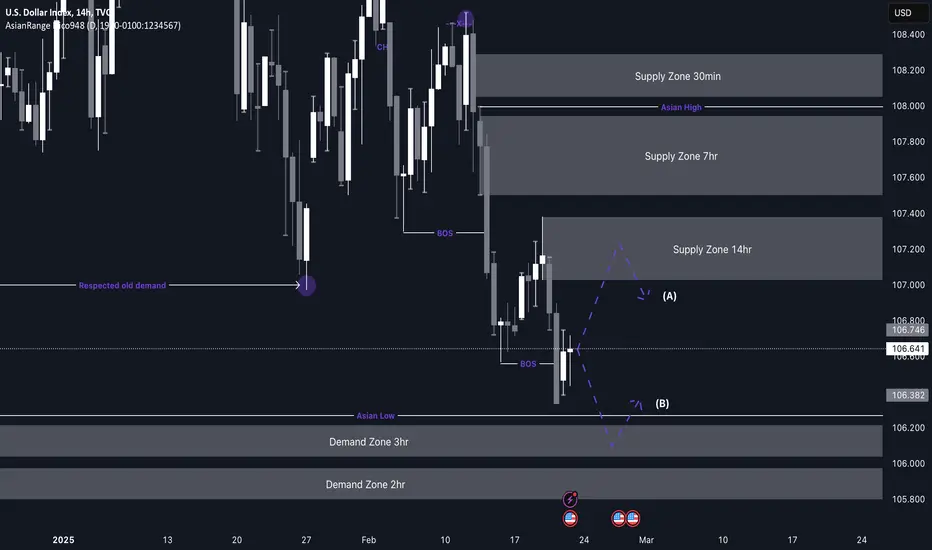
DXY weekly Perspective 23.02.25DXY Analysis & Bias for This Week
My outlook for the Dollar Index (DXY) remains bearish, which aligns with my bias for bullish moves on pairs like GU, EU, and Gold. Since price has already broken structure to the downside, I anticipate a retracement to mitigate the newly formed 14-hour supply zone before continuing lower.
While price may react bullishly from the 3-hour or 2-hour demand zones I’ve marked, the overall momentum still favors the downside, as seen from the strength of recent bearish candlesticks.
Plan of Action:
📌 Once price reaches the 14-hour supply zone, I will wait for lower timeframe confirmations before taking action.
📌 I will also check for any corresponding demand zones on my other pairs to ensure alignment across the board.
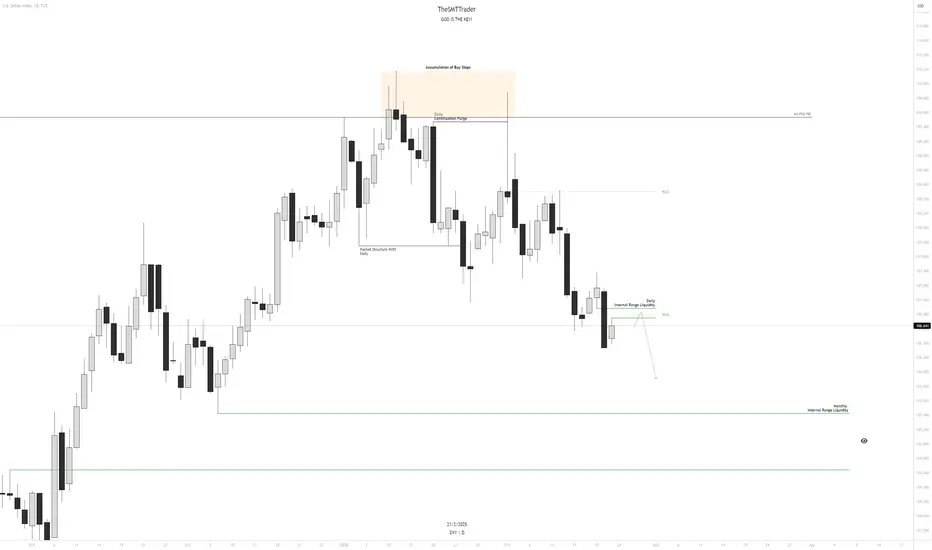
$DXY IdeaFor the DXY, we have an initial outlook of seeking internal liquidity in the discounted region of the monthly range, further reinforcing our bearish trend. Additionally, the presence of a **bottom SMT** in bonds, within a **bullish PDA**, suggests an upward movement for them.
Short swing trade set up developingI can see a good short trade opportunity developing.
1)The price sharply dropped below the major support/resistance zone around 107 area and retraced up gently within the ascending parallel channel to fill the fair value gap.
2)The current 4H candle is moving below the bottom parallel channel. (developing)
3) MACD is in the bear zone and it looks like it is about to cross to the downside (but not confirmed).
4) RSI is also in the bear zone and it is starting to cross to the downside.

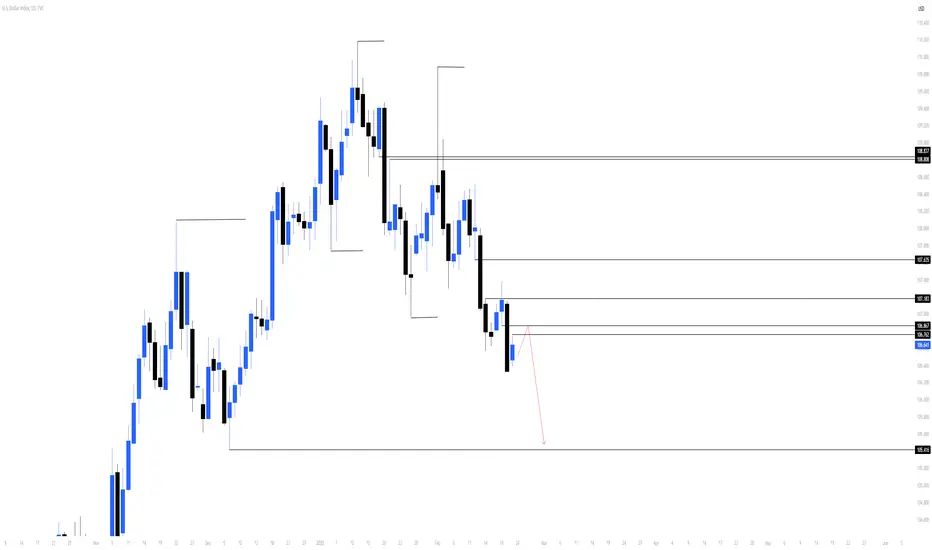
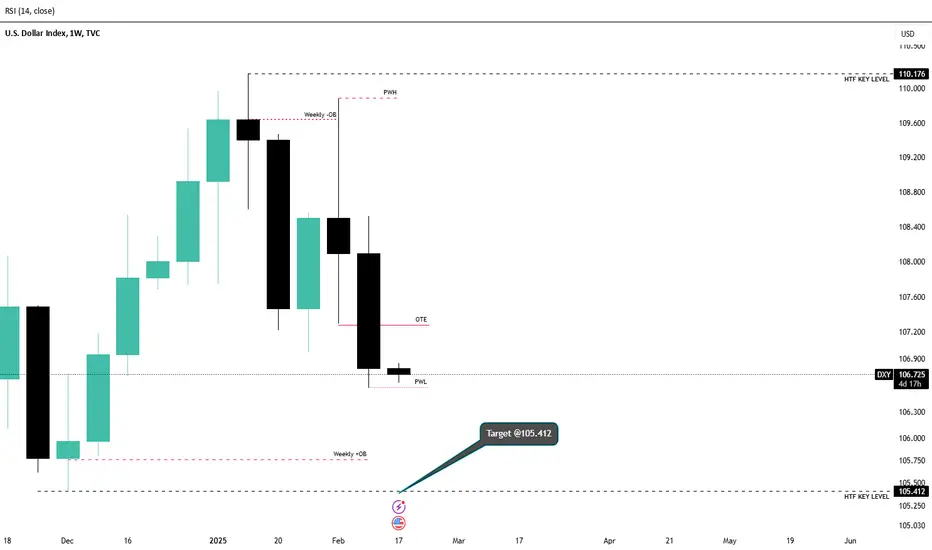
DXY Weekly BiasMy bias for this index is bearish and the price might target the Sellside Liquidity at 105.4. My Optimum Trade Entry would be around the 107.28 Zone.
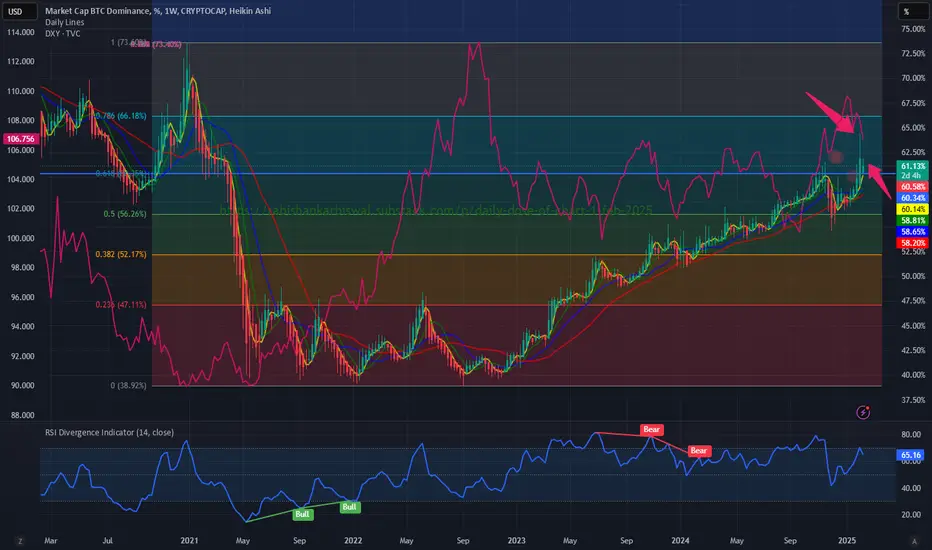
$BTC.D and $DXY are in diametrically opposite directionsIn this blog space we have been discussing Bitcoin Dominance ( CRYPTOCAP:BTC.D ) since Dec 2024. On 9th Feb 2025 I posted a blog where we discussed the Fib Retracement levels in CRYPTOCAP:BTC.D chart and we said that we can expect more upside and has broken past 0.618. I said it is possible that the dominance can reach the 0.786 Fib level at 66.12%.
I tried to plot the Dollar index TVC:DXY in the same weekly chart as CRYPTOCAP:BTC.D and it was quite surprising that the FIB retracement levels in CRYPTOCAP:BTC.D are the same as the top to the bottom levels in the TVC:DXY chart. We are looking at the last 5 years for our analysis.
When CRYPTOCAP:BTC.D has broken past 0.618 Fib level and trying to reach 0.786 @66.12%. But the TVC:DXY has broken below 0.786 and in the near term the TVC:DXY level can end up at 0.618 Fib levels which can take TVC:DXY to 104.
So, in the near to medium term is CRYPTOCAP:BTC.D @ 66.12% and TVC:DXY @ 104.
Scenario on DXY 13.2.2025I would see the dollar index like this if I was considering going short I would first consider going above the monthly level of 108.048 if the market continued then I have one more SFP at a price around 108.6 if I was going to talk about a long position then first around the monthly level of 107.053 then the next one below the daily level of 106.724.

#DXY 1DAYDXY (1D Timeframe) Analysis
Market Structure:
The price has broken below the uptrend support, signaling a potential shift from bullish to bearish momentum. This breakdown indicates that buyers were unable to sustain the upward trend, leading to increased selling pressure. Additionally, a sell engulfing candlestick has formed, further confirming bearish sentiment.
Forecast:
A sell opportunity is expected as the breakdown of uptrend support and the sell engulfing pattern suggest further downside movement.
Key Levels to Watch:
- Entry Zone: After a confirmed breakdown and possible retest of the broken support as resistance.
- Risk Management:
- Stop Loss: Placed above the broken support or recent swing high.
- Take Profit: Target lower support zones for potential downside movement.
Market Sentiment:
The combination of the uptrend support breakdown and a sell engulfing pattern indicates that bearish momentum is increasing. Waiting for confirmation of continued selling pressure will help align with the prevailing market trend.

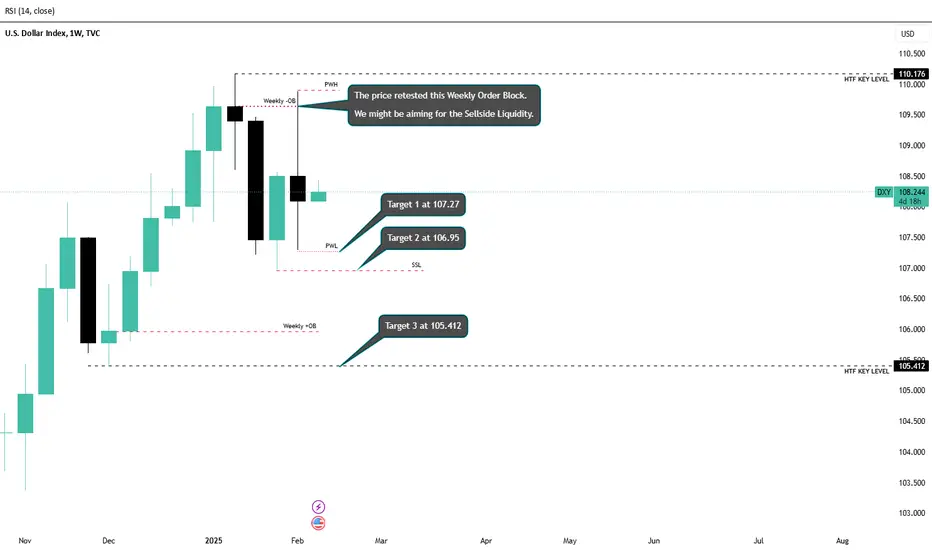
DXY Weekly BiasMy bias for this index is bearish considering that we retested and confirmed the Weekly Bearish Order Block at 109.65.
I do anticipate that the index might be attracted towards Sellside Liquidity at 107.27, 106.95 ,and 105.4.
Our daily setup will further give us the best entry and stop loss.