6.26 Gold intraday analysis guideOn Wednesday (June 25), international spot gold rose slightly during the US trading session, but was still suppressed by the 20-day moving average (US$3,355). The RSI (14) was at 48.7, in the neutral range of 40-60, suggesting that the market lacks a clear direction. US$3,355 (20-day moving average) has become the recent watershed between long and short positions. If it breaks through this level, it may test the psychological barrier of US$3,400. The support below is US$3,245 (the low point on May 29). If it fails, it may drop to the integer level of 3,200 and US$3,121 (the low point on May 15). Stability of the geopolitical situation: If the ceasefire agreement in the Middle East continues, the outflow of safe-haven funds may further suppress the gold price. Fed policy expectations: If the July non-agricultural and CPI data show that inflation is cooling down, it may rekindle expectations of interest rate cuts and boost gold. The current gold market is in a "wait-and-see mode", and both long and short sides lack decisive momentum. Traders need to pay close attention to: US economic data: especially employment and inflation indicators for the Fed's policy path. Geopolitical dynamics: Any breakdown of the ceasefire agreement could quickly push up safe-haven demand. Dollar trend: If the Fed maintains a hawkish stance, a stronger dollar may further suppress gold prices. Gold is expected to maintain range fluctuations in the short term, with the $3,355 moving average resistance and $3,245 support forming a key trading range. The direction of the breakthrough depends on new fundamental catalysts.
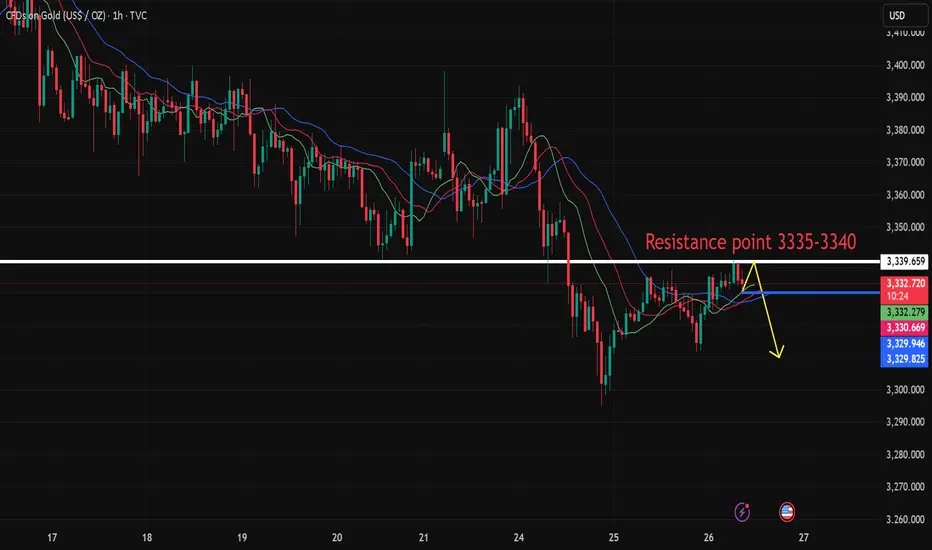
Personal operation analysis:
Trend: Oscillating trend
Support: Near 3,300.00
Resistance: Near 3,335.50
Strategy:
View logic: Short view near 3,335-3,340, stop loss 3,345, take profit near 3,300--3,280, and follow the stop loss 300 points.
Dxyshort
Gold breaks down and moves downward, focus on the 3300 markWith the official ceasefire between Iran and Israel, although there are some repeated frictions in the middle, under Trump's mediation, both parties are relatively tolerant. It seems that the war has been declared over. Gold has also fallen sharply. In the early trading, it fell sharply to around 3333 and stabilized. After rebounding to around 3357, it fell again under pressure. During the European trading session, it broke the low and continued. It repeated around 3317/8 and fell again under pressure around 3332. This position has become the key pressure point for the current top and bottom conversion. In the evening, the testimony of Federal Reserve Chairman Powell was also relatively cautious. He believed that inflation had declined, but it was still far from the 2% target. He tended to adjust interest rates after inflation achieved the target. Therefore, the double pressure caused gold to rebound weakly and repeatedly run weakly. At present, the lowest level reached 3304, which is one step away from the 3300 mark. Judging from the current trend, the overall weak pattern continues. In the evening, relying on the 3300 mark, try a long order for the last time, and then do a good job of continuing defense after the break.
6/24 Gold Evening Reference Ideas
Gold is long near 3303/05, defend 3298, target 3320/3330, short at 3298, defend 3305, target near 3276, short at 3330, defend 3337, watch 3316/08
24th JuneTA: Many confluences for a bearish bias. Only confirmation needed for high probability price action is running (closing below 4H SL) on 1H. We have to exercise some caution, because price is still in the area of the monthly sweep. For a trade PA has to give us optimal behaviour.
News: Powell testifies at 10:00am. This could lead to a very quick move below the swept monthly low.
Continue to short after the rebound on 6.24Judging from the current market trend, the upper short-term resistance is around 3343-48, the lower short-term support is around 3310-15, the short-term long-short strength watershed is 3300-05, the daily level is under pressure and continues to see suppression and adjustment, and the main tone should actually be rebound shorting.
Gold operation strategy:
Gold rebounds to 3343-48 and shorts, stop loss 3356, target 3317-3323, continue to hold if it breaks;
6.24 Gold safe haven fades and gold falls
Technical aspect: After the gold price hit the 3400 integer mark overnight, it fell rapidly under the impetus of negative news. The overall fluctuation range is still within the 3330-3400 range we expected. This shows that the current market dominated by news lacks continuity. We make a golden section of the high and low points of the overnight decline to the current level, and the current position of 0.618 is 3370.
Pressure level: 3370\3375\3400
Support level: 3330\3300
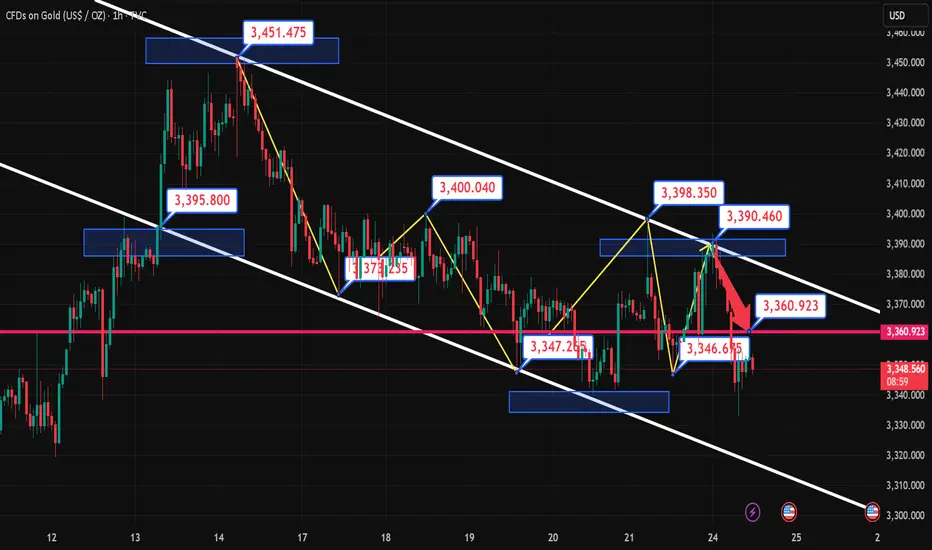
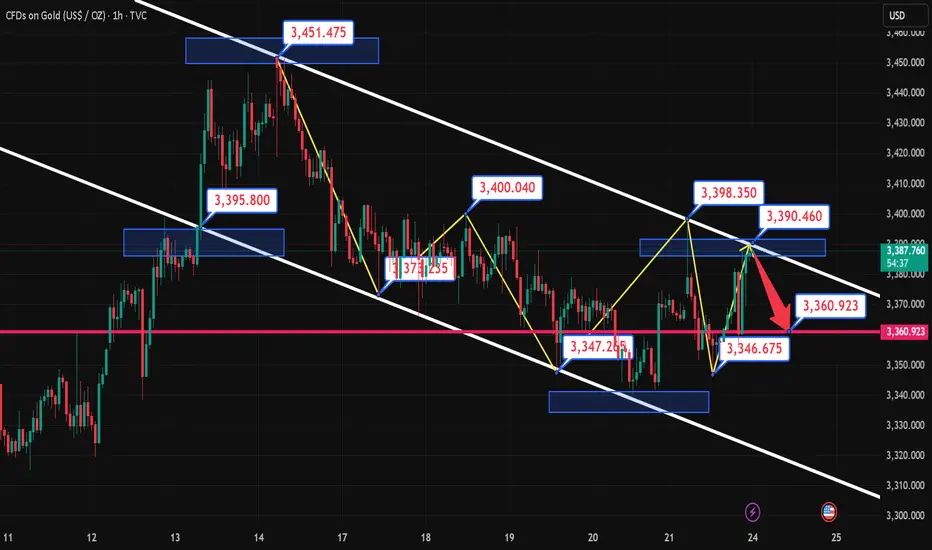
6.24 Gold resistance strengthens + kinetic energy exhaustionGold prices have fallen under pressure near $3,380 several times, and this area gathers three technical resistances:
1. The daily Bollinger band middle track 3,375 and the upper track 3,450 form a suppression.
2. The previous high of $3,400 plus the Fibonacci 38.2% retracement level constitutes a concentrated selling pressure area.
3. The previous high of $3,451 failed to break through effectively, forming a bearish structure with the second highest point moving down.
Risk of breaking the shock range: Gold continues to trade sideways in the 3,300-3,450 range, but the K-line continues to close in a small real body alternating yin and yang pattern, indicating that the long and short momentum is exhausted. If it falls below 3,350 , a technical sell-off will be triggered, with the target pointing to 3,300-3,330!
SELL: 3,388\3,393 Stop loss: 3,398
Target: 3,360
Profit point: 30
6.23 Gold Short-term Technical AnalysisStimulated by geopolitical conflicts such as the US airstrike on Iran's nuclear facilities on Monday, gold opened $24 higher at 3398 in the early trading. However, it failed to continue the upward trend and quickly fell back to the 3360-65 area. Retrieve all the gains!
Technical analysis: 4-hour head and shoulders top pattern: right shoulder 3373 neckline 3340 MACD dead cross diverges downward Bollinger band opening expansion and price running near the lower track, short-term trend is bearish, and the daily line is still in the rising channel!
Short-term operation:
SELL: 3375\3385 Stop loss: 3390
$1:3360 $2:3340
BUY: 3338\3345 Stop loss: 3353
$1:3380 $2:3400
Operation suggestion: High-altitude is the main, low-multiple is the radiation
6.23 Gold Short-term Technical GuidanceThe current price is in the double-line interval of 3350-3375 on the hourly chart. Please note that the four-hour lifeline 3368 is also the resistance point determined by the last rebound in the Asian session.
The Asian session fell under pressure and returned to the sweeping range. It was treated as a sweep. The European session was able to hold the 3350 mark. Look up to find the 3368 area, followed by 3375 and 3385-3388.
If the European session falls below and closes below 3350, the short-selling forces are dominant. The four-hour lifeline 3368 is used as suppression. Look down to find 3333-3331, followed by 3320-3315
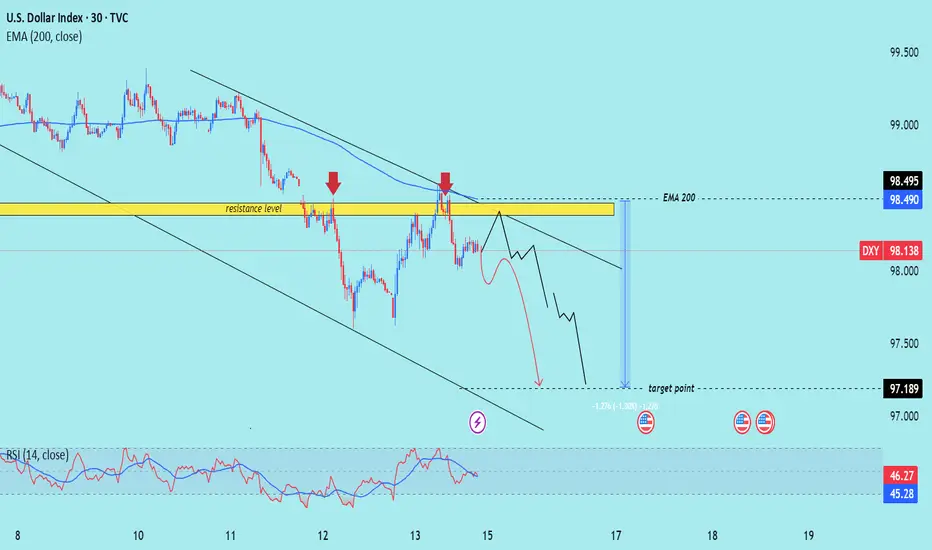
Index/US) Bearish trend analysis Read The caption)SMC trading point update
Technical analysis of U.S. Dollar Index (DXY) on the 30-minute timeframe, with the price respecting a clear downtrend and repeatedly rejecting a resistance zone near the 200 EMA.
---
Analysis Breakdown
Key Technical Elements:
1. Downtrend Structure:
The price remains within a descending channel.
Multiple lower highs and lower lows signal sustained bearish pressure.
2. Resistance Zone:
Highlighted near 98.490–98.495, aligned with the EMA 200.
Multiple rejections from this level (indicated by red arrows), confirming strong supply.
3. EMA 200 (98.490):
Acts as dynamic resistance.
Price is below it, reinforcing the bearish bias.
4. Projected Move:
Bearish price path targets the 97.189 level (target point).
A measured move of approximately -1.30% is illustrated.
5. RSI (14):
RSI currently at 46.27, below the neutral 50 mark.
This confirms bearish momentum without being oversold, leaving room for further downside.
---
Bearish Thesis:
Repeated failure to break above key resistance + downward channel + RSI weakness suggests a continuation to the downside.
Short-term consolidation expected before breakdown continuation.
---
Trade Idea Concept:
Entry: Sell on a minor pullback near resistance (~98.300–98.490), or breakdown below the recent minor support.
Target: 97.189 zone.
Stop Loss: Above 98.500 or EMA 200 to invalidate the bearish setup.
Mr SMC Trading point
Risks to Watch:
A break and strong close above 98.500 would invalidate the bearish structure and could initiate a trend reversal.
Economic events (noted by calendar icons) may trigger volatility – ideal to monitor closely around those times.
plesse support boost 🚀 this analysis)
The gold trend is perfectly in line with expectations.The recent trend of gold is consistent with my expectations. Overall, the rebound is mainly based on fluctuating downward, and the rhythm of the oscillation between long and short positions is perfectly grasped. The upper resistance is still strong, and gold can still be shorted if the rebound is not broken.
From the current analysis of the gold trend, the lower support focuses on the area around 3315-3305. If it falls back to this position range, continue to look at the continuation of the rebound upward; the upper resistance focuses on the area around 3350-3362. The overall rhythm of the high-altitude and low-multiple range is still maintained, and the strategy is mainly to participate in the range back and forth.
1. Go long when gold falls back to 3315-3305, and the target is 3330-3340;
2. Go short when gold rebounds to 3350-3360, and the target is 3340-3330.
DXY DownHaven't posted here in quite awhile, however just have been following trends watching bonds, stocks and bitcoin/gold. Looking at the DXY it appears to have fallen below the 100-101 level support and has since been rejected by that region on a weekly time frame. The support/resistance levels and trends line within have been charted for years and left unchanged. RSI is in the oversold territory but that can remain low for quite a long time, especially if the trend changes. I think the DXY goes to 90 over the next 6 months to 1 year.
Bullish for stocks, bitcoin, gold etc. Who is the fastest horse?
DXY Analysis Next Week After Market OpenUS tariff policy is becoming a key variable affecting the Fed's interest rate policy. Current tax policies are facing negative reactions and declining support rates, creating pressure on the US government to promote trade agreements and implement tax cuts to stabilize the economy.
At the FOMC monetary policy meeting in May, the Fed kept interest rates unchanged, showing a cautious stance on inflation risks and low unemployment rates. The latest employment figures show that the possibility of the Fed keeping interest rates unchanged at the June meeting is very high.
As inventory accumulation can increase inflation, the Fed will wait for a clearer assessment of the impact of tax policies before making a decision. Accordingly, the possibility of the Fed cutting interest rates up to 3 times in the second half of the year is low.
The US dollar is expected to continue to decline to adjust
Best regards StarrOne !!!
BEARS STILL IN CHARGE ! DXY- USD INDEX FORECAST Q2 W22 Y25DXY USD INDEX FORECAST Q2 W22 Y25
BEARS CRUSHING THE USD!
Professional Risk Managers 👋
Welcome back to another FRGNT chart update📈
Diving into some Forex setups using predominantly higher time frame order blocks alongside confirmation breaks of structure.
✅ U.S. dollar index is a measure of the value of the dollar against a basket of six foreign currencies.
✅The currencies are the Euro, Swiss franc, Japanese yen, Canadian dollar, British pound, and Swedish krona.
🔑 Remember, to participate in trading comes always with a degree of risk, therefore as professional risk managers it remains vital that we stick to our risk management plan as well as our trading strategies.
Pairs to look out for -
EURUSD - BUY
USDCHF - SELL
USDJPY - SELL
USDCAD - SELL
GBPUSD - BUY
- Perhaps it's time to accept that a recovery in the DXY is not occurring anytime soon...
📈The rest, we leave to the balance of probabilities.
💡Fail to plan. Plan to fail.
🏆It has always been that simple.
❤️Good luck with your trading journey, I shall see you at the very top.
🎯Trade consistent, FRGNT X
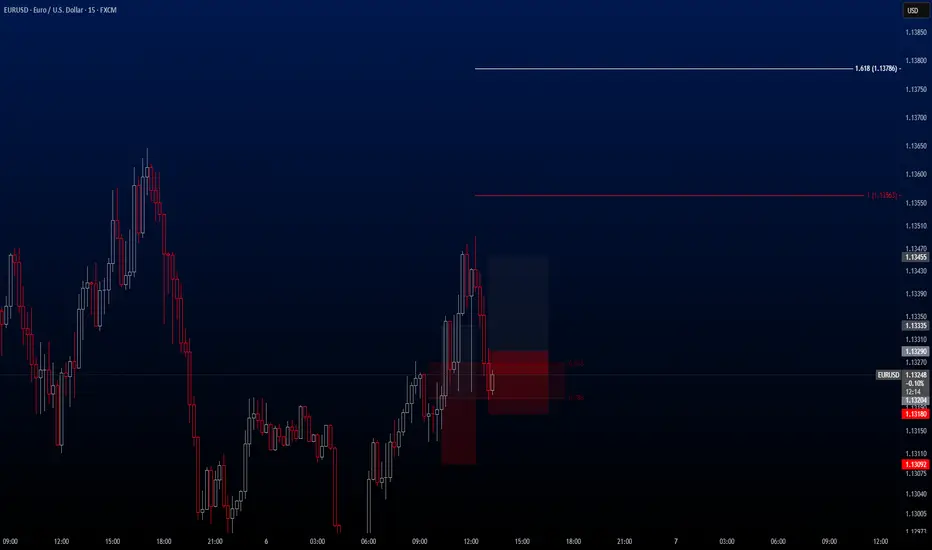
EURUSD EURUSD presents another buy opportunity, and I've just activated the trade.
I wanted to share it with you as well. This trade has three different Take Profit levels, which are:
1.13455 / 1.13563 / 1.13786
However, I personally plan to close the trade at 1.13455 in order to stick to my game plan.
This will be the last trade of the day for me.
🔍 Criteria:
✔️ Timeframe: 15M
✔️ Risk-to-Reward Ratio: 1:1.50 / 1:2.50 / 1:4.50
✔️ Trade Direction: Buy
✔️ Entry Price: 1.13290
✔️ Take Profit: 1.13455
✔️ Stop Loss: 1.13180
🔔 Disclaimer: This is not financial advice. It's a trade I’m taking based on my own system, shared purely for educational purposes.
📌 If you're also interested in systematic and data-driven trading strategies:
💡 Don’t forget to follow the page and subscribe to stay updated on future analyses.
EURUSDHello everyone!
I'd like to share an ideal **Buy opportunity** on the **EURUSD** pair with you. The trade is currently **active** on my side.
🔍 **Criteria:**
✔️ Timeframe: 15M
✔️ Risk-to-Reward Ratio: 1:1.17
✔️ Trade Direction: Buy
✔️ Entry Price: 1.13204
✔️ Take Profit: 1.13335
✔️ Stop Loss: 1.13092
🔔 **Disclaimer:** This is not financial advice. It's a trade I’m taking based on my own system, shared purely for educational purposes.
📌 If you're also interested in systematic and data-driven trading strategies:
💡 Don’t forget to follow the page and subscribe to stay updated on future analyses.

Technical analysis of short-term gold operations!!!On Wednesday, the gold price generally showed a downward trend. The highest price rose to 3327.91 on the day, and the lowest price fell to 3266.79, closing at 3288.16. In view of the fact that gold fell under pressure during the early trading on Wednesday and broke through the four-hour and daily support as expected, and then the US market rebounded again and came under pressure, and finally ended in a big negative state at the daily level. The price has fallen below the daily support, so we need to pay attention to the continuation of the band decline in the future.
From a multi-cycle analysis, first observe the monthly rhythm. The price rose for three months in the early stage and then a single-month correction appeared. Recently, it has risen for four months and then a single-month correction appeared. Therefore, according to the rhythm, four consecutive positives have appeared. For May, we must pay attention to market risks. From the weekly level, the gold price is supported by the support level of the 3040 area. From the perspective of the medium-term, we can continue to maintain a bullish view, and the price drop is only a correction in the medium-term rise. From the daily level, the current price resistance is in the 3007 area, which is the key watershed of the band trend. If the price is below this position, the subsequent band will be treated as short. At the same time, for the short-term four-hour price resistance, it is around 3290, so the subsequent price will be treated as short under the four-hour resistance. In general, the price can be treated as short under the four-hour resistance and the daily resistance.
Gold opens up callback space as expectedGold finally broke through the rhythm of continuous fluctuations in the morning and ushered in a relatively large correction.
After the cyclical retracement in the morning, a bottom-breaking market was formed. Generally, for a direct decline in the Asian session, we will put the watershed at the opening price, which is the current high point of 3290! But it is not very meaningful to look at this position now. According to the recent rhythm of Asian session decline, weak European session, and rebound in the US session. We can look at the second decline in the European session rebound.
But we should be more cautious in the US session. Especially in the second half of the US session,
Intraday short-term pressure: 3266-70 top and bottom conversion position below: hourly double bottom around 3211-3195 "Observe whether there is a key area for the signal of stopping the decline"
DXY Forecast: More Bearish OrderflowThis week, I anticipate further downside movement on the DXY, with price potentially reaching a key area of interest—a bullish order block. While the reaction at this level remains uncertain, my current bias remains bearish unless a break of structure to the upside signals a continuation of the bullish trend.

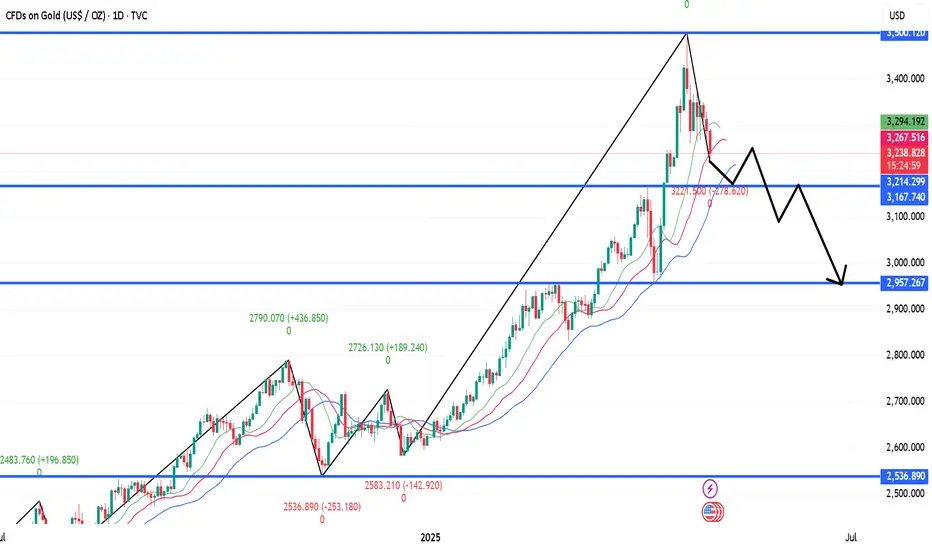
Gold is forming a head and shoulders pattern!Analysis and interpretation:
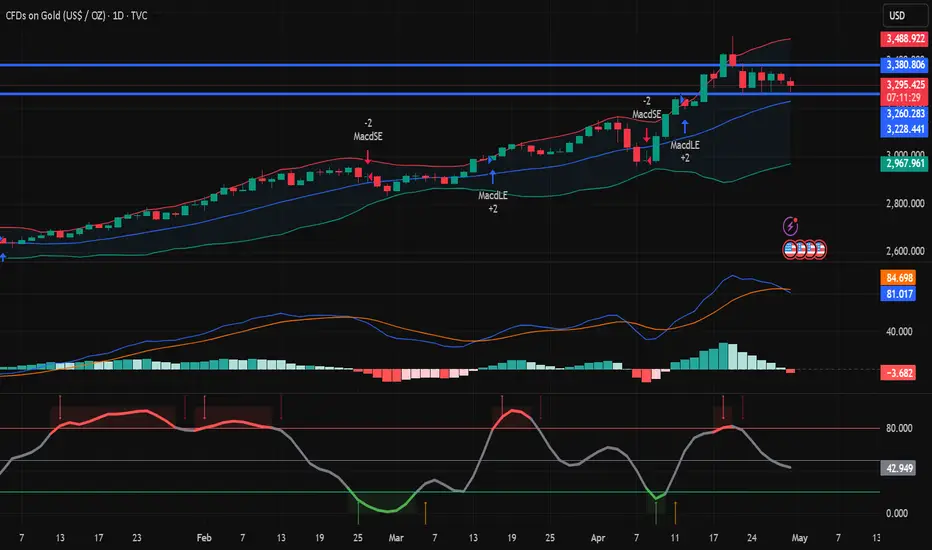
Gold prices have been on a strong upward trend since the beginning of 2025. The daily chart shows that gold prices have climbed from around $2,600 to around the $3,500 mark. Recently, gold prices have formed a consolidation trend in the range of $3,260 to $3,380, indicating that the bulls and bears are fighting fiercely here. It can be seen from the K-line chart that gold prices fell back after hitting a record high of $3,499.83 in April, but then gained support and rebounded at $3,260.
The Bollinger Band indicator shows that the upper track is at $3,465.75, the middle track is at $3,191.92, and the lower track is $2,918.08. The current price is running between the upper and middle tracks, indicating that the medium-term upward trend is still maintained. Although the gold price may fluctuate in the range of $3,260 to $3,380 in the short term, the overall upward trend has not changed.
The MACD indicator shows that DIFF is 81.35, DEA is 84.74, and the MACD value is -6.80. The histogram shows a shrinking state, indicating that the upward momentum has weakened, but no obvious short signal has been formed. The RSI indicator is around 58.81, which is in the neutral to strong area, and has not reached the overbought or oversold level, and there is still room for growth.
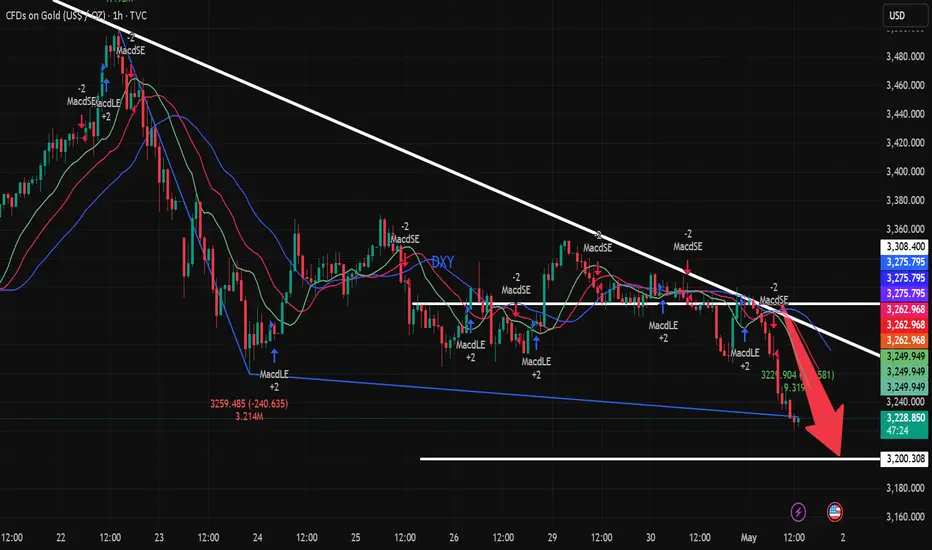
Gold falls as expected, awaiting guidance from ADPGold continued to fluctuate in 1 hour. Now, the gold fluctuation is most likely a relay of decline. Gold rebounds and continues to be short. The gold 1-hour moving average gradually begins to stick together, but it is still diverging downward. If it continues to cross downward to form a dead cross, then there is still room for gold shorts to fall. Gold hit a high twice and was suppressed by the 3330 line. Today, gold continued to be short at highs under the pressure of 3330.
Gold bulls continue to rebound every time. Now gold bulls obviously have no confidence in further rise, so gold shorts take the opportunity to exert their strength. Gold is still the home of shorts, and gold rebounds and continues to be short.
US trading operation ideas:
Gold 3320 short, stop loss 3330, target 3300-3290;
Gold maintains a volatile range, pay attention to subsequent breOn Tuesday, the gold price generally showed a downward trend. The highest price rose to 3348.45 on the day, and the lowest price fell to 3299.49, closing at 3316.95. On Tuesday, gold was under pressure during the early trading session, and then the price continued to fluctuate during the European and US trading sessions. Overall, the price is still running within the fluctuation range, but once the daily support is broken, it is expected to break the lower edge of the range.
From the multi-cycle analysis, first observe the monthly rhythm. The price rose for three months before and then a single-month correction occurred. Recently, it has risen for four months and then a single-month correction occurred. Therefore, according to the rhythm, April is generally bullish, but for May, we must pay attention to market risks. From the weekly level, the gold price is supported by the support level of the 3040 area. So from the perspective of the mid-line, we can continue to maintain a bullish view. From the daily level, the current price is supported by the 3004 area support. This position is the key watershed of the band trend. The market will further break down in the future, so it will be focused on in the future. At the same time, for the short-term four-hour price, it has been fluctuating up and down at the four-hour key position recently. Pay attention to the resistance of 3387 and 3370 on the top, and the 3260 area on the bottom. Before the data, the market as a whole tends to fluctuate temporarily. After breaking through the daily support, pay attention to the performance of breaking down the lower edge of the range.
Interpretation of technical ideas for short-term gold trading onGold opened this week in a volatile market. It opened high and fell on Monday. The US market rose above the high opening position. It fell in the Asian market on Tuesday. The European and American markets fluctuated and adjusted. The main reason is that the data this week is concentrated in the second half of the week. From the past market, this week's rebound did not touch 3370, so it cannot be treated as strong. It did not fall below the bottom support of 3260. The overall trend is convergent and volatile. Now the technical indicators are in a sticky posture, and the three lines of the Bollinger Bands are also closed. The Asian market mainly focuses on the continuation of volatility. The upper side focuses on the resistance of the hourly Bollinger Band upper rail 3330, and the lower support is at 3300.
Pay attention to the operation of the range at noon. If the gold price touches 3300 below, participate in long orders with a light position. With a small loss, look at the target of the upper rail pressure of the Bollinger Band at 3330; if there is a rebound before the European market that touches the upper rail of the Bollinger Band at 3330, you can try to arrange a short position to be bearish, and the target is whether 3300 can be broken. The small non-farm data will be released before the U.S. market opens, followed by the PCE data. At that time, I will re-position my position based on the data release and wait for the data release to help gold prices move out of the range of volatility.

Gold's shock trend and interpretation of US market thinkingGold continues to fluctuate, we continue to look down in the European session, try long orders near 82;
2025-4-29 Tuesday Gold Asia-Europe long and short strategies
The market is always changing, the only constant is the existence of risks.
Keeping the principal is always the first principle.
◆Short order◆
Aggressive: short near 3356, stop loss 7 points, short at 62-68 after breaking,
Stop loss: stop loss 7 points each, or unified stop loss 77. Target: 3286-69-54-42, continue to reduce holdings after breaking
◆Long order◆
Aggressive: long at 82, stop loss 7 points, long at 75-70 after breaking,
Stop loss: stop loss 7 points each, or unified stop loss 62. Target: 98-06-12, continue to reduce holdings after breaking;
Steady: 66 long, stop loss 7 points, 58-52 long after breaking,
Stop loss: 7 points for each stop loss, or a unified stop loss of 42. Target: 98-06-12, continue to reduce holdings if the position breaks;
【Today's long orders must be promptly protected after profit, and the next position will be entered after the principal is protected】
Stop loss is determined according to your actual tolerance. Protect in time after profit, and enter the next position after protection】
★ Pattern analysis and attention:
Daily strategy ideas: Asia and Europe, our current price 06 long orders are also given to around 22 as expected. We are still bearish if the resistance is not broken, and try 82 long orders
【Reference: Russia-Ukraine peace talks, US-Japan tariff negotiations】
【Data: wholesale inventory rate, consumer confidence index, job vacancies】
☆ There is a delay in posting, and the final operation is based on real-time strategy and current price orders. Please continue to pay attention;
☆ Strategy orders are divided into warehouses, and the total position shall not exceed 20%;
