DXY Dollar Index Next Move ?Pair : DXY Index
Description :
Divergence
Break of Structure
Rising Wedge as an Correction Pattern it will Reject from the Upper Trend Line
Completed " 12345 " Impulsive Wave
Bearish Channel with the Breakout of the UTL and Retracement
Dxysignals

DXY Channel Up targets the January High. Sell if 4HMA100 breaks.The U.S. Dollar Index is headed towards critical crossroads as the 105.650 January 06 High is the most important Resistance with relation to the long-term trend. If broken the medium-term bullish trend transitions to the long-term.
The February Channel Up is supported by the 4H MA100 (green trend-line). If broken, we will take a sell targeting the 4H MA200 at 103.700. If we close a 4H candle below it, we will re-sell and target just above the Support Zone at 102.700.
-------------------------------------------------------------------------------
** Please LIKE 👍, FOLLOW ✅, SHARE 🙌 and COMMENT ✍ if you enjoy this idea! Also share your ideas and charts in the comments section below! **
-------------------------------------------------------------------------------
💸💸💸💸💸💸
👇 👇 👇 👇 👇 👇

DXY Index Next Possible MovePair : DXY Index
Description :
Divergence
Rising Wedge as an Corrective Pattern with the Breakout of the Lower Trend Line
Break of Structure will Fall to Complete the Retest at the Previous Highs
Completed " 123 " Impulsive Waves

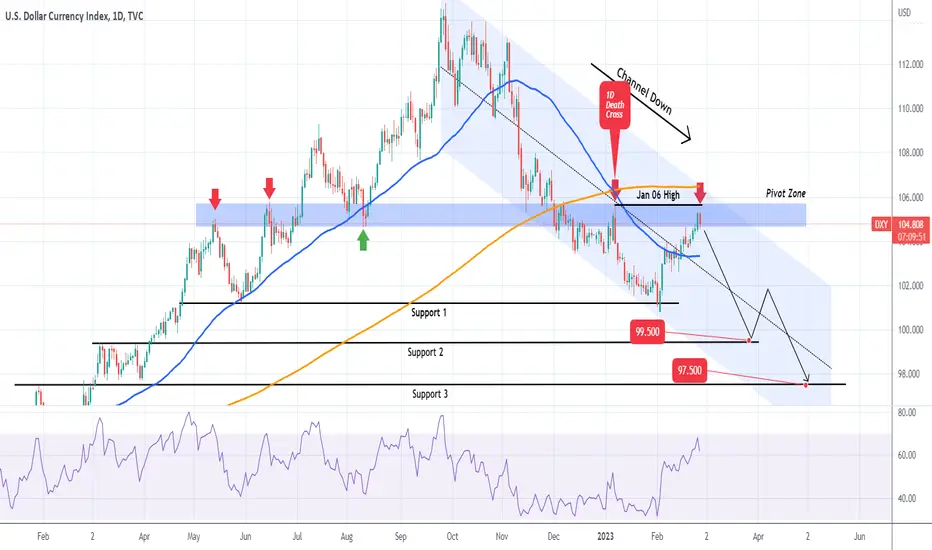
DXY Potential Double Top. Sell opportunity.The U.S. Dollar Index (DXY) came close o the 105.650 Resistance of the January 06 High and currently has been rejected. This was a level that failed to break above the 1D MA200 (orange trend-line), which is holding as Resistance since December and is also inside the Pivot Zone that formed three rejections and one rebound since May 13 2022.
With the RSI almost breaching into the overbought zone (70.00) and getting rejected, it is very likely that the 105.650 Resistance will turn into a Double Top and reject the price lower. With the long-term pattern since the September top being so far a Channel Down, it is likely that the rejection will deliver Lower Lows for the Channel, initially to Support 2 (Target 99.500) and in extension Support 3 (Target 97.500), as it appears that the Higher Lows gaps of the uptrend are systematically targeted during this downtrend.
-------------------------------------------------------------------------------
** Please LIKE 👍, FOLLOW ✅, SHARE 🙌 and COMMENT ✍ if you enjoy this idea! Also share your ideas and charts in the comments section below! **
-------------------------------------------------------------------------------
💸💸💸💸💸💸
👇 👇 👇 👇 👇 👇
DXY New Week SetupPair : DXY Index
Description :
Impulse Correction
Bearish Channel in Long Term as an Corrective Pattern
Break of Structure and Retracement at Daily Demand Zone
Fibonacci Level
Divergence
Bullish Channel as an Corrective Pattern in Short Time Frame
Completed " A - WXYXZ " Corrective Wave

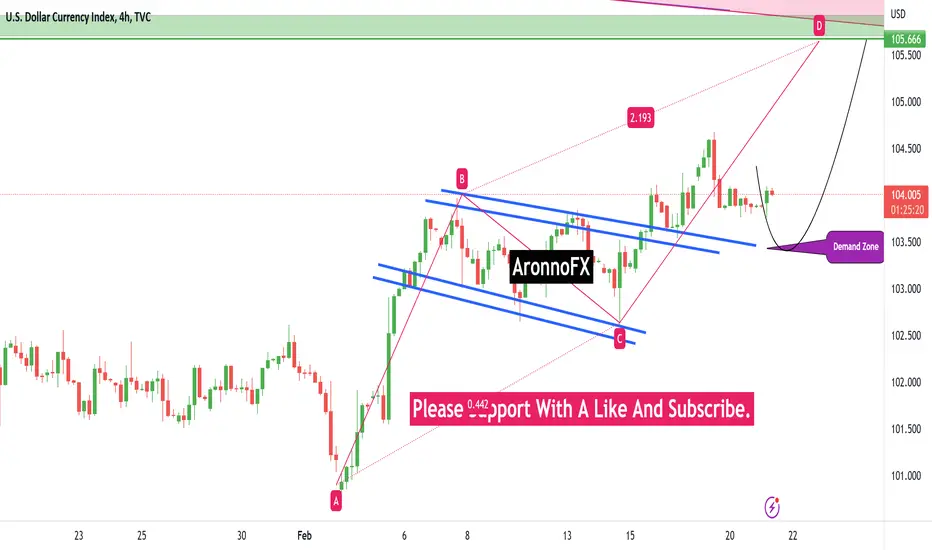
DeGRAM | Dollar Index DXY is approaching the major resistance level.
Price action may create an AB=CD pattern or an equal-measured move.
We anticipate a retracement from the resistance and Fibonacci extension levels.
-------------------
Share your opinion in the comments and support the idea with like. Thanks for your support!

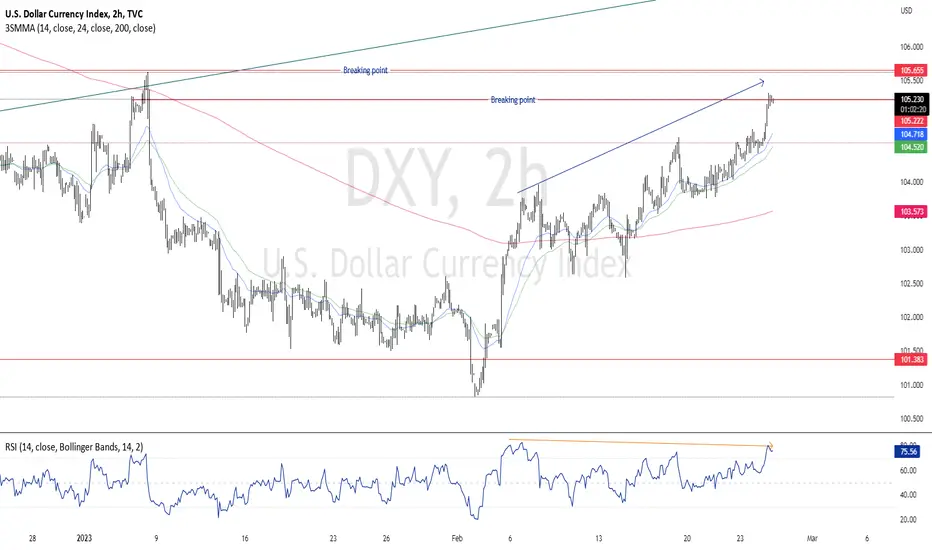
DXY ( High Probability SELL Setup SOON )* Here we can see clearly the next moves for USD index ( DXY ),
* We can see clearly the Bearish Divergence on the RSI indicator,
* This shows us more confirmation for our U.S. indices Strop Bullish Move,
* We're using H2 time frame for a clearer view of our analysis, hence we can't predict the duration of our analysis to occur,
* Keep a close eye on U.S. indices coming days & weeks,
* Happy pip hunting traders,
* FX KILLA.
DXY Chart Analysis....
DOLLAR INDEX MY VIEW-
N.B- In this situation DXY chart create Bullish Flag Pattern's breakout @104.360.
resistance level, then market Buy UP to 105:000; @ 105.500 and 106:000 resistance level.
Then market need seems sell correction to nearest Support 105.500 level.
AronnoFX will not accept any liability for loss or damage as a result of
reliance on the information contained within this channel including
data, quotes, charts and buy/sell signals.
If you like this idea, do not forget to support with a like and follow.
Traders, if you like this idea or have your own opinion about it,
write in the comments. I will be glad.
DXY Index Next MovePair : DXY Index
Description :
Break of Structure
Short Sell Long Buy Divergence
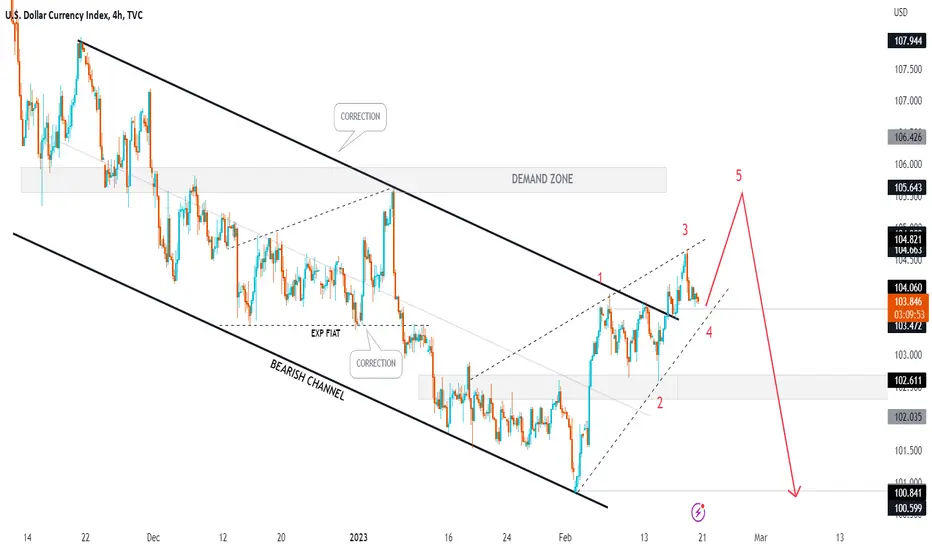
Bearish Channel in Long Term and Breakout of the Upper Trend Line
Completed " 1234 " Impulsive and Making it " 5th " Wave
Rising Wedge in Short Time Frame as a Corrective Pattern
Intraday Trading Sell DXY & Profit 1: 2 (17 FEB 2023)DXY intraday trading alert
3 simple steps to find a quality setup !
Risk Reward Ratio 1: 2
Anyone same idea with me?
SELL DXY
Good luck traders..

DXY INDEX Next Move Before CPI Pair : DXY Index
Description :
Bearish Channel as a Corrective Pattern and Rejecting from the Upper Trend Line #UTL
Double Top Pattern in Short Term
RSI Divergence
EMAs Crossing Each other and Indicating us the Sell in Short Time Frame
Break of Structure and Making its Retracement
Completed " 13245 " Impulsive Wave and Making " a " Corrective Wave

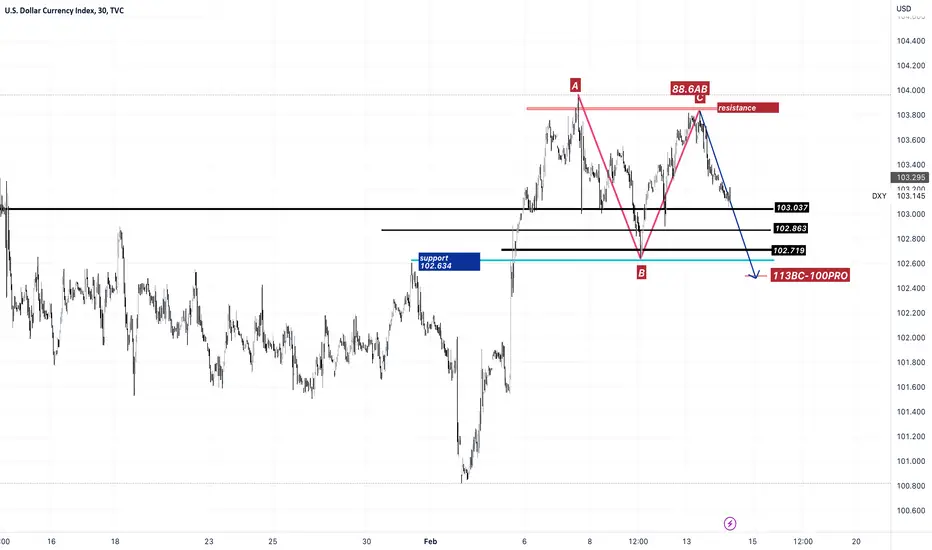
#DXYCurrently, we are in the process of completing a correction space, there are three areas:
1-103.037
2-102,863
3-102.719
It was based on a combination of percentages of fibrizing waves with pivot points. The range of 102.719 is located in the vicinity of the static support range of 102.634 and provides suitable conditions for the upward trend.
In case of failure of 102.634 support, we can finally estimate the completion of an ABCD pattern according to the current conditions.
(There is no certainty that all targets will be touched.)
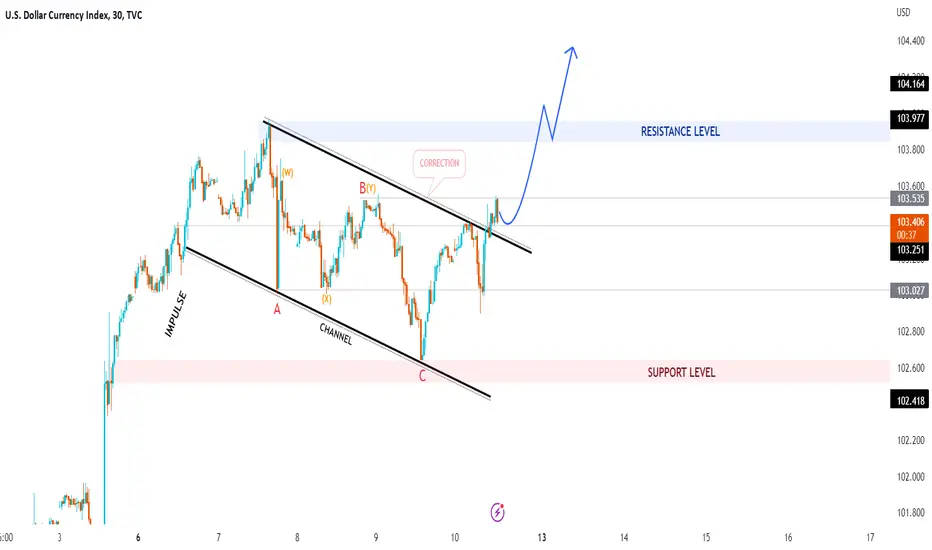
DXY is set for a rise!Currency Pair : DXY
Possible direction : Bullish
Technical Analysis : After market opening DXY has broken out the resistance with strong liquidity grab from the strong support zone. it is highly likely price will continue to rise as long term trend is bullish and we have seen multiple liquidity grab along the way
Possible trade recommendation : Bullish as per chart sketch
Press like button if you enjoy.
Risk Disclaimer: Trading foreign exchange on margin carries a high level of risk, and is not suitable for all investors. Past performance is not indicative of future results. The high degree of leverage is dangerous and can work against you as well as for you. Before deciding to invest in foreign exchange or any market you should carefully consider your investment goals, level of experience, and risk tolerance. It is EXTREMELY LIKELY that you will sustain a loss of some or all of your initial investment and therefore you should not invest money that you cannot afford to lose. No representation is being made that any account will or is likely to achieve profits or losses. Past performance is not indicative of future results. Individual results vary and no representation is made that clients will or are likely to achieve profits or incur losses comparable to those that may be shown. You acknowledge and agree that no promise or guarantee of success or profitability has been made between you, and Forex Trading Wizard. Do your own research and talk to a professional financial planner in order to be aware of all the risks associated with foreign exchange trading and investing and seek advice from an independent financial advisor before risking any capital.

DXY Index Monthly Move ??Pair : DXY Index
Description :
Bullish Channel as a Corrective Pattern
Break of Structure
Breakout the Consolidation Phase and Completed the Retracement
Rejecting from the Fibonacci Level - 50.00%
Divergence

Dollar Index Chart Analysis....
In this situation DXY chart create Bullish Flag Pattern.So,If breakout @103.777
resistance level, then market Buy UP to 103:999 ; @ 104.720 and 105:600 resistance level.
Then market need seems sell correction to nearest Support 104.950 level.
AronnoFX will not accept any liability for loss or damage as a result of
reliance on the information contained within this channel including
data, quotes, charts and buy/sell signals.
If you like this idea, do not forget to support with a like and follow.
Traders, if you like this idea or have your own opinion about it,
write in the comments. I will be glad.

dxy sell limit orderdxy sell signal
It is located in the range of the ceiling of the descending channel and it seems that it will fall to the bottom of the channel after reaching the limit of losses

DXY Index Next Move ?Pair : DXY Index
Description :
Impulse Correction
Fibonacci Retracement
Bearish Channel as a Corrective Pattern in Short Time Frame
S / R Level
Rejecting from the Current Demand Zone
Divergence
DXY : Long Trade , 1hHello traders, we want to check the chart of the dollar index. In the 1-hour time frame, the price has been able to break the resistance level of 103.300 and 103.400. Considering the strength of the market movement, if the price can reach around 103.300 and also The upward trend line returns is a good point to enter the trade and the next target that can be imagined is around the price of 104.700. Good luck.
DXY buy Entry : 103.278
Stop : 102.566 , Target : 104.700
Risk/Reward Ratio : 2

DXY Index 6 Jan -10 Jan Move Bullish ??Pair : DXY Index
Description :
Symmetrical Triangle Pattern as a Corrective Pattern in Monthly Time Frame and we have a Breakout and Retracement
Break of Structure
Divergence
Bullish Channel
Fibonacci Level
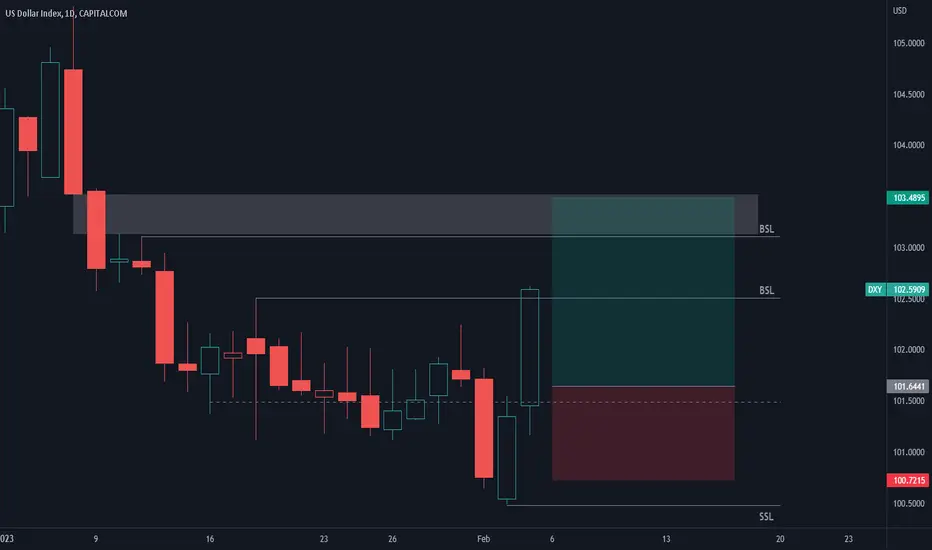
DXY LONG PLAY 06-02-23 (H4)The weekly close was very bullish , this is my first target next week. I am targeting the daily FVG and equilibrium of the FVG. My long-term play is the weekly volume imbalance as it has been for a few weeks but it may take months to play out.
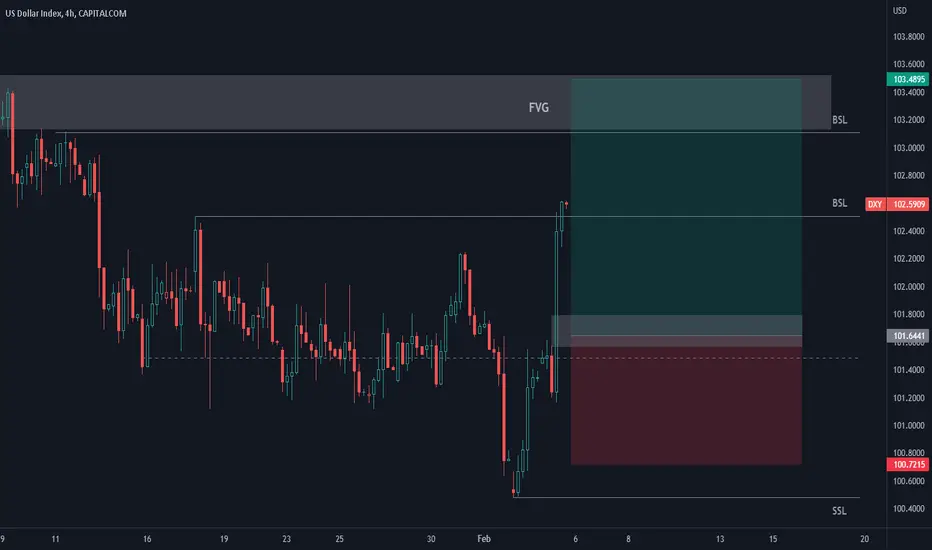
DXY LONG PLAY 06-02-23 (Daily)The weekly close was very bullish, this is my first target next week. I am targeting the daily FVG and equilibrium of the FVG. My long-term play is the weekly volume imbalance as it has been for a few weeks but it may take months to play out.
DXY Chart Analysis....
AronnoFX will not accept any liability for loss or damage as a result of
reliance on the information contained within this channel including
data, quotes, charts and buy/sell signals.
If you like this idea, do not forget to support with a like and follow.
Traders, if you like this idea or have your own opinion about it,
write in the comments. I will be glad.

DXY could rise to 103.50 resistanceSince the low at 101.50 two weeks ago, the USD Index is trading in a range.
However, the pressure seems to be on the buy side and a break above 102.30- 102.40 resistance would bring confirmation for a possible reversal.
In such an instance, the first target for bulls is the 103.50 zone resistance
I'm bullish as long as the 101.50 low is intact
