DYDX/USDT 2HOUR UPDATE BY CRYPTOSANDERS Welcome to this quick DYDX/USDT analysis.
I have tried my best to bring the best possible outcome in this chart.
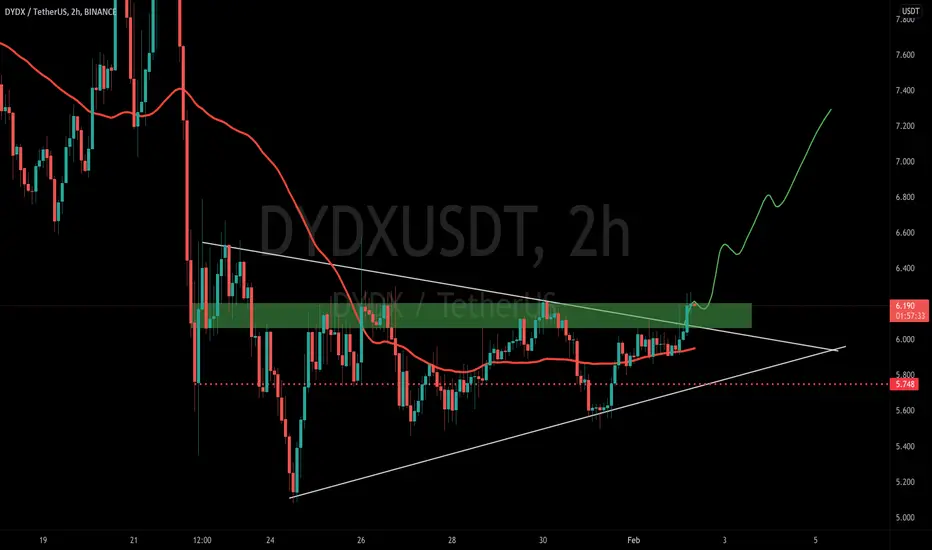
Reason of trade:-DYDX/USDT tringle pattern conform and retest buy the green zone
Entry:-CMP and BUY THE DIP
Target:- 15% to 20%
Stop loss:- 5.748
Remember:-This is not a piece of financial advice. All investment made by me is under my own risk and I am held responsible for my own profit and losses. So, do your own research before investing in this trade.
Happy trading.
Sorry for my English it is not my native language
Do hit the like button if you like it and share your charts in the comments section.
Thank you.
Dydxusdtsignal
DYDXUSDT Analysis (LOCAL VISION)Hello friends.
Please support my work by clicking the LIKE button(If you liked).Thank you!
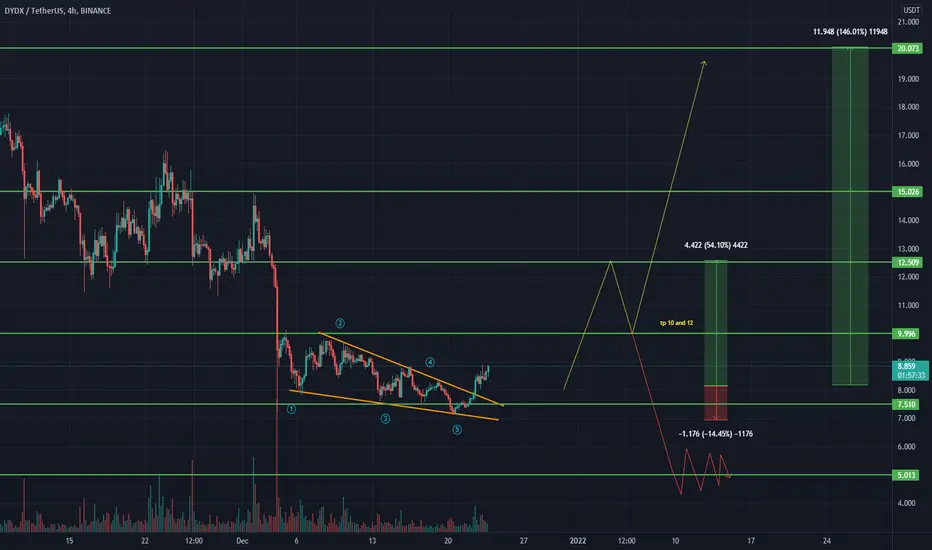
Everything on the chart.
If, after breaking through 10$ on retest, this level show strong, then in the medium term our goals will be 15$ and 20$, if not, then we will go to update the local bottom to the 5$ area.
Entry: market and lower
TP short term: 10 and 12
after first target reached move ur stop to breakeven
Stop: under 7 (depending of ur risk). ALWAYS follow ur RM .
Risk/Reward 1 to 4
risk is justified
Good luck everyone!
Follow me on TRADINGView, if you don't want to miss my next analysis or signals.
It's not financial advice.
Dont Forget, always make your own research before to trade my ideas!
Open to any questions and suggestions.
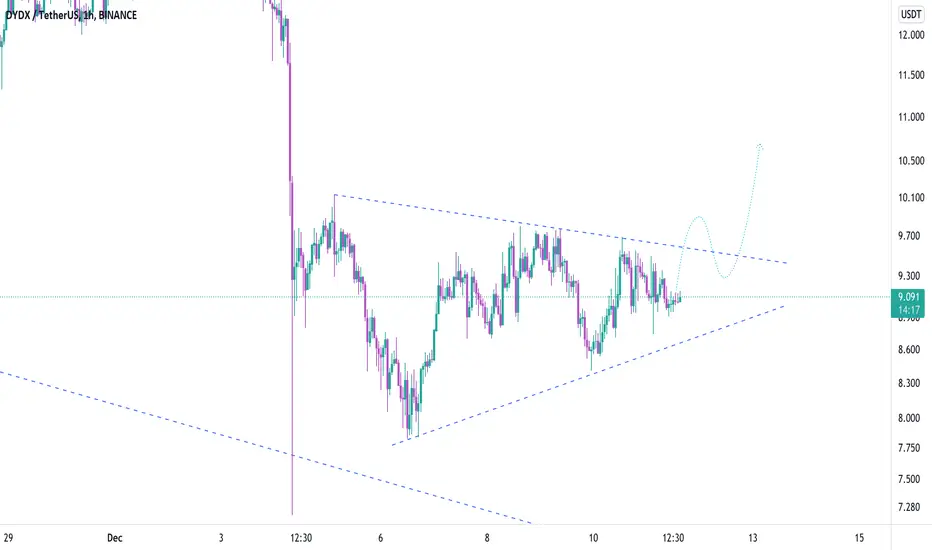
DYDXUSDT , This route can be happen Hello everybody
According to the chart , the price made pattern price and we this this movement can be happen .
But the important things is the trend of the market in DYDX is downward in this time frame and its risky position for buying but it has nice R/r to buy .
Previous analysis :
If you have any question, send us messages
Good Luck
Abtin
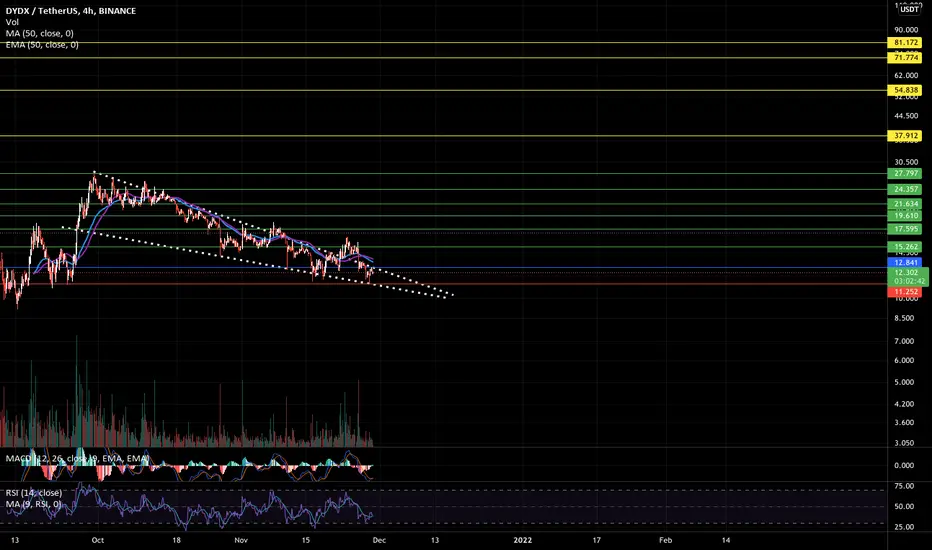
Dydx really!hey traders, there is Dydx ,as we see at the chart, we need closing above the blue line for 1D bar to get the green lines (short term's targets)
the yellow lines (long term's targets) and the stop loss is a close under the red line for 1D bar
.
trade carefully guys and don't forget the risk management.
.
.
.
.
.
.
.
DYDXUSDT Falling Wedge Pattern!!DYDXUSDT (12h chart) Technical analysis
DYDXUSDT (12h chart)Currently trading at $14.4
Buy level : Above $15
Stop loss: Below $11
TP1: $18
TP2: $20
TP3: $24
TP4: $27
Max Leverage 3x
Always keep Stop loss
Follow Our Tradingview Account for More Technical Analysis Updates, | Like, Share and Comment Your thoughts.

Buying #DYDX hereBINANCE:DYDXUSDT BINANCE:DYDXBTC Buying #DYDX here.
You can buy in usdt as well.
Now in double bottom formation. We are expecting big move up anytime soon. Chart looking bullish for now. Volume growing up slowly. We have detected unusual buying activity in it. Worth buy for short term and mid term profits.
Targets : 23200,26400,32000,39000
Targets usdt : 13.70$,16.90$,21$,28$
Stoploss 18% for both pairs

DYDX Declining As Per PlanDYDX is respecting our head and should setup from yesterday's IDEA.
I want to see price decline until 15.548 before i buy into the token again. Meanwhile Take note of the possibility to reach or exceed 14.500 , so plan accordingly by setting limit orders at that level.
Do not forget Stop loss.
PLEASE LIKE COMMENT AND FOLLOW ME TO SUPPORT MY INSIGHTS.

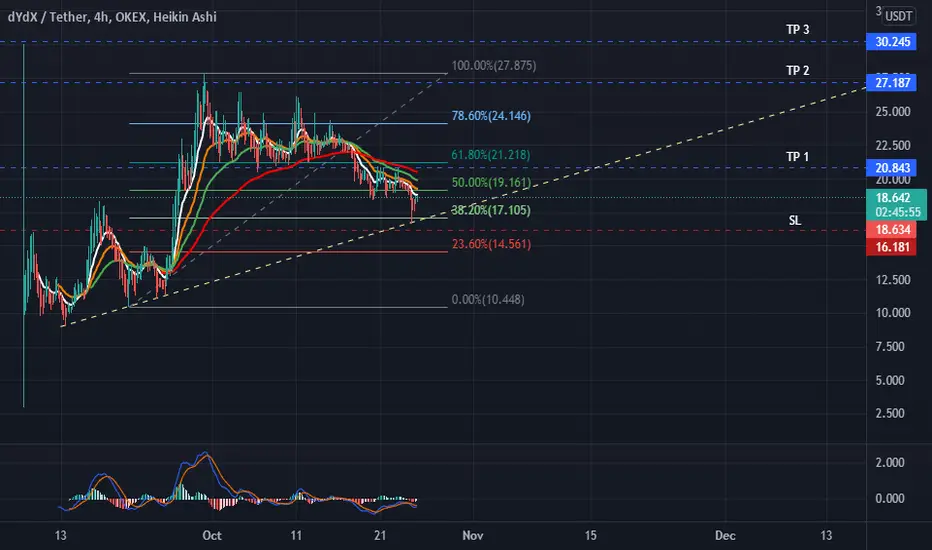
DYDXUSDT AnalysisHello friends.
Please support my work by clicking the LIKE button(If you liked).Thank you!
Everything on the chart.
open pos: market
target: 26 - 30 - 32
after first target reached move ur stop to breakeven
stop: ~16(depending of ur risk). ALWAYS follow ur RM .
risk/reward 1 to 3.5
Good luck everyone!
Follow me on TRADINGView, if you don't want to miss my next analysis or signals.
It's not financial advice.
Dont Forget, always make your own research before to trade my ideas!
Will be very APPRECIATE FOR UR DONAT/coins :)
Open to your questions or suggestions(Looking for investors!).

DYDX goin BULL🤑🤑🤑Another altcoin making its move
But be always be sure to wait for a retest, for every trade you take.
Remember your risk management. Finally Goodluck in your trade.