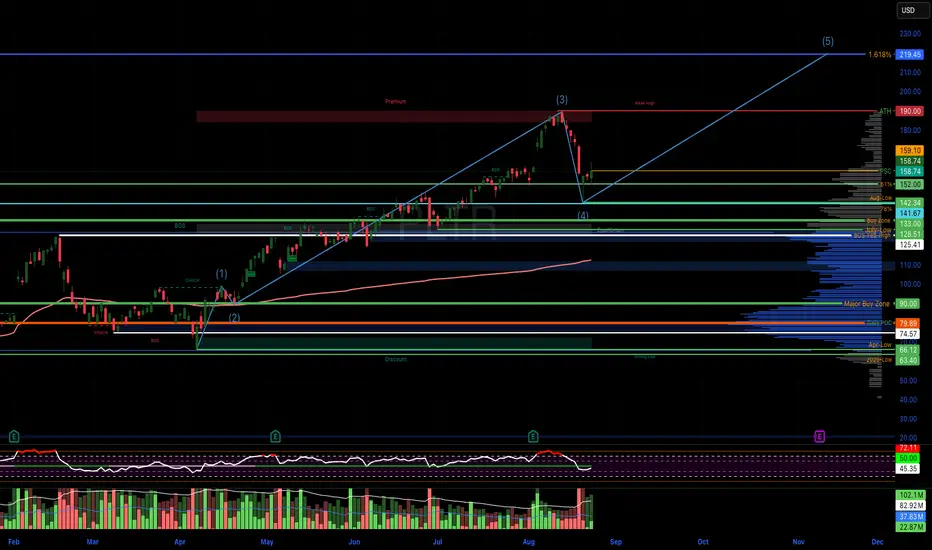
Palantir 2025 - Analysis - Elliott Wave PLTR looks like it is in Wave 4 consolidation/correction. If this holds, the next push higher would be Wave 5, with a likely target retest of $200 - $220. Palantir's next earnings report should be around November 10th, this would line up nicely with a continued run up into earnings, end of year "Santa Rally", hopefully hitting the 1.618% Fib extension at $219.45.
Elliott Wave Count (2025 View)
Wave 1 – The initial strong rally that started early in the year (around the $40–$60 zone) and pushed higher into the $100+ area.
Wave 2 – The corrective pullback that consolidated sideways/downward after the first rally (likely stalling between $80–$100).
Wave 3 – The largest and most impulsive rally that carried PLTR up toward the recent all-time highs (~$180–$190). This leg is clearly extended.
Wave 4 – The sharp pullback off those highs, retracing back to around $150s. This correction looks steep but fits as a Wave 4 since RSI cooled sharply too.
Wave 5 (potentially forming or still ahead) – If this structure holds, the next leg would be another rally attempt, targeting a move back toward or above the prior highs (~$180–$200 zone).
Supporting Clues
RSI: Overbought (>70) at the Wave 3 peak, then cooling into mid-40s (Wave 4 typical reset zone).
Volume: Big spikes on the Wave 3 rally and during the Wave 4 selloff, suggesting strong participation.
200-day EMA: Still rising far below price (~$110s), so long-term uptrend remains intact.
Earnings
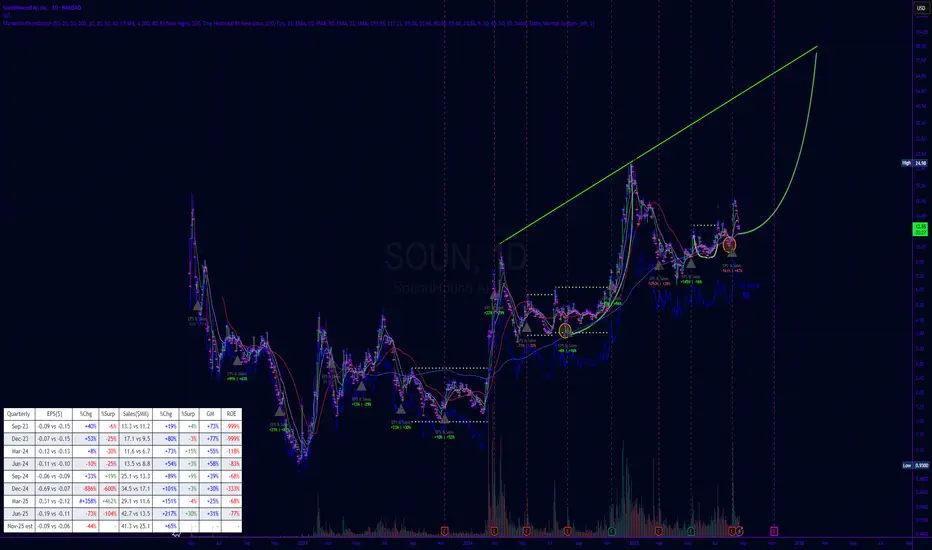
SOUN to $89?Potential catalysts for NASDAQ:SOUN to reach $89:
Major Partnerships: Securing multi-billion-dollar contracts with global leaders in automotive (e.g., Toyota, Tesla) or QSR (e.g., McDonald’s, Starbucks) for voice AI integration.
Revenue Surge: Sustained triple-digit revenue growth (Q2 2025: 217% to $42.7M) with a clear path to profitability, reducing valuation concerns.
Tech Breakthroughs: Advancements in Polaris AI or Vision AI, establishing superiority in accuracy, speed, or multilingual capabilities (30 languages supported).
AI Market Hype: Sector-wide AI rally driven by macroeconomic optimism or generative AI breakthroughs, lifting NASDAQ:SOUN with peers like NVIDIA.
Analyst Upgrades: Multiple analysts raising price targets significantly (current: $14.38–$15.00) based on strong fundamentals.
Acquisition Speculation: Buyout rumors or strategic investments by tech giants (e.g., Microsoft, Amazon) seeking voice AI expertise.
Short Squeeze: High short interest combined with positive catalysts like stellar earnings triggering rapid price spikes.
Macro Tailwinds: Lower interest rates boosting growth stocks, enhancing NASDAQ:SOUN ’s appeal given its 2.95 beta and 4.75% volatility.
Challenges:
High valuation (~$5B market cap) may limit upside without massive revenue growth.
Intense competition from Google, Amazon, and Apple in voice AI.
Execution risks in scaling and deal closures could temper momentum.
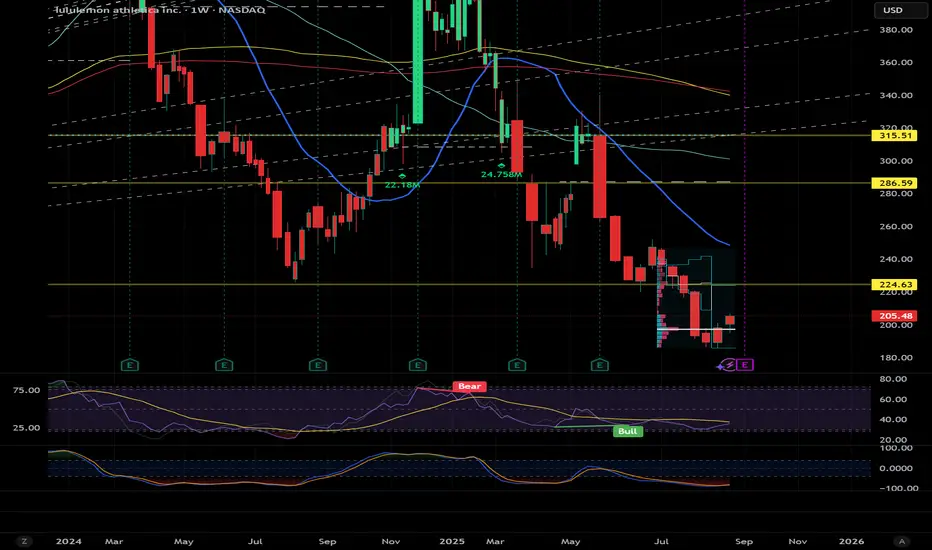
Lulu $260 first targetBought the Oct 17 260C little close dated but 1.3B in cash good margins looking pretty oversold here the turn around could be violent. I'm assuming there will be some good news on the upcoming earnings sept 4. getting wallstreets attention lately lets see if they can get a good squeeze, has to stay above 200.
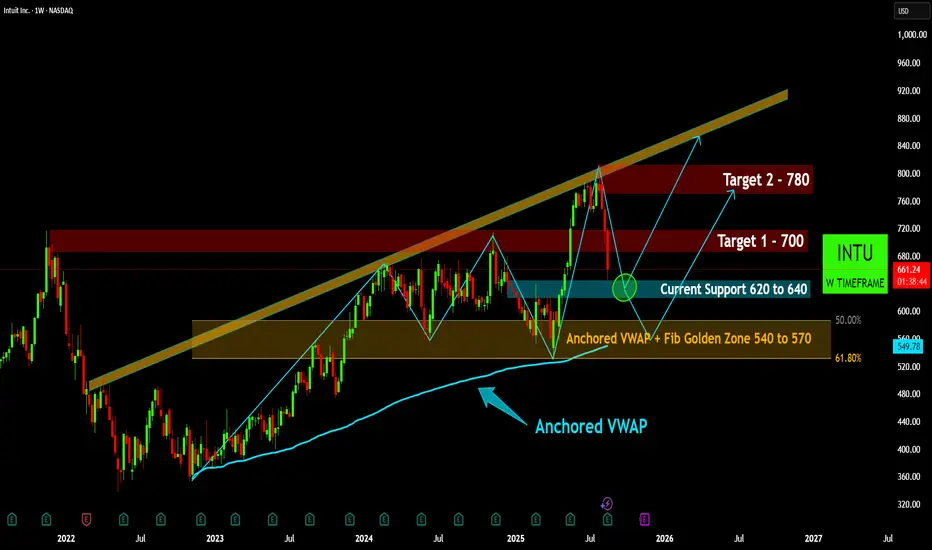
INTU Weekly: Testing Critical Support within Long-Term UptrendINTU Weekly: Testing Critical Support within Long-Term Uptrend
INTU demonstrates a robust long-term bullish trend, consistently trading within an upward-sloping channel on the weekly timeframe since early 2023.
Following a recent peak, the stock is currently testing the "Current Support" zone between
620-640, an important area for potential bounce and trend continuation.
Should the immediate support fail, a more significant and robust support confluence lies within the "Fib Golden Zone" (540-570), reinforced by the long-term Anchored VWAP.
If current support holds, initial upside targets are identified at $700 (Target 1) and $780 (Target 2), with the potential to eventually re-test the upper boundary of the long-term channel.
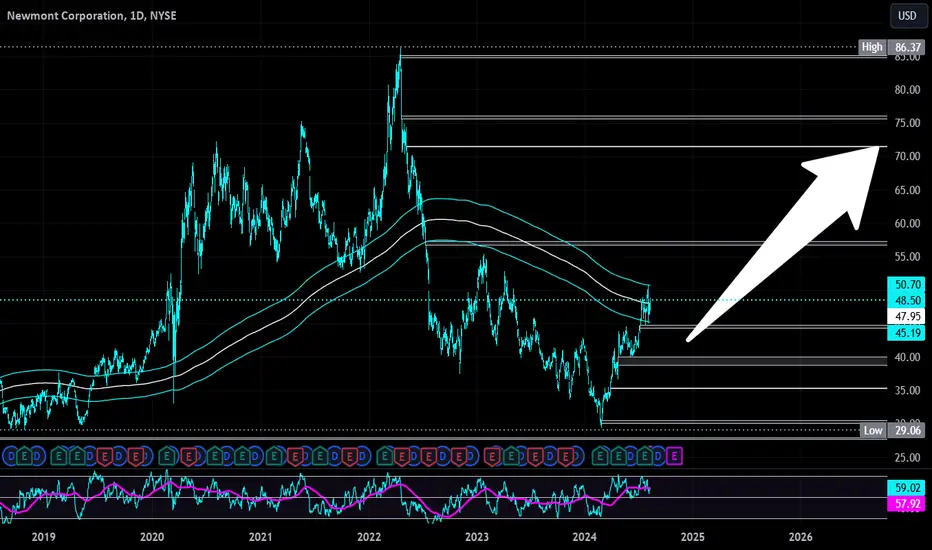
Newmont Corp | NEM | Long at $48.00While gold prices have soared recently, gold mining stocks have lagged. Newmont Corp NYSE:NEM , the world's largest gold mining corporation, may be undervalued if the miners take off to catch up to the gold demand/price. Currently sitting near $48.00 and at a historical moving average that it will need to break to show a true trend reversal, NYSE:NEM is in a personal buy zone. Now, the price may break down at the simple moving average and test the patience of shareholders, but the long game may benefit those who can tolerate the volatility.
Target #1 = $57.00
Target #2 = $71.00
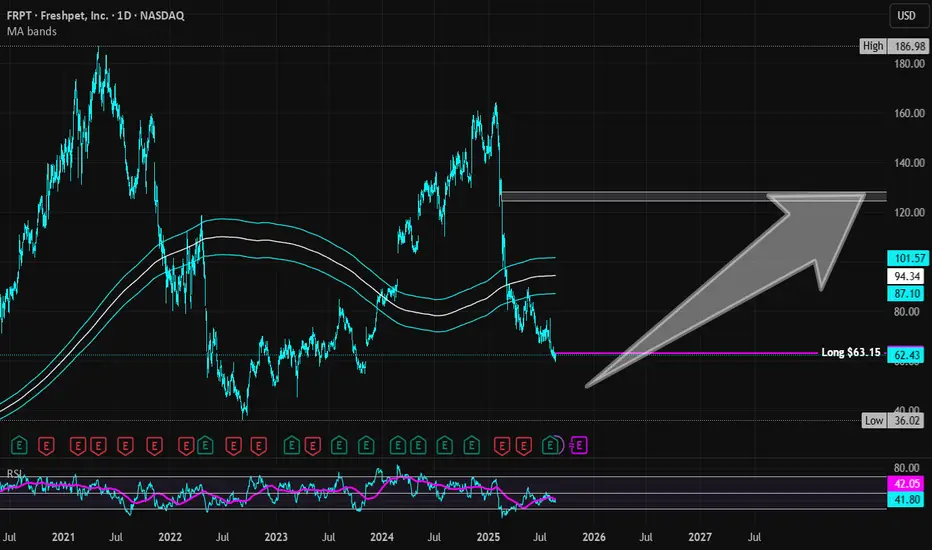
Freshpet | FRPT | Long at $63.15Freshpet's NASDAQ:FRPT future growth looks very good based on *current* estimates. The company's revenue is anticipated to grow from $1.18B–$1.21B in 2025 to ~$1.9B by 2028, implying an annual growth rate of ~13–17%. NASDAQ:FRPT targets a 22% adjusted EBITDA margin by 2027, with adjusted EBITDA expected at $190M–$210M in 2025. The stock is definitely not "cheap" right now with a price-to-earnings of 92x. However, the growth projections look solid if they can maintain the pace of growth through a tumultuous economy - the pet market is wildly resilient.
Since February 2025, insiders have grabbed over $931,764 in shares at an average price of $100.93. The only open price gap below the current price was a closed yesterday. A blaring price gap between $124-$128 is likely to be closed - just a matter of when. With very low debt (debt-to-earnings of 0.5x), Quick Ratio over 3 (heathy), and Altman's Z-score of 3+ (low bankruptcy risk), the company appears extremely healthy. I think there is a chance the price could reach into the high $40's and $50's in the near-term, but long term... if the projections are correct... the company looks poised from major profit.
Thus, at $63.15, NASDAQ:FRPT is in a personal buy zone with near-term risk of a drop into the high $40s and $50s.
Targets into 2028:
$90.00 (+42.5%)
$125.00 (+ 97.9%)
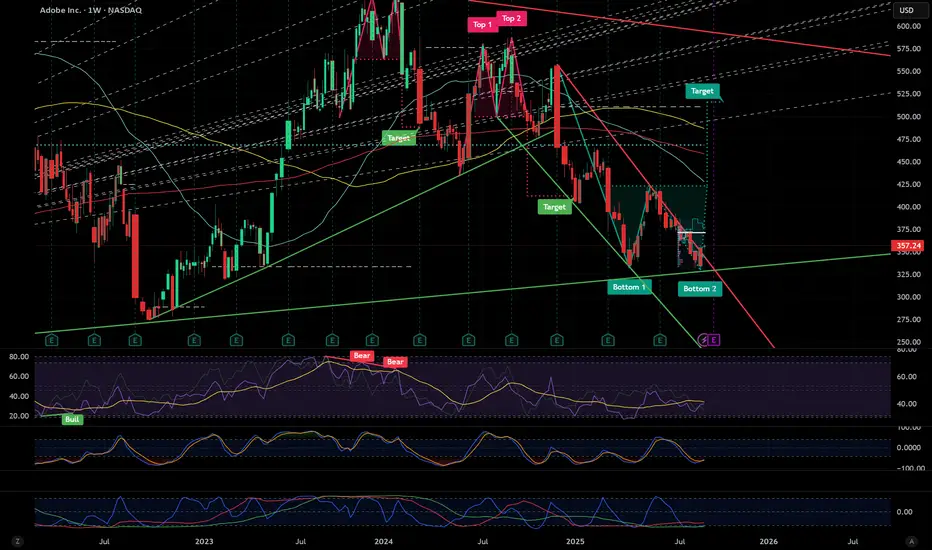
500$ +40% DB RALLYA close above 372$ area to look for the move up on the weekly, likely catalyst earnings coming up on 9/11 analysts project revenue around $5.35 billion up 12% YoY and non-GAAP EPS of ~$4.50-$4.60 driven by Creative Cloud and Firefly AI adoption. Chart looks amazing to back it up, software is not dead and they're implementing a lot of AI to further their growth not to be put out of business by it. Daily has some trend resistance around 360 and 50 100 MA above that the neckline for double bottom at last local top of 420 will also need to be smashed, pretty much in the clear after that besides a back test, this will take a while to play out but there's a decent shot with all these software companies bottoming at the same time. NYSE:CRM NYSE:NOW NYSE:HUBS
ADBE has also bought back a record 12B in stock this year while it looks like there's a mix of hedge funds open/closing q1. Profitable, growing and lowest valuation in a decade, Firefly might be 29.99/ month but it's safe and makes money compared to some of its free competition, the earnings hopefully show a LARGE increase over expected for subscriptions or a major acquisition.
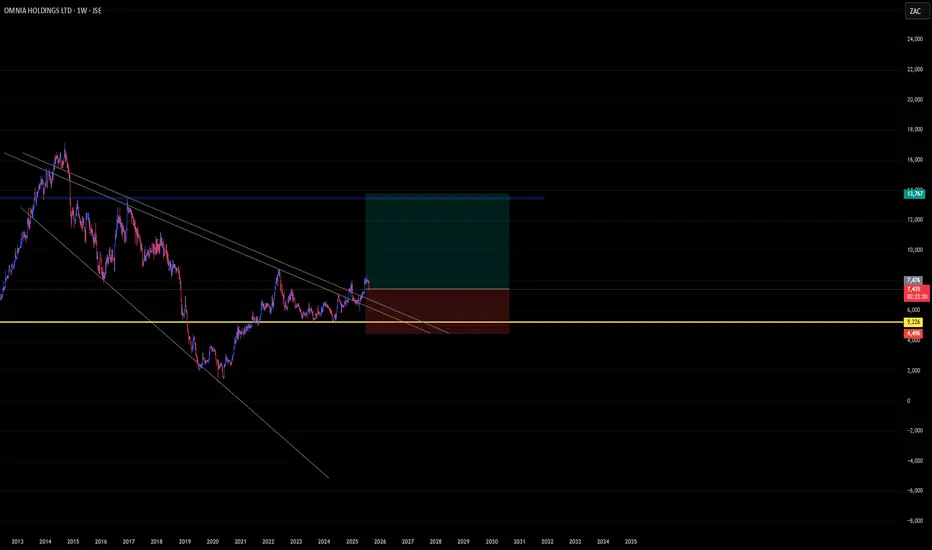
OMN Long Term Long PositionJSE:OMN had an increase in its revenue & earnings figure by 3% and 1%, respectively. Whilst maintaining a steady operating profit at +/- R1,700m. Despite being in a dispute with the taxman and the experiencing a deterioration in the chemicals sector, the improvement may be a result of geographical expansion in offshore operations and diversification into mining.
Evidently as we can see on the chart, the stock has been recovering and creating HH since the brink of COVID. Price was supported at 5200 ZAC and broke through our resisting trendline, which then signals a possible bullish move.
GENIUS Act Spurs Corporate Stablecoin Ambitions Amid Legal HurdlThe newly enacted GENIUS Act has created a landmark regulatory framework for stablecoins in the United States. The law mandates 1:1 backing, rigorous audits, and full transparency for issuers, effectively opening the door for large-scale corporate entry into the sector.
Major corporations — including top banks, retail giants, and global tech firms — are now exploring the launch of their own dollar-backed digital tokens. Others are considering strategic partnerships with established issuers to accelerate their entry into the market. The potential applications range from global remittances to supply chain finance, with the promise of faster settlement, lower fees, and improved liquidity.
However, significant challenges remain. The regulatory rollout will be phased and compliance-heavy, requiring ongoing coordination with multiple federal agencies. Businesses must also decide whether to operate on public blockchains like Ethereum or Solana, or develop private networks for greater operational control and security.
The stablecoin market is expected to expand rapidly under the new law, but issuers must navigate complex issues around anti-money laundering controls, customer identity verification, and capital reserve management. Striking the right balance between regulatory compliance and market competitiveness will be crucial.
Meanwhile, established stablecoin providers are adjusting their strategies to align with the new rules, focusing on building institutional trust while maintaining product scalability. For new entrants, the GENIUS Act represents both an opportunity and a challenge — those who move quickly yet carefully may secure a decisive advantage.
As the stablecoin infrastructure matures, regulated token issuance by reputable corporations could drive the next wave of crypto integration into mainstream finance. The companies that master compliance, security, and utility will be the ones to define this new era in digital currency.

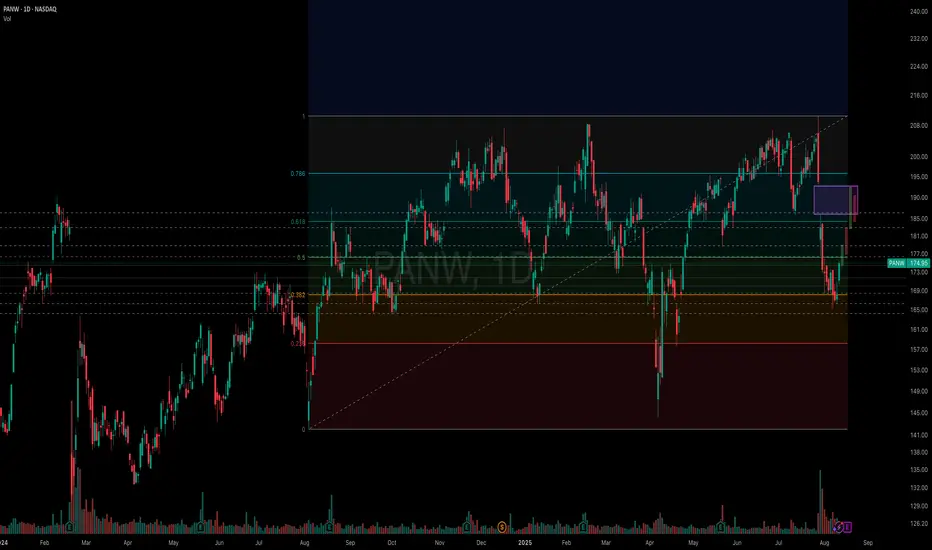
PANW Long to close the gap after earnings next Aug 18Because of the fall of NASDAQ:PANW was due to the acquisition of CyberArk and as sympathy fall from NASDAQ:FTNT but not because of fundamental reasons or sector/market issues, I used 1 year Fib Retracement to see what would be the worst bottom and best probability bounce taking in consideration that earnings will be very soon (Aug 18) and every short position will be most likely covered before earnings and the stock price taking a more down neutral level to go up or down after earnings.
So, considering this risk reward factors, last August 07th, when the stock went down to $166, I bought one Call Option OCT17 175 @7.75 just because this is the first time I trade this stock and it's not very liquid, and theta decay was less than -8, so I decided to place a swing trade and needed an option with low theta decay but maintaining 0.50 Delta.
The next day I say a Big Delta Long Vertical Trade made from a larger investor:
SELL -5,000 PANW 17OCT25 195 @2.82
BUY +5,000 PANW17OCT25 180 @6.45
That gave me more patience to wait for the bounce because the stock wasn't having the hard bounce I expected right away but someone invested almost 2 millions in this trade, which can be confirmed as Open Interest in the options chain.
Because this company has slightly beaten earnings expectations in the last quarters, and until now, there are no downgrades justifying the current price level:
UBS maintains Neutral at $185 lowering the PT from $200
Piper Sandler Upgraded PT from $200 to $225
And almost all ratings from the last months were in the bullish side.
I think the stock will close the gap after earnings around $195 where the explanation on how the CyberArk acquisition will be in the long term something beneficial, although this stock won't go back soon to its higher $210 price, I will expect a drop in the following days after earnings to around $180.
I'll close my position around $180 Before earnings or around $190 After earnings.
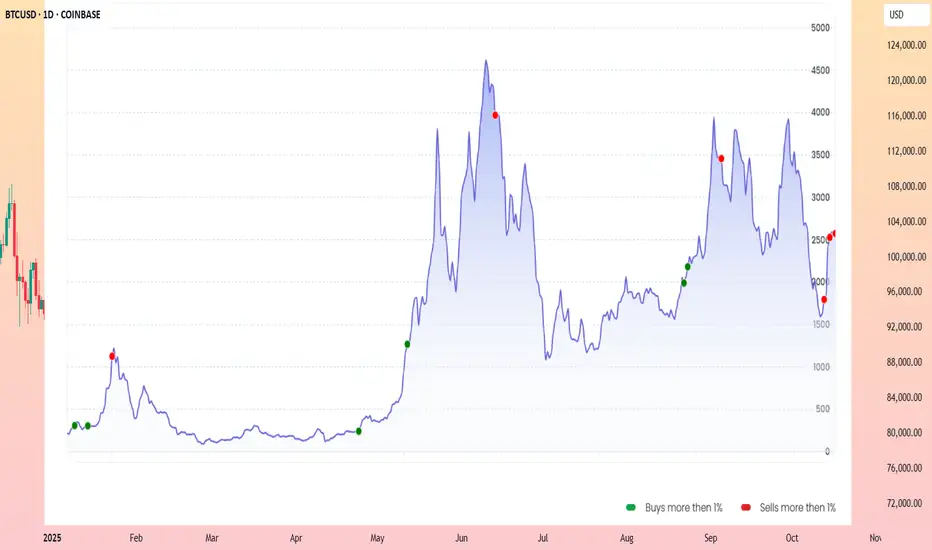
ETH season or Altseason ?In this article, we’ll review what the market has done so far and where the money flow has been leaning—toward altcoins or toward Ethereum.
As you can see, Ethereum has turned into a kind of black hole: whenever Bitcoin takes a breather, ETH pulls in most of the capital, and only a small trickle reaches altcoins.
What we see across most other altcoins isn’t much—at best, they snap back to prior levels. Think of SOL or those alts tied to “centralization/compliance” narratives. Otherwise, for now, the market is largely defined by Bitcoin and Ethereum’s moves.
Disclaimer
This is market commentary and reflects my personal opinion. It is not investment advice, a recommendation, or a solicitation to buy or sell any asset. Crypto markets are highly volatile and you can lose part or all of your capital. Always conduct your own research, make independent decisions, and use strict risk management (position sizing, stop-losses, scenario planning). Past performance is not indicative of future results. For guidance tailored to your situation, consult a licensed financial advisor.
#ETH #BTC.D #ETHBTC #BTCUSDT #Crypto #Candlestick #MarketStructure #Momentum #RiskManagement #PsychologicalLevel
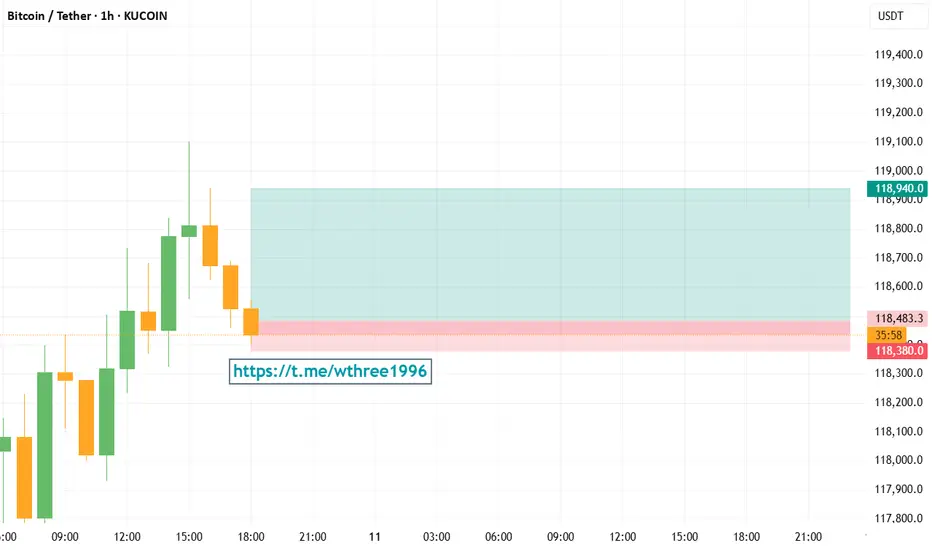
BTCUSDT LONG- Signal: LONG
- Entry: BTCUSDT 118,460 ~ 118,500
- Take Profit: 118,940 / Stop Loss: 118,380
ETHUSDT LONG- Signal: LONG
- Entry: ETHUSDT 4,220.8 ~ 4,222.5
- Take Profit: 4,232.6 / Stop Loss: 4,218.4

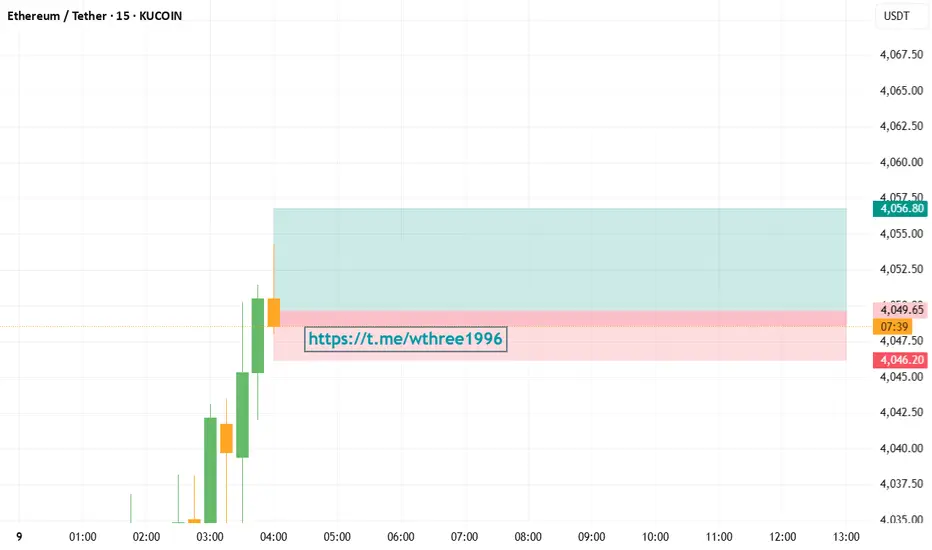
ETHUSDT LONG- Signal: LONG
- Entry: ETHUSDT 4,048.0 ~ 4,049.5
- Take Profit: 4,056.8 / Stop Loss: 4,046.2
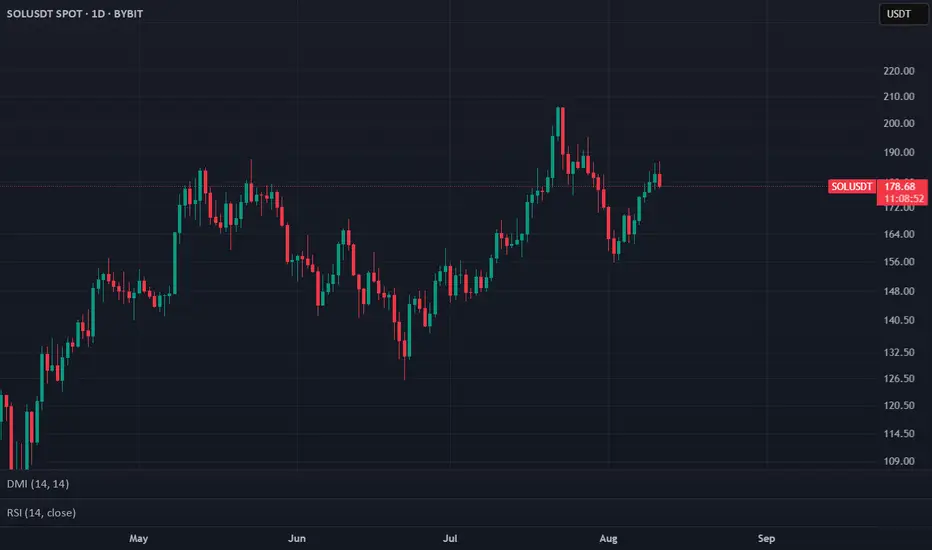
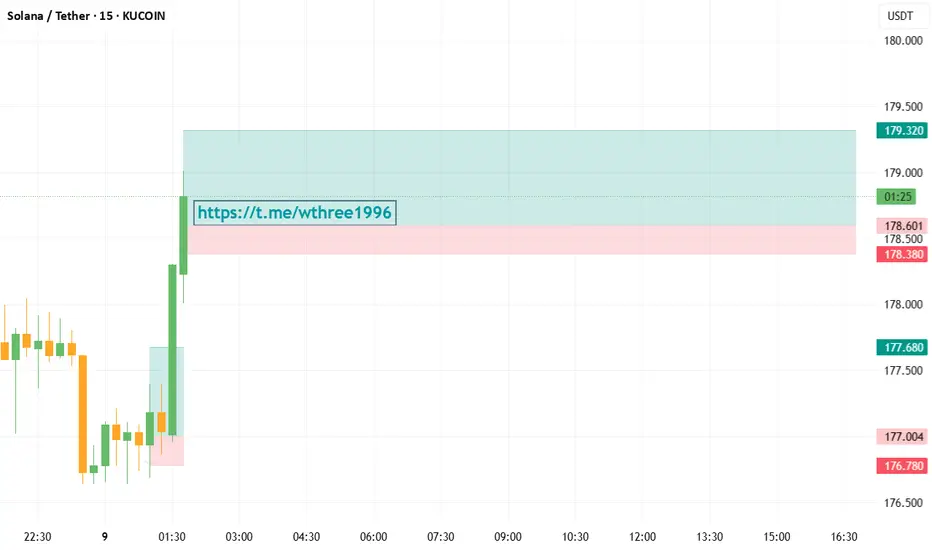
SOLUSDT LONG- Signal: LONG
- Entry: SOLUSDT 178.55 ~ 178.70
- Take Profit: 179.32 / Stop Loss: 178.38
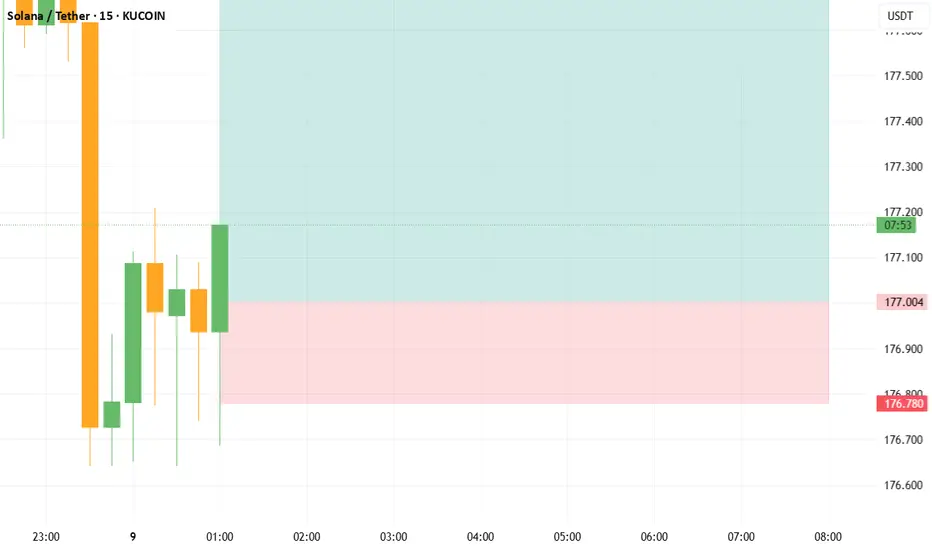
SOLUSDT LONG- Signal: LONG
- Entry: SOLUSDT 176.95 ~ 177.10
- Take Profit: 177.68 / Stop Loss: 176.78
ETHUSDT- Signal: LONG
- Entry: ETHUSDT 4,012.8 ~ 4,014.2
- Take Profit: 4,019.6 / Stop Loss: 4,010.1

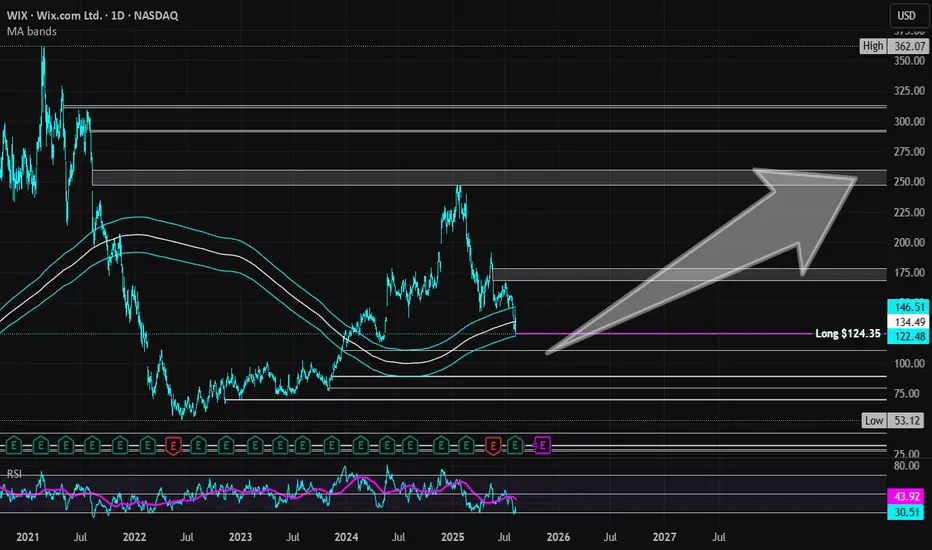
Wix | WIX | Long at $124.35NASDAQ:WIX is a company with steady growth projections driven by AI adoption, market expansion, user acquisition, and a focus on profitability. For example, earnings are forecast to grow 28.24% per year. Analysts project NASDAQ:WIX to achieve approximately $1 billion in free cash flow by 2028. While the current P/E is around 47x, its Forward P/E ratio is approximately 18x (potentially undervalued). I truly believe the changing economy will shift individuals into more entrepreneurship (what else can they do?) and that will be the driving force behind user growth.
From a technical analysis view, the price recently bounced off from my historical simple moving average band (often an area for share accumulation / consolidation). While it may trickle down to close the price gap on the daily chart near $110 in the near-term, I think the outlook needs to be long-term here given the projections. The only issue I see is the current high debt for NASDAQ:WIX , but interest rates are absolutely coming down soon which will help ease the strain.
Thus, at $124.35, NASDAQ:WIX is in a personal buy zone.
Targets into 2028:
$175.00 (+40.7%)
$250.00 (+101.1%)
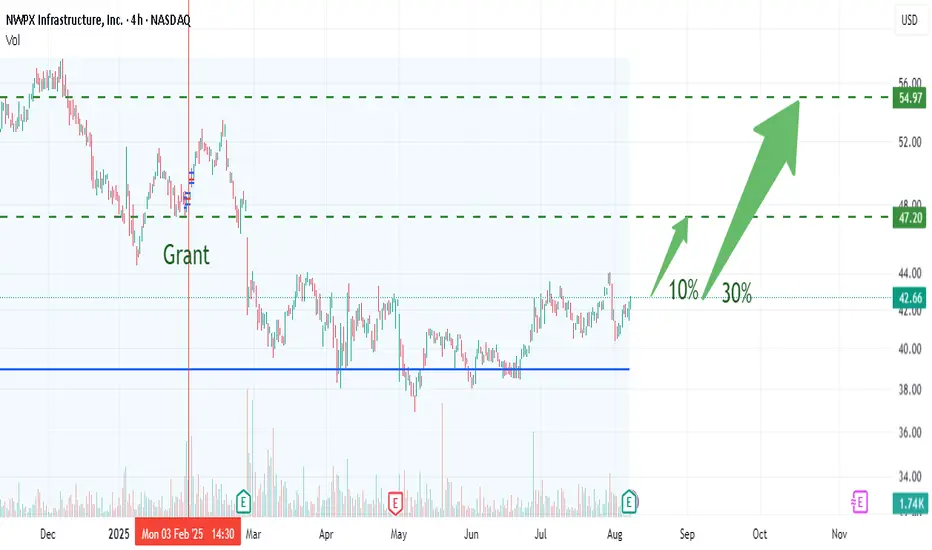
A valuable patentThe company's new patent grant could boost its stock price by about 30 percent, even after the dividend.
SPY Pull back into another earnings week?An engulfing weekly candle is no joke. Sellers are in control.
There is a strong possibility of a pull back and with bias being short, I am looking for a strong LH on the 1/2HR TF to form at 6330 as 50% or 6370- 6375 near the weekly POC.
Confluences for Pull back scenario
- Price bounced off 38.2% fib from 5930 to ATH
- Price found support at 200 ema on 4HR
- 1 HR MACD is building up bullish signal
Have a great week all!

PEG post earnings gap upYesterday after the earnings , in total rose by +44%. Its get stuck at the weekly resistance.
Entry: Option October 17 45 call. It could go further down, support around 39. The volume on the PEG candle is huge, I assume it will be the fuel to rise to 60.
Stop: at the low of the PEG candle.Target: next weekly resistance, 60.
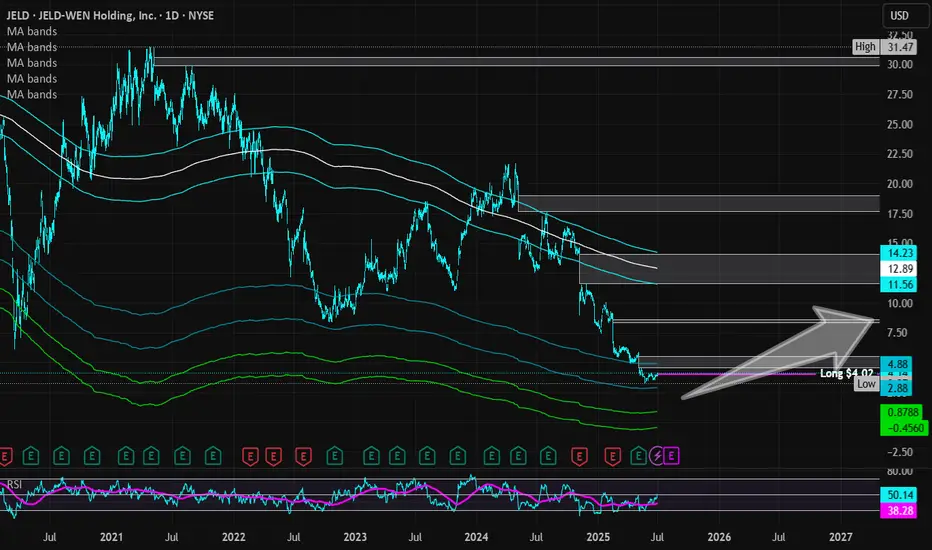
JELD-WEN Holdings | JELD | Long at $4.02JELD-WEN Holdings NYSE:JELD designs, manufactures, and sells wood, metal, and composite materials doors, windows, and related building products in North America and Europe. The stock has taken quite a beating since the rise in interest rates, and I think a reversal *may* be in sight in the next year as rates are slowly lowered - even if the market is forward-thinking and purely anticipating a new housing boom (which I highly doubt given the current home prices). Regardless, there is risk with this stock since it has relatively high debt (debt-to-equity of 2.61x). A Quick Ratio of 1.1 and Altman's Z Score of 1.9 puts NYSE:JELD near a medium level of bankruptcy risk. The company has pretty good cash reserves and a forward P/E of 10x (current is negative), so growth is anticipated. Book value of $5.31.
A bear case here is a terrible earnings call in August 2025 due to the housing market slowing (i.e. people pausing home purchases/builds/repairs expecting interest rates to drop soon). That may plummet the stock near $1.00 or below, which would be a tremendous deal, *unless* the company fundamentals change (like bankruptcy).
Without a crystal ball, yet understanding the forward-thinking aspects of the market, NYSE:JELD is in a personal buy-zone at $4.02 with some risks.
Targets into 2027:
$5.40 (+34.3%)
$8.50 (+111.4%)
The successful trader anticipates activity in BSC🔁 Wallet 0x1ebab9c329317082577f0e495cbe5b0d4958c5e7 just bridged: 4 000 USDC left Ethereum → HitBTC, then 3 915 USDC hit BNB Chain minutes later.
DefiLlama shows ~$14M fresh inflows today in BSC, while ETH flows cool—signaling a rotation play.
Expect this whale to farm BSC yield or snipe rising alts next 📈
🔝 Score: #39 | Balance: $13.4k | Results: $16.4k→$219.5k (+1,340 %, 44 trades, avg buy $1,020 / sell $2,643).