BULL Earnings Play--Don’t Miss Out
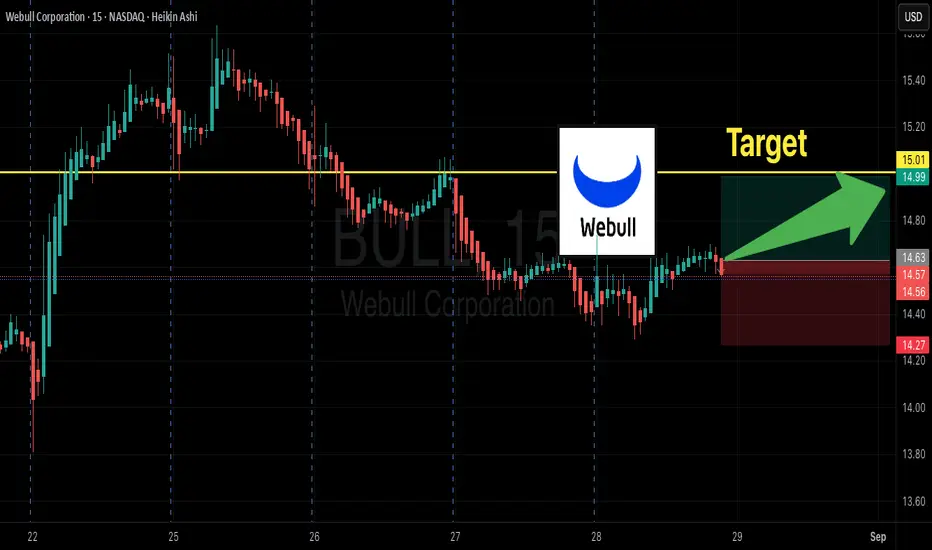
# 🚀 BULL Earnings Play (8/28 AMC) 🚀
💎 **Moderate Bullish | 75% Conviction** 💎
🎯 **Trade Setup**
📊 Ticker: \ NASDAQ:BULL
🔀 Direction: CALL 📈
🎯 Strike: 15.00
📅 Expiry: 2025-08-29
💵 Entry: 0.46 (ASK)
⏰ Entry Timing: Pre-earnings close (8/28 AMC)
📦 Size: 1 contract (risk 💸 \$46)
📈 Profit Target: 1.38 → 200%
🛑 Stop Loss: 0.23 (-50%)
---
⚡️ **Why Bullish?**
* 🚀 Revenue growth + crypto expansion catalysts
* 🏦 Options flow skew → heavy \$15C & \$16C activity
* 📉 Low VIX → cheap volatility for earnings week
* 📊 Risk/reward: 2–3x upside vs. capped downside
Earningsseason
BILI Earnings Trade Setup (High Conviction Call Play)
🚀 **BILI Earnings Trade Setup (High Conviction Call Play)** 🚀
📊 **Earnings Date:** Aug 25, 2025 (BMO)
🎯 **Expected Move:** +5–7%
💡 **Conviction:** 75% Bullish
---
🔥 **TRADE DETAILS** 🔥
* 📌 **Ticker:** \ NASDAQ:BILI
* 📈 **Direction:** CALL (LONG)
* 🎯 **Strike:** \$26.00
* 💵 **Entry Price:** \$0.87
* 🎯 **Profit Target:** \$2.61 (200%)
* 🛑 **Stop Loss:** \$0.44 (50% of premium)
* 📅 **Expiry:** 2025-08-22
* 📏 **Size:** 2 contracts
* ⏰ **Entry Timing:** Pre-Earnings Close
---
✅ **Why Bullish?**
* 📈 **Revenue Growth:** +23.6% YoY momentum 🚀
* 💰 **Margins:** Operating margin flipped positive (0.2%) 💡
* 📊 **Analysts:** 75% EPS beat probability + Strong Buy consensus
* 💎 **Options Flow:** Bullish skew → call volume stacking at \$26.00 strike
* 🔥 **Technical Setup:** Above key MAs, RSI = 65.3 (strong momentum)
---
⚠️ **Risk Management Plan** ⚠️
* 🎯 Take profits @ \$2.61 if stock hits \~\$28.68
* 🛑 Cut @ \$0.44 if trade goes against
* ⏰ Exit within 2 hours post-earnings if neither target nor stop is hit (avoid IV crush!)
---
📌 **Hashtags / Tags for Reach:**
\#BILI #OptionsTrading #EarningsPlay #CallOptions #TradingSignals #BullishSetup #OptionsFlow #EarningsAnalysis #MarketStrategy #RiskManagement #TradingView #SwingTrade #StockMarket

SCSC Earnings Gamble: $45C--Pre-Earnings Lotto Play?
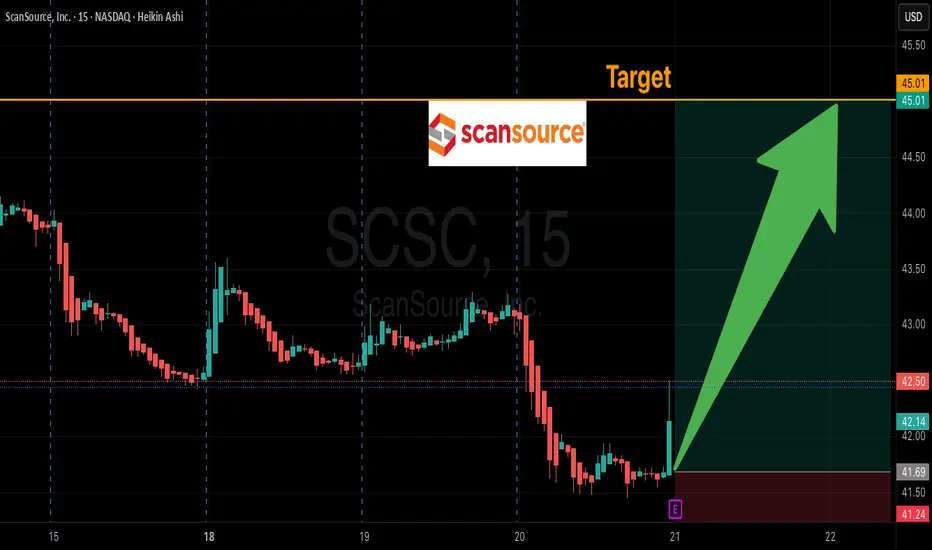
# 🚨 SCSC Earnings Gamble: \$45C 🎯 Pre-Earnings Lotto Play? 📈💰
### 📊 Earnings Prediction Breakdown (2025-08-20)
**Company:** ScanSource, Inc. (SCSC)
#### 🔎 Fundamentals
* 📉 Revenue growth: **-6.3%** (big challenge)
* 💸 Margins: Thin (Profit 2.3%, Operating 3.3%, Gross 13.5%)
* ⚠️ Beat rate: Only **38%** with negative surprise history (-6.1%)
* 🧾 Forward EPS est.: \$3.74 (+34.5% growth expected — may be too optimistic)
**👉 Score:** 5/10 (Weak fundamentals, a few bullish sparks)
---
#### 🏦 Options Flow
* ⚡️ IV: Normal, no big expansion
* 📉 Liquidity: Low (79 calls vs 3 puts OI 😬)
* 🛡️ Skew: Slightly bearish (more puts for hedging)
* 🐢 No dark pool or big whale activity
**👉 Score:** 4/10 (Retail-heavy, no big-money conviction)
---
#### 📈 Technicals
* 💵 Price: \$43.06 (hovering above MA)
* 📊 RSI: Neutral → leaning overbought
* 🔑 Levels: Support \$41.36, Resistance \$45.00
* 📉 Volume: Weak (0.72x avg)
**👉 Score:** 5/10 (Neutral momentum, low volume support)
---
#### 🌎 Macro Context
* 🚚 Supply chain headwinds remain
* 📦 Tech distribution sector under pressure
* 📉 Micro-cap vulnerability → tough environment
**👉 Score:** 5/10 (Neutral sector, not much tailwind)
---
### 🎯 Directional Conviction: **53% Neutral / Speculative Bias**
---
## ⚡️ TRADE IDEA (Speculative Only) ⚡️
🎯 **\$45 Call @ \$1.25 (Sept 19 expiry)**
* 🛑 Stop Loss: \$0.62 (50%)
* 🎯 Target: \$2.50–\$5.00 (200–400% lotto)
* 📆 Entry: Pre-earnings close
* ⏰ Exit: Within 2 hrs post-earnings
---
📊 **Quick Recap Card:**
* 🎯 Instrument: **SCSC**
* 🔀 Direction: **CALL (LONG)**
* 🎯 Strike: **45.00**
* 💵 Entry: **1.25**
* 🛑 Stop: **0.62**
* 📅 Expiry: **2025-09-19**
* 📈 Confidence: **53%**
* ⚠️ Risk: Low liquidity, speculative lotto
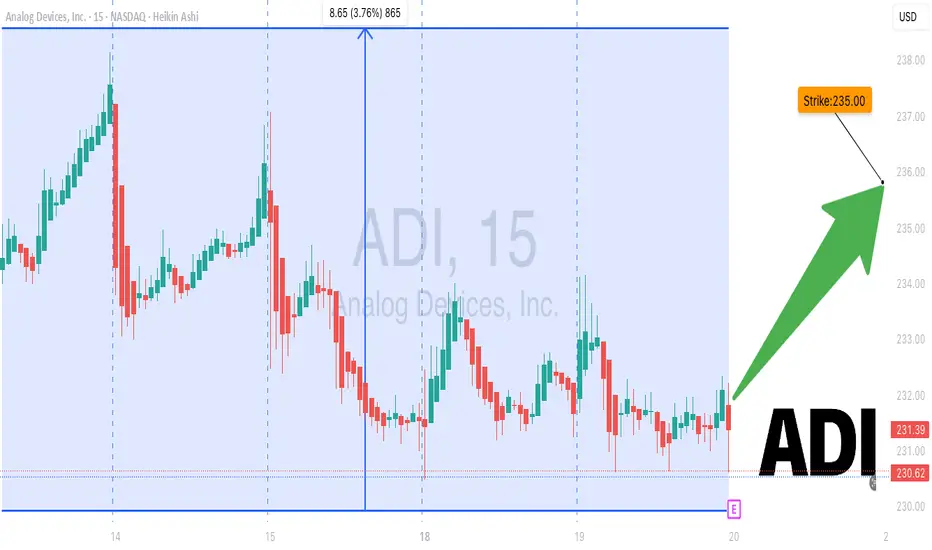
ADI Earnings Options: Long $235 Call⚡💎 ADI Earnings Alert – $235 Call (Aug 23, 2025) 🚀🔥
Earnings Snapshot
📊 Revenue Momentum: +22.3% TTM ✅
💵 Revenue per Share: $19.79
📈 Profit Margin: 18.7%, Operating Margin 25.7%, Gross Margin 58.8% 💎
🏦 Forward EPS: $7.54, Avg Target Price $254.16 📈
💡 Sector Context: Semiconductors benefiting from automotive & industrial recovery 🚗🏭
Technical & Market Context
Price: $231.55, near 50-day MA ($233.25) ⚖️
RSI: 50.37 → neutral
Volume: 2.12M, below 10-day & 3-month averages 📉
Key Levels: Support $227.83, Resistance $234.22
Macro: Low VIX (14.84) supports growth/low-volatility environment 🌈
💥 Trade Recommendation
🎯 Strategy: Long Call
🏦 Instrument: ADI
💵 Strike: $235 Call
🗓️ Expiry: Aug 23, 2025
💰 Entry Price: $5.50
🎯 Profit Target: $22.50 (200–300%+) 💎
🛑 Stop Loss: $2.75 (50% of premium) ❌
⏰ Entry Timing: Pre-earnings close
📈 Confidence: 75%
⚠️ Key Risks:
Absent detailed options flow 📊
Pre-earnings technical neutrality ⚖️
Potential premium spike → IV crush post-announcement ⏳
Trade JSON
{
"instrument": "ADI",
"direction": "call",
"strike": 235.0,
"expiry": "2025-08-23",
"confidence": 75,
"profit_target": 22.50,
"stop_loss": 2.75,
"size": 1,
"entry_price": 5.50,
"entry_timing": "pre_earnings_close",
"earnings_date": "2025-08-22",
"earnings_time": "AMC",
"expected_move": 5.0,
"iv_rank": 0.75,
"signal_publish_time": "2025-08-19 14:52:26 UTC-04:00"
}
📊 Quick Trade Recap:
🎯 CALL $235 | 💵 $5.50 → 🎯 $22.50 | 🛑 $2.75 | 📅 Aug 23 | 📈 75% Confidence
⏰ Entry: Pre-Earnings Close | 📆 Earnings: Aug 22 AMC | 📊 Expected Move: 5%
RDDT Earnings Setup (2025-07-31)
### 🔥 RDDT Earnings Setup (2025-07-31)
📈 **Bullish Bias | Confidence: 75%**
🎯 Target: \$165+ | 🔒 Resistance: \$155.58
---
### 📊 FUNDAMENTALS
* 📈 **Revenue Growth (TTM): +61.5%**
* 💰 **Gross Margin**: 90.8%
* ⚠️ **Op Margin**: 1.0% (Thin runway)
* 💥 EPS Surprise Avg: **+191% (5/5 beat streak!)**
* 📉 EPS Growth Est: **-86.6%** → low bar = potential upside
**🧠 Fundamental Score: 7/10**
---
### 🧠 OPTIONS FLOW
* 🔵 **\$172.00C** building OI
* 💸 IV Rank \~0.75 (Move priced in!)
* 🧲 Bullish call activity > puts
* 🛡️ Put skew = hedged upside
**📊 Options Score: 7/10**
---
### 📈 TECHNICAL SETUP
* ✅ Above 20DMA
* 🔥 RSI: 62.2 = strength but not overbought
* 📦 Accumulation spike
* 🔐 Resistance: \$155.58
* 🧲 Break = squeeze setup
**📉 Technical Score: 8/10**
---
### 🌍 MACRO BACKDROP
* 🌐 Digital ad sector = support
* 🚨 Regulatory overhang = minor risk
* 🧬 Growth stock rotation helps RDDT
**🌐 Macro Score: 7/10**
---
### 🎯 TRADE IDEA
**💥 RDDT \$172.00C** (Aug 1 Exp)
* 💵 Entry: \$6.15
* 🎯 PT: \$18.45
* 🛑 SL: \$3.08
* 📈 Risk/Reward: \~3:1
* ⏱ Exit: 1–2 hrs post-earnings
* ⚖️ Sizing: 1 contract = \~\$615 risk
---
### ✅ SUMMARY
🧬 Strong rev growth + historical beat streak
🎯 Technical breakout setup + bullish flow
🚀 Potential squeeze toward **\$165+**
📣 Tag: #RDDT #EarningsPlay #OptionsFlow #RedditIPO #SwingTrade #TradingViewViral #EarningsSeason #TechStocks #CallOptions

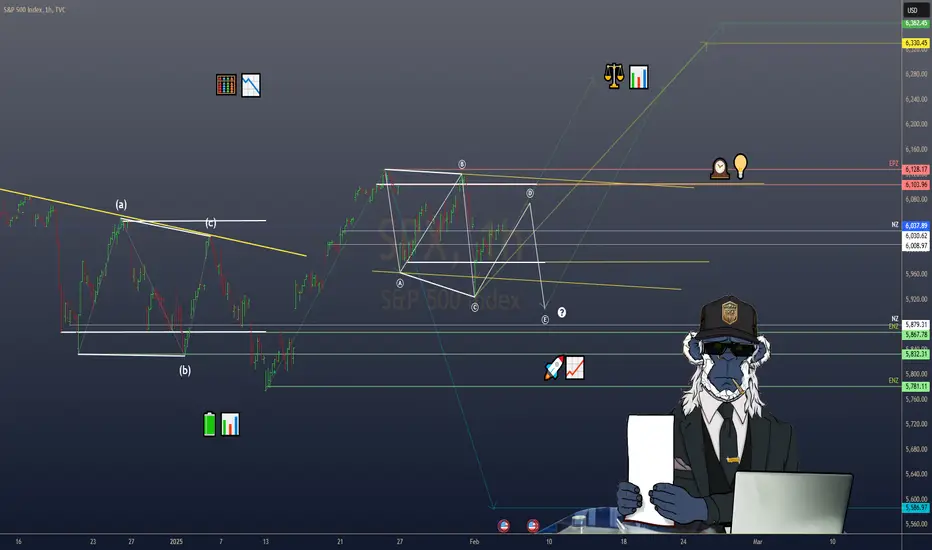
S&P Correction Window is official - VOLATILITY AHEADIt's that time of year where the pre-summer push wraps and the summer lull and potential
pause gets underway.
July 31 finished on a bit of a sour note with over 67% of stocks declining today and US indexes finishing RED despite the big gaps and bullish pops on MSFT and META post earnings.f
SPX Key Levels
-watch the 21 day moving average
-watch the 50 day moving average
-more dynamic support in the 100/144/200 moving average cluster
I'll be taking bites at the 5/10/15% correction levels with options and looking for this dip
to be bought by retail and institutions.
Will August 1 US Tariff Deadline matter? After Japan and Eurozone came in and said a deal is being done, I was thinking this would be a dud. BUT, Dr. Copper says "maybe" on the global
tariff deadline with the largest single day move in history (bearish). Being the perfect time of year for a correction (the other being Feb-Apr), and the technicals looking so clean for an
orderly pullback, VIX may float higher and make things more interesting in the next 30-60 days.
Strategies matter, I'll be trading risk defined, but there are great opportunities ahead. A pullback is sure better than literally watching all-time highs every single day.
Thanks for watching!!!

**MARA Earnings Setup – TradingView Breakdown**
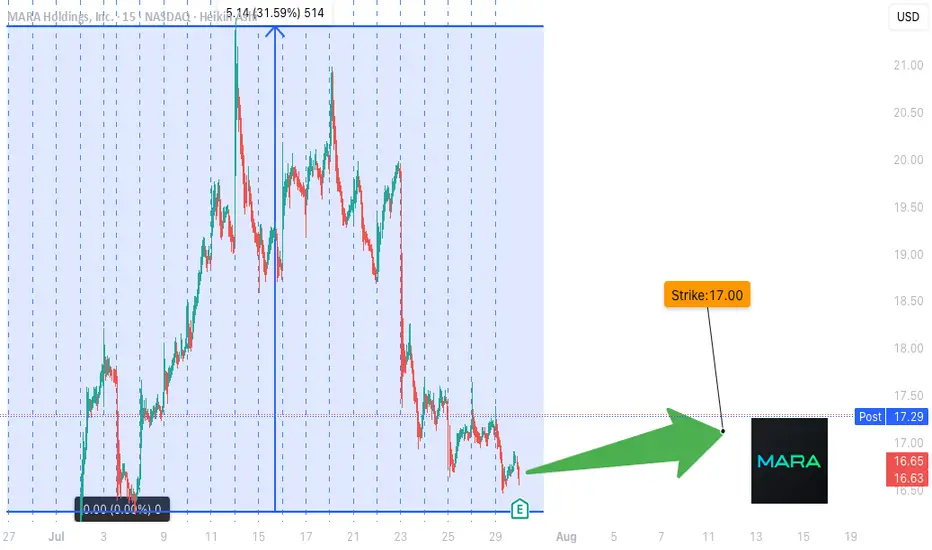
🚨 **MARA Earnings Setup – TradingView Breakdown** 🚨
📅 *Earnings Play for 07/29/2025*
🎯 *Strike: \$17.00 Call | Exp: 08/01/2025*
💰 *Premium: \$0.59 | Target: \$1.18*
📈 *Conviction: 75% Bullish*
🔹
---
🧠 **What’s the Setup?**
MARA just raised \$950M to expand BTC holdings 💥
Revenue YoY growth: **+29.5%** 📊
Margins still rough: **-46.7% profit**, but potential catalyst is 🔥 if BTC pumps.
---
🧨 **Options Flow Is Heating Up**
👀 Massive open interest on **\$17 Calls**
🤏 Put/Call Skew slightly bullish
🧮 IV low despite high beta (6.55) = **cheap volatility play**
---
📉 **Oversold + Coiled Tight**
📉 RSI: 38.57 (Oversold)
📍 Support: \$16.50 | Resistance: \$17.50
💣 Sitting at key technical inflection pre-earnings.
---
🔮 **Trade Idea**
🎯 *Buy \$17C @ \$0.59*
🚀 Target: \$1.18 (2x gain)
🛑 Stop: \$0.30
📆 Exit within 2 hrs post-ER to avoid IV crush
---
📊 **Risk/Reward**
💰 Max Loss: \$59
📈 Potential Gain: \$118
⚖️ R\:R = 2:1
---
🔥 **Why It Could Go Viral**
✅ Bitcoin bullish narrative
✅ High beta + cheap IV = explosive setup
✅ Oversold technicals + earnings catalyst
---
🔁 **Like & Save this if you're playing MARA ER 🔥**
\#MARA #EarningsPlay #OptionsTrading #BitcoinStocks #TradingView #ShortSqueeze #CallOptions #HighBetaSetup #CryptoStocks #EarningsSeason #MARAAnalysis #TradingStrategy #Fintok #Finfluencer
How We’ll Trade Earnings This Season Earnings season is almost here — and if you're with QS, you’re already holding the most powerful edge in the market.
Let me walk you through how QS trades earnings, why we built 💸earning-signal, and how you can use it most effectively this quarter.
---
📜 A Little History: The Birth of 💸earning-signal
When QS launched in early April, we started with just two short-term signals:
⏰0dte
📅weekly-options
Both focused on short-term options trades.
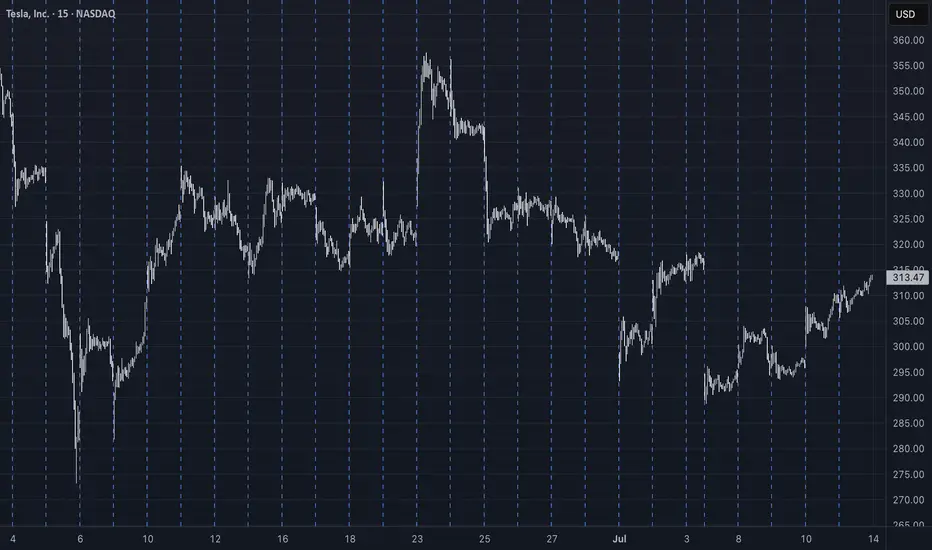
Then came TSLA earnings in late April. That’s when we launched our very first 💸earning-signal — and nailed the prediction.
Since then?
We’ve had one of the best earnings win streaks on the internet. Period.
📌 Don’t take my word for it — check:
#✅signal-recap for the track record
#🤑profits and #🤩member-testimonials for real wins from members
---
🤖 Why We Built a Separate Earnings Signal
Earnings are not regular trading days. The dynamics are completely different.
On normal days, a stock might move <1%
On earnings? 10–20% swings are common
This is what we call a “pivot event” — and it requires a different engine to predict.
That’s why we separated:
📅 #weekly-options → normal day-to-day setups
💸 #earning-signal → high-volatility earnings plays
---
🧠 How a Human Would Trade Earnings...
If you wanted to manually trade an earnings report, you’d need to analyze:
Past earnings reactions
Analyst expectations
Earnings call language
Financial statement surprises
Options IV & skew
Post-earnings stock behavior
This would take hours (or days) — and most retail traders don’t have time.
---
⚙️ How QS AI Does It Instead
We built 💸earning-signal to do all that work for you — and more.
✅ It pulls in all the data above
✅ Runs it through 5 top LLM models (each acts as an independent analyst)
✅ Aggregates their insights + calculates probability-weighted direction & strategy
✅ Uses fine-tuning to learn from its past prediction success/failures
This means: faster decisions, deeper insights, and better accuracy — every week.
We don’t just run predictions. We let the AI learn from past mistakes and self-improve each quarter.
---
💥 Results Speak for Themselves
Last season, we nailed:
TSLA
MSFT (10x–20x winners!)
NVDA
AAPL
And many more...
All based on this unique AI-driven earnings analysis stack.
This season?
We’re going harder, faster, and even smarter. 📈
🎯 The goal is clear:
Make 💸earning-signal the #1 earnings prediction system in the world.
---
🧩 Final Notes
Earnings are 10x harder to trade than regular days
But with QS, you’re equipped with 500x the speed and insight of an average trader
Upgrade if you haven’t yet: #💰upgrade-instructions
Earnings season kicks off next week
Let’s get it.
Let’s win big.
Let’s make season 2 of 💸earning-signal our most legendary yet. 🚀💸
Get Prepared! Watch This BEFORE Markets Open on Tuesday!Weekly Preview:
- Inflation Talk from last Week
- Economic Calendar for this week
- Earnings Preview with Technical Analysis
Enjoy Friends!
Not financial advice

Wall Street Rallies on Trade Optimism: $SPX Performance Wall Street Rallies on Trade Optimism: S&P 500 Performance Update 📈
1/9
The S&P 500 Index ( SP:SPX ) closed higher today, fueled by optimism surrounding U.S.-China trade negotiations. Energy stocks led the charge, driven by rising oil prices and demand forecasts. 🔋📊
2/9
Energy Sector Surge: Energy stocks played a crucial role in today's SPX gains. Rising global demand and oil price increases are sparking investor confidence. 🚀 Is this trend sustainable?
3/9
Trade Optimism: President Trump's decision to delay tariffs on Canada and Mexico boosted sentiment. However, new U.S. tariffs on China and China's retaliatory measures remain key risks. ⚖️ Trade talks are still a tightrope walk.
4/9
Corporate movers today:
PepsiCo and Estée Lauder fell after weak earnings forecasts. 📉
Palantir soared on a strong revenue outlook. 📈
Earnings season continues to shape sector performance!
5/9
Investors now await Alphabet's earnings, set to drop after market close. Tech giants like Alphabet can significantly impact SPX momentum in coming sessions. Will it be a bullish or bearish catalyst? 🕰️
6/9
Economic Context: The SPX's performance today highlights a market adapting to trade uncertainties. Investors are shifting their focus from immediate trade impacts to longer-term prospects. 💡
7/9
Looking Forward: Alphabet's earnings could either reinforce today's rally or inject new volatility into the market. Tech earnings remain a major influence on overall market sentiment. 🧮
8/9
Today's SPX rally is a reminder of the market's sensitivity to macroeconomic factors—trade policy, sector rotation, and earnings expectations are all in play. Are you positioned for these shifts? 📊
9/9
What’s your market outlook for the SPX this week? Vote now! 🗳️
SPX will continue rising 📈
Expect some volatility 🔄
Bearish pullback ahead 📉
Huge Earnings and Economic Surprises Ahead!🚨 Weekly Preview: Big Earnings and Economic News 🚨
Get ready for an action-packed week as we dive into major corporate earnings reports and crucial economic updates! 📊💼
🔍 Earnings Highlights:
Tech giants like Apple, Microsoft, and Tesla are set to release their quarterly results.
Also, goliaths such as Visa, Mastercard, ASML and more!
📈 Economic Indicators to Watch:
Inflation rates 📉
GDP Growth 📊
Federal Reserve policy decisions 💵
Stay tuned for in-depth analysis and insights on how these events could shape market trends and investor sentiment. Don't miss out on the key information that could impact your financial decisions! 📅📢

$UNH Earnings: First Report Since Tragedy in NYCUnitedHealth ( NYSE:UNH ) reports tomorrow at 5:55 AM ET with Wall St. expecting EPS of $6.92 and revenue of $101.1B. The company has consistently beaten estimates over the past 2 years. From 2013-2023, EPS grew from $5.59 to $24.12.
Key focus areas: medical cost trends, Medicare Advantage growth, and the impact of leadership changes following recent events. This quarter’s call will attract more than just investors.

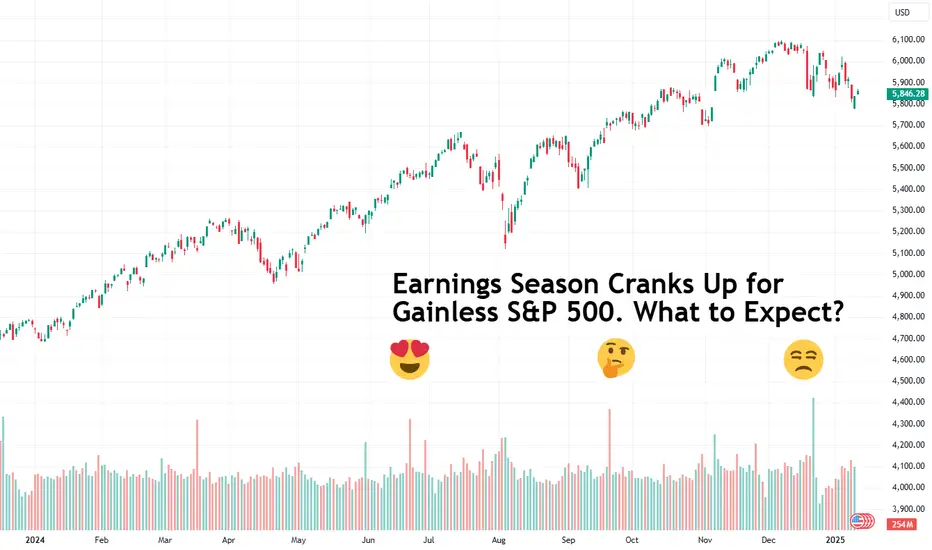
Earnings Season Cranks Up for Gainless S&P 500. What to Expect?The S&P 500 SPX is now showing nearly zero growth since Election Day, November 5. Markets were euphoric to see Donald Trump win the White House for another four years and pushed the S&P 500 to the rarefied air of 6,000 points and above. But that’s not the case anymore.
A flurry of data has poured cold water on that breakneck rally, including the latest nonfarm payrolls, which showed employers tapped a whopping 256,000 workers in December, far outpacing expectations of 156,000. The news fanned fears that the Federal Reserve might take its time in cutting interest rates — every investor’s biggest concern right now.
It’s up to the earnings season to rejuvenate a falling stock market. To many, the fourth-quarter earnings updates will be the most consequential event as it will also mark President Joe Biden’s departure and the arrival of the main character, Donald Trump.
First through the door, as is tradition, are the heavyweight players on Wall Street. This week traders will get to see the earnings results from big banks including JPMorgan JPM , Wells Fargo WFC and Goldman Sachs GS . In addition, the world’s largest asset manager BlackRock BLK will also post its performance.
The banks’ updates will provide a glimpse into investor appetite for big-shot dealmaking, business sentiment and also how daring and bold consumers were in their spending activity. Things like net interest income — how much the bank earned on interest after paying out deposits — will be a key gauge for the banking system’s health.
Here’s what’s coming from Wall Street’s household names (and some extra).
➡️ Wednesday, January 15, before the bell:
Citi C
Goldman Sachs GS
JPMorgan JPM
Wells Fargo WFC
BlackRock BLK
Bank of New York Mellon BK
➡️ Thursday, January 16, before the open:
Bank of America BAC
Morgan Stanley MS
U.S. Bancorp USB
Other earnings include UnitedHealth UNH .
Once markets digest the updates from the lending giants, the focus will shift to the next big thing — the Magnificent Seven . It’s a high bar once again for America’s most powerful corporate juggernauts.
Investors expect Mag 7 earnings to be up 22% from the same period last year while revenue is eyeballed to have grown 12.3%. The consensus views follow the elite club’s 32.9% earnings jump in the third quarter on revenue increase of 15.4%.
Fun fact: the Mag 7 members accounted for 23.1% of all profits in the S&P 500 for the quarter ending September. For the three months to December, they are expected to consume about a quarter of the earnings pie.
And for 2025, their market cap is projected to devour more than one-third of the S&P 500’s value, which is around $50 trillion. For the tech geeks, here’s the Mag 7 earnings slate:
➡️ Wednesday, January 29, after the closing bell:
Microsoft MSFT
Facebook parent Meta META
Tesla TSLA
➡️ Thursday, January 30, after the closing bell:
Apple AAPL
Amazon AMZN
➡️ Tuesday, February 4, after the closing bell:
Google parent Alphabet GOOGL
➡️ Wednesday, February 19 (tentative), after the closing bell:
Nvidia NVDA
Overall, the foresighted market gurus (i.e. the analysts) expect all companies in the S&P 500 to report a roughly 12% advance in quarterly profits compared to the year-ago quarter. For 2025, the consensus call is a 15% increase in corporate profits from last year.
There are, of course, the permabears among us who spell doom and gloom. They say that Donald Trump’s proposed tariffs could hinder corporate growth by raising prices for US companies that rely on overseas products. And if those companies decide to pass these costs to customers, then inflation might rear back up, throwing the markets into another painful cycle of higher interest rates.
What’s your take? Are you optimistic about the corporate earnings season? And are you excited to see more growth in 2025? Share your thoughts in the comments and let’s spin up the discussion.
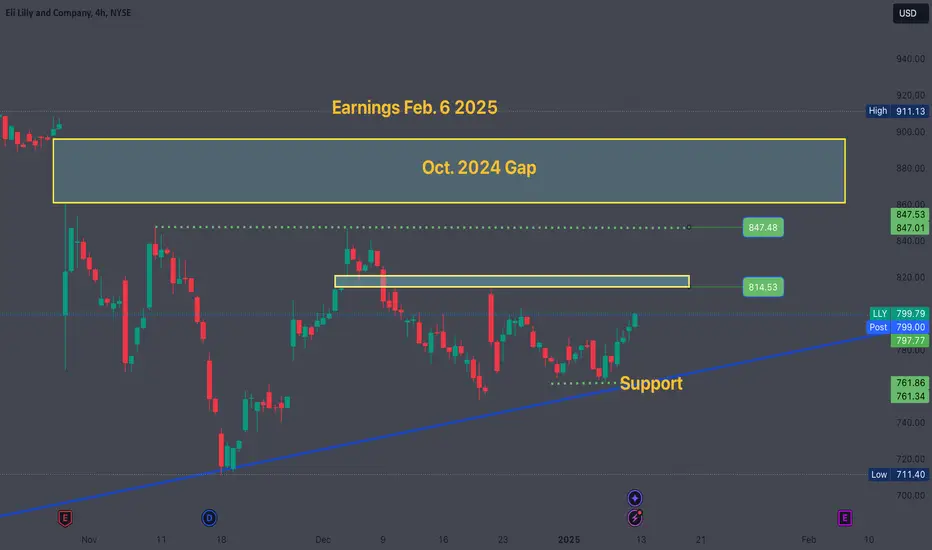
LLY Earnings Preview: Breakout or Rejection? Key Levels to WatchNYSE:LLY moved from 761-799 this week, catching key support at that 761 level. NYSE:LLY closed as an outside week, bullish on the 15MIN-Week timeframe. This has the potential to be a really nice earnings run-up, if the 800 level can hold. As always do your own research, these are just ideas, not meant for investment advice.
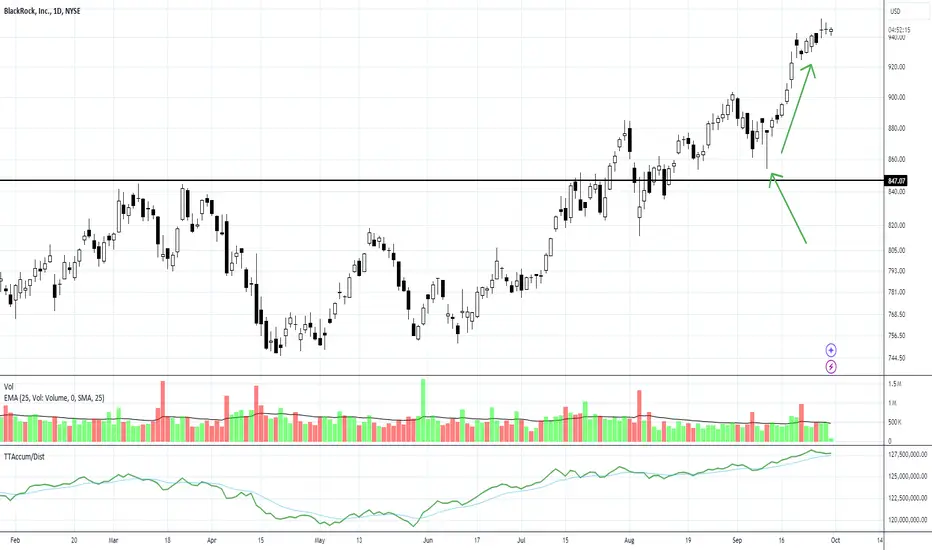
Pre-earnings Run PatternBellwether of the ETF industry, NYSE:BLK reports Oct 11th and has already had a pre-earnings run. It is important to prepare ahead of earnings runs, which form 2-4 weeks ahead of the earnings release date. Dark Pools already know most of what is in the report. The long reversal tail candlestick signaled the probable run for a swing-style trade.
$AMZN: Fast Rebounds Reveal Fundamental Support LevelThe new technologies that Amazon is embracing, including robots/robotics, and a brilliant CEO keep this huge company moving forward.
The HFT-driven gap down in August was massive but the rebound was fast. This isn't the first time the stock has moved right back up to its prior quarter's fundamental support range, aka Dark Pool Buy Zone.
Now, NASDAQ:AMZN is slightly above that range to challenge the July high. A stock to watch ahead of its earnings report October 24th.

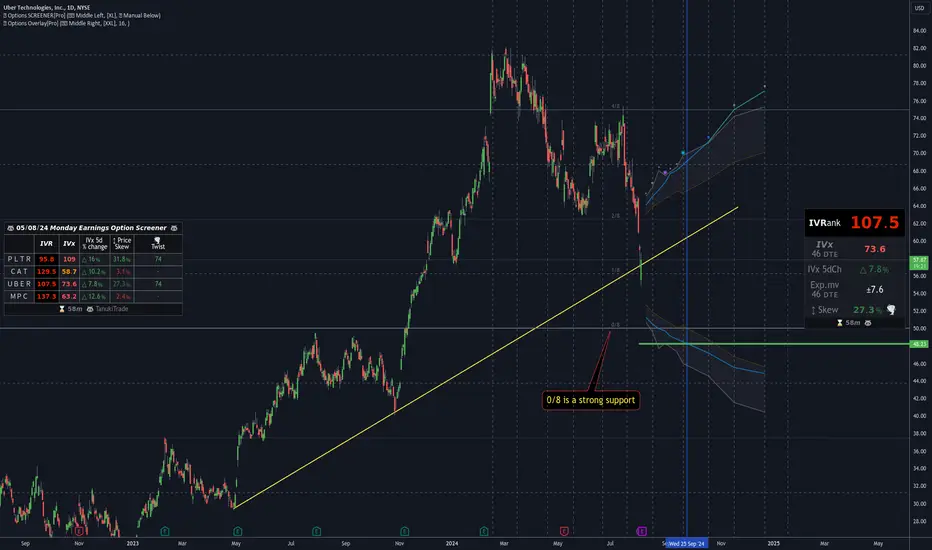
Maximize Gains with Options for $UBER: Option Chain Outlook The NYSE:UBER stock price had been in an uptrend until it reached around the $75 level, after which it entered a correction phase. The price is currently near a long-term upward trendline, which could act as strong support.
Volatility: The IVRank (Implied Volatility Rank) is 107.5, indicating that the current volatility is high compared to the values observed over the past year. The IVx value is 73.6, also indicating high volatility.
IVx 5-day Change: +7.8%, showing a significant increase in volatility over the past 5 days. This is common in the period leading up to earnings as investors prepare for the announcement.
Price Skew: The 27.3% skew indicates that call options are more in demand, which could suggest that investors are expecting a bullish movement post-earnings. A solid skew suggests higher demand for call options, indicating a potential bullish sentiment among investors.
IVx (46 DTE): 73.6, indicating high volatility expected over the next 46 days. Volatility is likely to remain high around the earnings report, which is favorable for selling option premiums.
Exp.mV (46 DTE): The expected move over the next 46 days is $7.6, indicating that investors are pricing significant price movement after the earnings report.
PLTR Earnings Options Analysis: Strong SupportsCurrent Price Level: NYSE:PLTR is currently trading around 23.79 USD.
Options Data:
IVRank: 95.8, indicating that the current implied volatility is at the 95.8th percentile over the past 52 weeks.
IV% 5d Change: 16%, showing a significant increase in implied volatility over the past 5 days.
Exp. move at 46 DTE: 4.6% for options expiring in 46 days.
Price Skew: 31.8%, indicating the difference between the bid and ask prices of options.
Market participants overpriced call options by 31.8% for the September expiration, indicating bullish sentiment despite the significant panic in the markets today.
Support Level: There is strong support below the 4/8 level, which is crucial for put options.
The green line represents the strike price expected by the market based on the options chain for 46 days to expiration (46 DTE), around 18 USD.
The Delta 16 PUT level is below the 4/8 Murrey Math level, indicating strong support based on the status of the current optionchain.

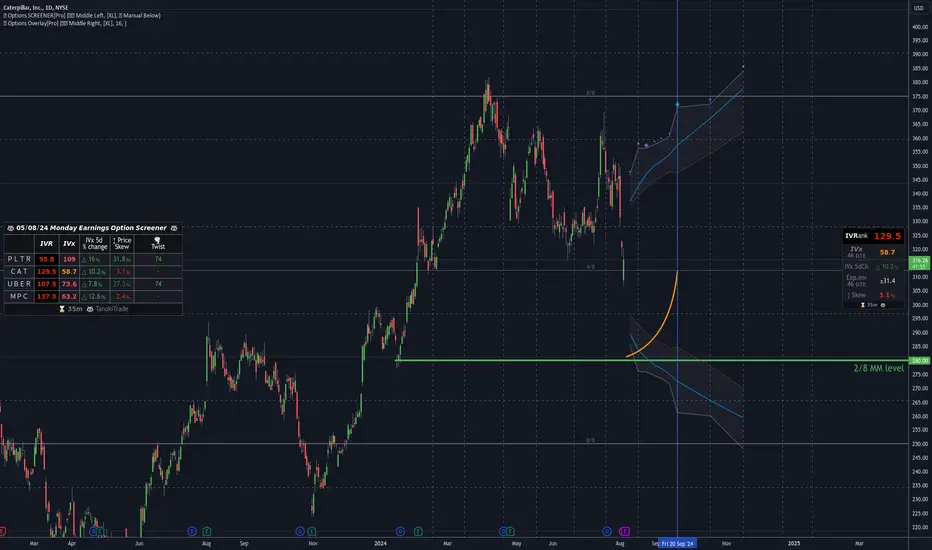
Options Analysis for Caterpillar Inc. ($CAT)Key Levels and Indicators:
Current Price: $316.49
IV Rank: 129.5
IV (46 DTE): 58.7%
IV Change (5 Days): +10.2%
Expected Move (46 DTE): $31.4
Price Skew: 3.1% for PUTs (almost neutral)
The market appears to anticipate that the price of NYSE:CAT will remain above this strike price ($280) by the expiration date of 46 days (DTE).
A 5-day change in IV of +10.2% indicates increasing volatility possibly due to upcoming earnings or other significant events + today crash of SP500.
An expected move of $31.4 suggests that the market predicts CAT could move within a $31.4 range from its current price over the next 46 days.
The green horizontal line at $280 represents a critical support level at MurreyMath 2/8.
AMZN is at weekly and daily demand zones.NASDAQ:AMZN is at key weekly and daily demand zones which have held up for the past several months. The daily 100 EMA and weekly 20 EMA have served as strong demand zones on this entire move higher after last earnings season, and we have been swinging the stock long from these levels in the $170s, before scaling out at $190 and $200 targets. This dip into $182 is a great level to reload equity that was sold into targets for a potential move back to highs. The trade will be invalidated if it builds below these levels; however, entry here provides favorable reward-to-risk ratio.

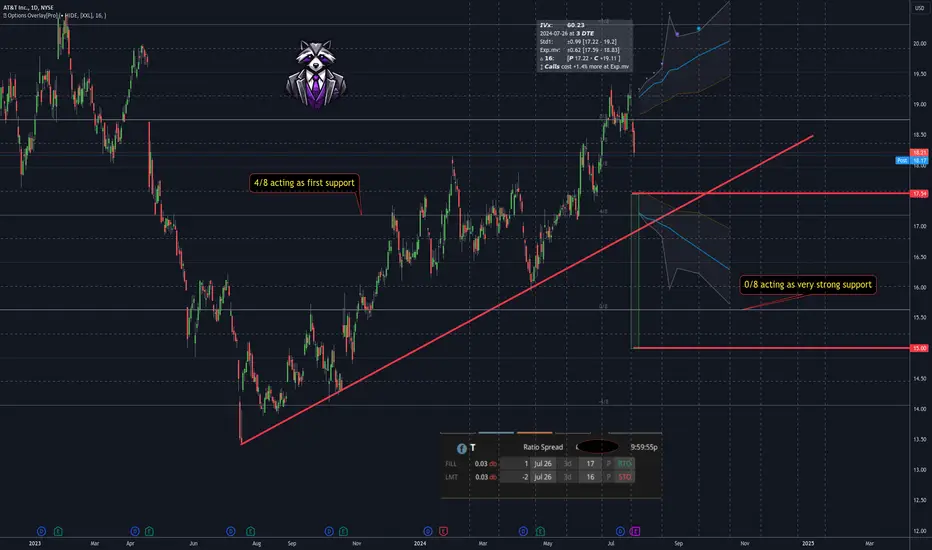
$T cheapest good R:R earnings play2024-07-23 at 3DTE
NYSE:T Jul 26th 16/17 Put Ratio Spread
Options Overlay indicator and Options Screener in action.
Tomorrow before open : Earnings
Max loss: $2.5
Max profit: $97
Bp.req: $200
Bearish micro, bullish macro.
I expect that even in the event of a possible fall, the 4/8 will hold the price.
If it doesn't, then the upward macro trend.
So I went for a pretty safe-looking trade, with the green rage showing the range of returns, so I will sleep well :)
PUTS = CALLS equally priced for 3DTE.
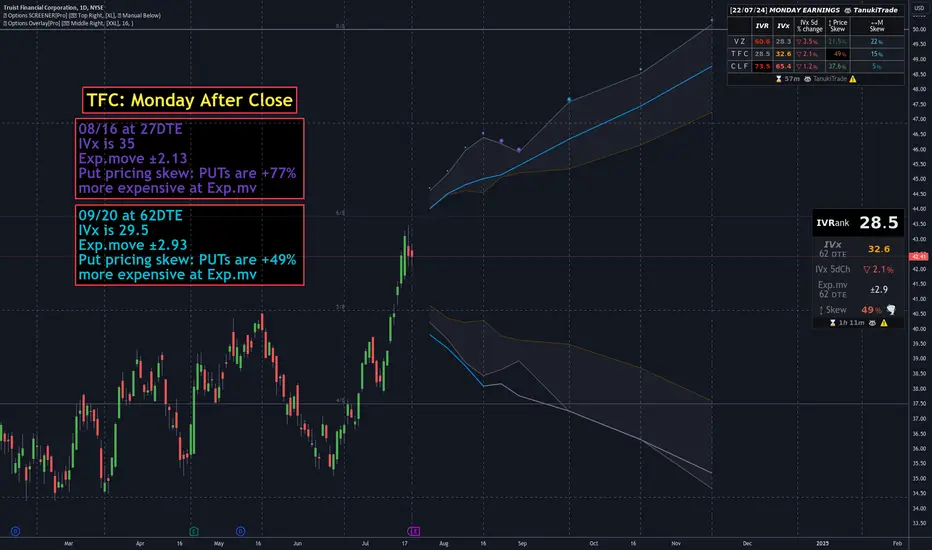
$TFC Options visualization - Earnings at Monday After Close NYSE:TFC Earnings at Monday After Close
Hard PUT pricing skew
Interpolated DELTA16 is far below the STD1
4/8 could be act as support
08/16 at 27DTE
IVx is 35
Exp.move ±2.13
Put pricing skew: PUTs are +77%
more expensive at Exp.mv
09/20 at 62DTE
IVx is 29.5
Exp.move ±2.93
Put pricing skew: PUTs are +49%
more expensive at Exp.mv
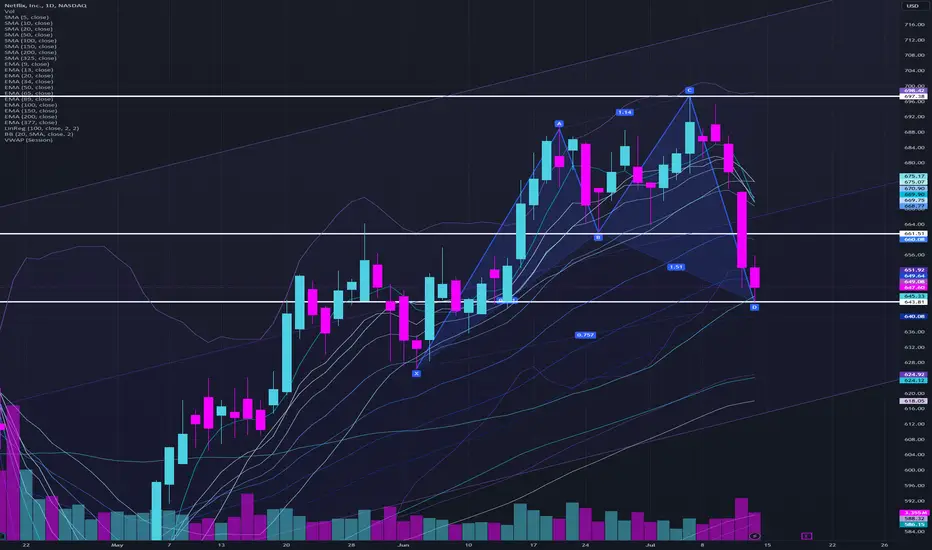
NFLX shark harmonicNASDAQ:NFLX daily chart is showing a bullish shark harmonic, with the entry point at D corresponding to the critical daily 50 SMA. The first profit target at B corresponds to the daily 34 EMA, and the second target at C corresponds to the daily upper Bollinger Band. NASDAQ:NFLX starts off the NASDAQ:QQQ earnings season, and reports after market close on Thursday.