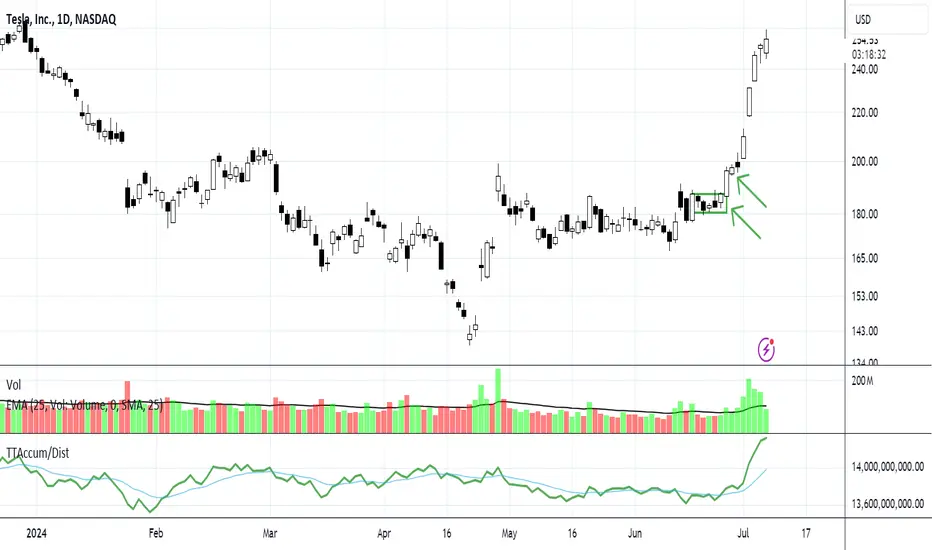
Pro Setups for Swing Trading Ahead of News: TSLANASDAQ:TSLA had a velocity run on the release of its production update for Q2. Velocity runs have gaps between candles which do not overlap. It is a run of enormous speculation to gambling mode and the professionals are taking advantage of it. Notice the pro trader setup candle patterns prior to the retail side getting the news.
Earningsseason
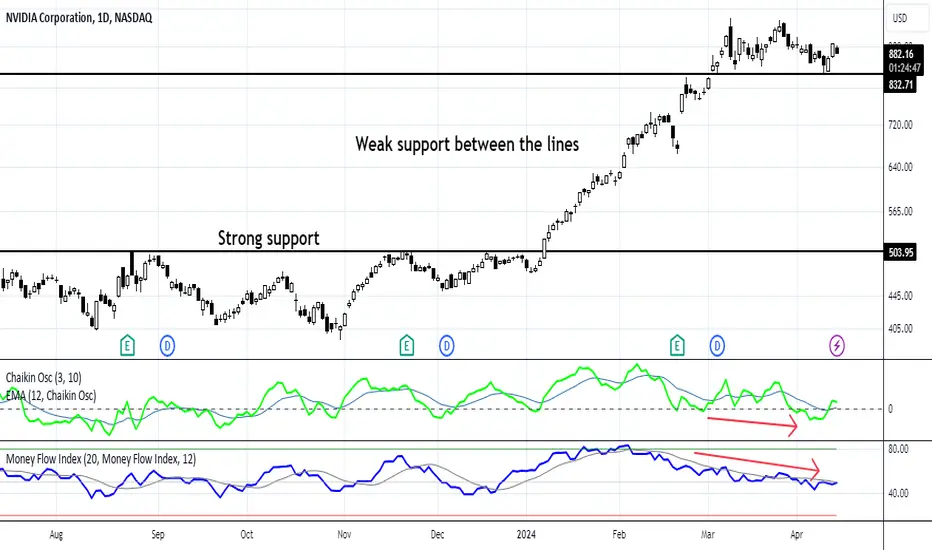
Weakening Patterns: NVDANASDAQ:NVDA is over-speculated on the short-term and intermediate-term trends. It has minimal support nearby for holding for a position trade.
Without retail groups or smaller funds, the price action is weakening at this time. Nvidia doesn't report until May 22 which is very late in the season but for now, it has some minor rotation going on.
If it continues to hold above the black line, then it can pattern out the excessive price gains. This is not a strong sell short opportunity, but it is important to keep an eye on this stock for the next couple of weeks.
Why did HPE Breakout?As shown on the one-hour chart, in the last trading session, HPE broke out of its usual trading
the range being the blue high-volume area on the profile. This is with increased volatility as
shown by the indicator and the large top wicks on the rising green candles. Why did this
occur? Were traders simply buying anything in the IT sector vaguely related to AI after the
NVDA breakout? Does HPE have a role in artificial intelligence? Was this a sympathy play?
The Luxalgo Supply / Demand indicator shows supply immediately overhead. The wicks on the
last several candles show a defined level. This might be called a " tweezer top " Overall,
I see this as an excellent short setup to be played with either short selling or a put option as the
retracement seems inevitable.

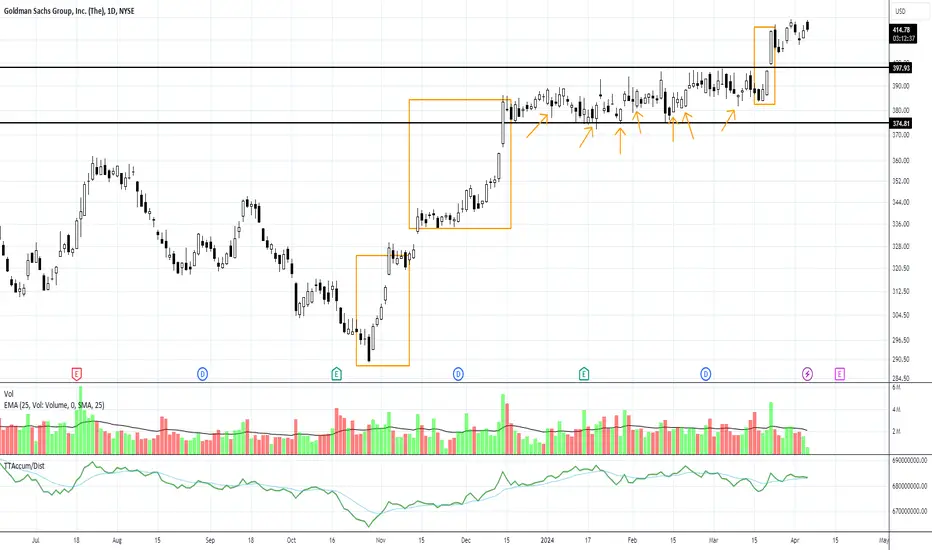
Goldman Sachs, the Buyback King?Goldman Sachs, one of the very few giant financial services companies left, is intending to do the first mega buyback program that will exceed One TRILLION dollars into 2025. Gasp.
So the chart shows the initial buybacks commencing and the support of its stock price during the very dicey sideways trend.
The company reports earnings Monday, April 15. Enough time to catch another swing run to earnings if the current consolidation breaks out to the upside.
NYSE:GS is a Sell Side Institution and admits it is heavily vested in NASDAQ:NVDA and other big tech stocks at this time. GS benefits from higher interest rates holding through this year.
JPM Earnings Next Week: Will Buybacks Hold Up the Stock?NYSE:JPM reached New Highs recently with a huge number of buybacks driving the stock upward so fast and so high. The big bank has also been busy gobbling up regional banks for two years now. JPM's floor traders, trading aggressively in a few key industries, are doing well.
However, Revenues and Earnings were down last quarter over the prior quarter. And Volume is trending slightly lower over the quarter. An overextended run into earnings often sees profit-taking ahead of or on the day of the report.
Smaller funds are in speculative mode chasing the buybacks. Why did smaller funds rush to buy on earnings last quarter? Year over Year comparisons show revenues and earnings are up. Year over year often distorts current values.
What matters is the most current data, quarter over quarter, for the Buy Side Institutions.

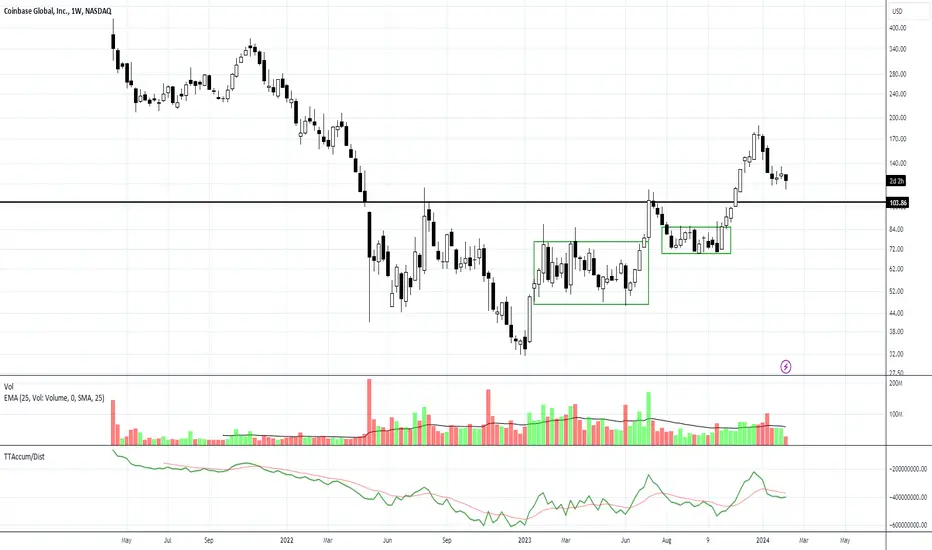
COIN Completes First Post-IPO BottomAs the first of its kind, this young company has a bright future.
Weekly chart: NASDAQ:COIN has completed its first post-IPO bottom formation and is holding above the completion line despite some selling down in recent weeks.
The company reports Feb 15th. The fundamentals are most likely at or near the bottom completion level. The run up became over-speculated so a minor correction is underway that can dip into the completion level, but support from the bottom formation is strong with Dark Pool buy zone patterns.
The Big 4 Earnings Releases today (POSITIVE)The Big 4 Earnings Releases today (POSITIVE)
✅ Novo Nordisk ⬆️
✅ Mastercard ⬆️
⌛️ Qualcomm (released later today)
✅ Boston Scientific ⬆️
The chart shows expected & reported earnings & price action. IMO Mastercard looks particularly promising.
NYSE:NVO NYSE:MA NASDAQ:QCOM NYSE:BSX

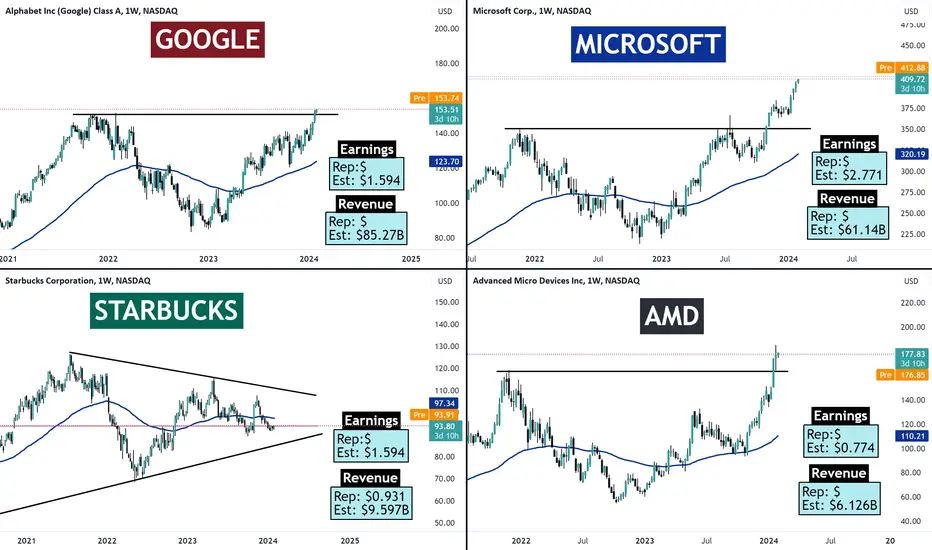
The 4 Big Earnings Releases For Today (updated later)The 4 Big Earnings Releases For Today
I will update these charts later with there reported earnings and revenue. You can see that NASDAQ:MSFT leads the pack with relative strength.
Premarket Google and Microsoft are showing higher prices whilst Starbucks and AMD are showing lower premarket prices (see orange price bars)
NASDAQ:GOOGL NASDAQ:AMD NASDAQ:SBUX #earnings
PUKA
NVDA at the CES Ahead of Earnings Next MonthNASDAQ:NVDA moved up on the excitement around AI at the Consumer Electronics Show. We can see that Professional Traders were anticipating a breakout.
The stock should be able to begin some pre-earnings runs soon, as long as revenues and earnings continue to improve.
Volume Oscillators and Money Flow Indicators have been improving as Derivative Developers continued to increase inventory.

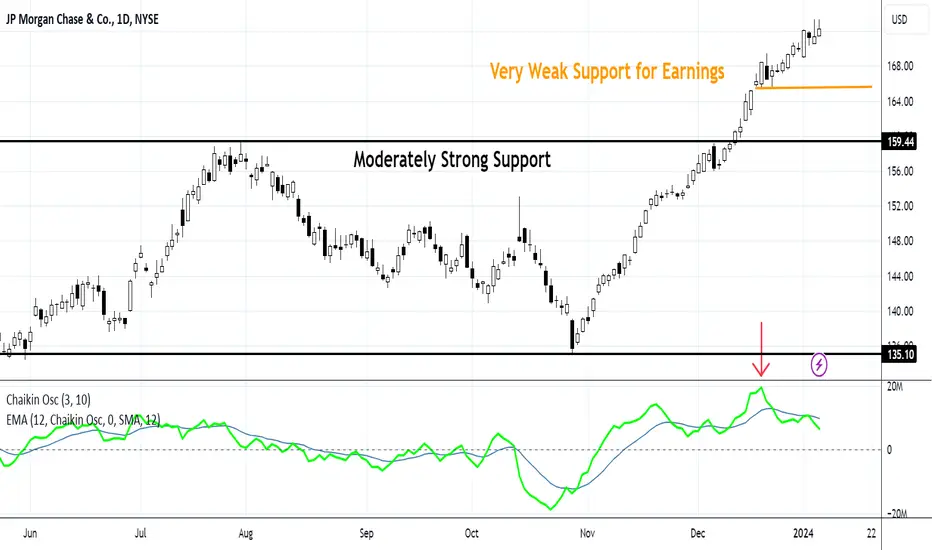
Over-speculated Patterns Heading Into Earnings SeasonNYSE:JPM is the last Bank that has been able to hold onto its Dow 30 component status. It is running up on a combination of buybacks and ETF development for Dow 30 index components.
The stock is over-speculated heading into the earnings season. Volume Oscillators show the extreme pattern clearly. So even minimal weakness in the earnings report could cause an HFT trigger. It might surprise either way.
Some of its growth in 2023 was due to the regional bank debacle when JPM chose certain small banks to target for a silent hostile takeover.
Solid Small Caps for EarningsAnyone finding interesting setups in small caps this earnings season?
These often have more reliable patterns for swing trading. Since they are largely under the radar of the retail crowd, institutional patterns can be clearer.
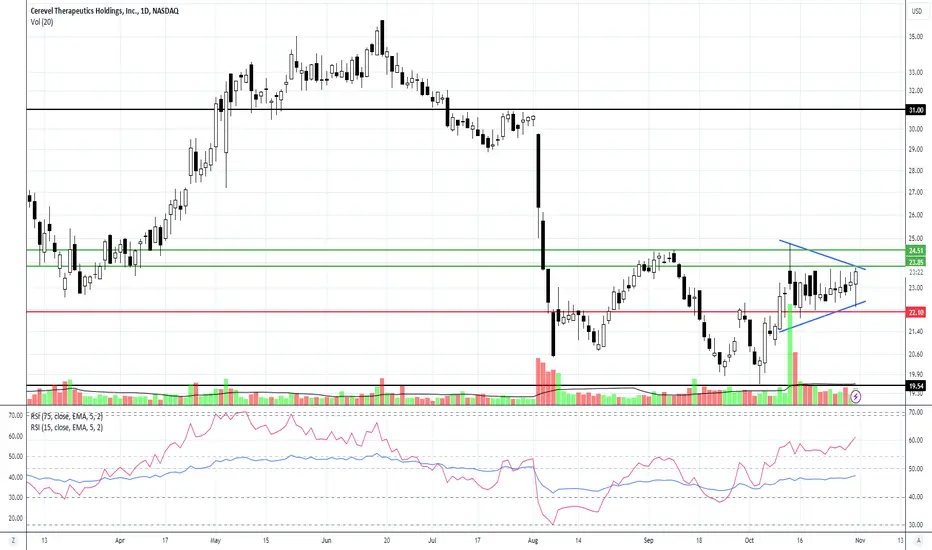
NASDAQ:CERE is an example of a stock coming up in TechniTrader scans today. It has 88% institutional holdings. A compression pattern is developing. HFTs have been in it recently, possibly due to intermittent accumulation. The strengthening of the sideways action is particularly visible with the RSI indicator.
Dark Pool accumulation tends to cause controlled sideways patterns like this, a key ingredient for what we call Relational Technical Analysis at TechniTrader.
Because this has had a swing-style run out of the last compression pattern at a low in this longer trading range, a swing trade could be considered on the breakout, either above today's high or above the last resistance level for a more conservative entry. (Green lines on the chart) My target would be 31, but of course I'd be watching for exit signals or an extreme pattern to take profits early. Stop loss at the red line on the chart.
A more aggressive trader could look at an entry ahead of the close today if pro trader patterns emerge in the last 15 minutes with an exit shortly after the open if a run or gap up develops for an EOD to FOD trade.
Happy Trading!
Guest author: Mele Ainuu, Senior Technical Analyst, Student Support @ TechniTrader
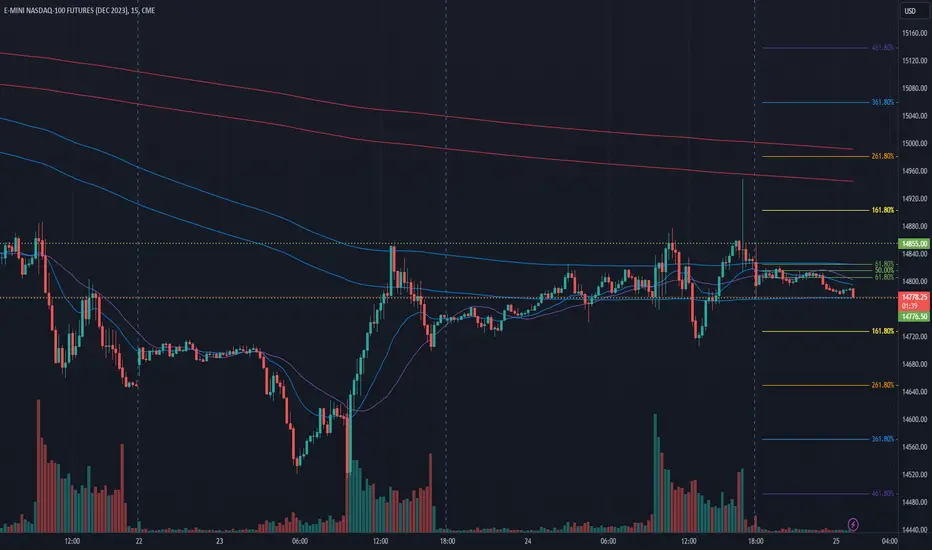
NQ Power Range Report with FIB Ext - 10/25/2023 SessionCME_MINI:NQZ2023
- PR High: 14854.50
- PR Low: 14776.00
- NZ Spread: 175.5
Key Economic Events
08:00 – Building Permits
10:00 – New Home Sales
10:30 – Crude Oil Inventories
16:35 – Fed Chair Powell Speaks
Session opened with high volatility
- Created super wide NZ spread
- Credit given to earningns
- Holding inside prev session range
Evening Stats (As of 12:25 AM)
- Weekend Gap: +0.21% (filled)
- Session Gap 8/2: -0.33% (open > 15807)
- Session Gap 7/20: -0.11% (open > 15939)
- Session Open ATR: 255.16
- Volume: 31K
- Open Int: 251K
- Trend Grade: Neutral
- From ATH: -11.7% (Rounded)
Key Levels (Rounded - Think of these as ranges)
- Long: 15247
- Mid: 14675
- Short: 14103
Keep in mind this is not speculation or a prediction. Only a report of the Power Range with Fib extensions for target hunting. Do your DD! You determine your risk tolerance. You are fully capable of making your own decisions.
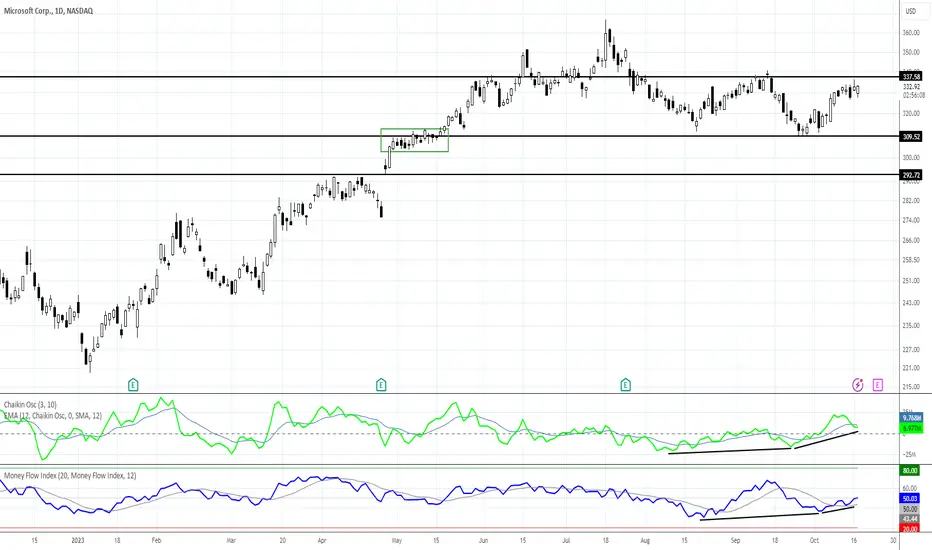
MSFT Showing Strength on Retest Ahead of EarningsPercentage of Shares Held by Institutions is a bit low at 69% for NASDAQ:MSFT stock right now. However, the indicators are showing some strength as it retests the lower level of resistance above its current price.
NASDAQ:MSFT reports earnings next week on Tuesday. Microsoft has focused on AI for small businesses, the market niche that helped move it out of its 16-year slump until 2016, and during the pandemic. The pandemic anomalies in revenues should be patterned out this earnings season.
The stock has ample support at the most recent lows. It is a heavily weighted component of all 3 indexes, so an important report for Q3.
$TSLA Earnings Projection! Can the Weekly Downtrend Break?These are projections based on my form of technical analysis. So far regarless of the sentiment we remain in a lower time frame uptrend. We are at a downtrend started from the end of 2021 and with the market fearful the trend could easily change.
My bullish projection for a gap and go is 320
My bearish projection would be 196 with a wick and close at 217
Otherwise, if neither triggers are broken I would expect sideways option burn price action.
Remember Earnings are always a gamble, while I do believe the chart can show us, a side ways stock is a triggerless one.

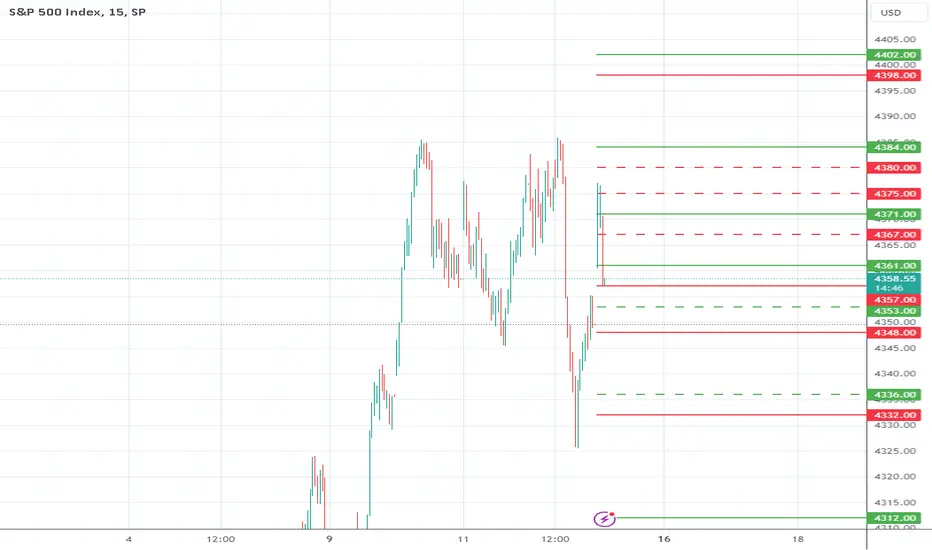
Earnings Season Kicks OffS&P 500 INDEX MODEL TRADING PLANS for FRI. 10/13
Today marks the kick off of the Q3 earnings season, and a potential inflection points in the geopolitical risks with signs of potential ground operations to begin by Israel in Gaza. Geopolitical risks, high interest rates, sticky inflation - reiterated by this morning's CPI numbers, extremely strong jobs market, early signs of consumers beginning to scale back...yet, retail bullish positioning has increased this week again. Is this Fools rushing in where Angels fear to tread or retail investors having some crystal ball into the future that institutions don't have access to? Only time can tell.
However, our AI-driven models (since 2018 - not a "me too AI" bandwagon hopper) have negated the bearish bias yesterday, Tue. 10/10, based on the last two sessions' price action and in line with what we have been publishing for the last week or so: "Our models indicate 4310 as the level to close above for the current bearish bias to be negated". Now, this 4310 is the main support level and a daily close below that is needed for our models to turn bearish.
Aggressive, Intraday Trading Plans:
For today, our aggressive intraday models indicate going long on a break above 4402, 4384, 4371, 4361, or 4312 with a 9-point trailing stop, and going short on a break below 4398, 4357, 4348, 4332, or 4308 with a 9-point trailing stop.
Models indicate explicit long exits on a break below 4380, 4375, or 4367, and explicit short exits on a break above 4353 or 4336. Models also indicate a break-even hard stop once a trade gets into a 4-point profit level. Models indicate taking these signals from 10:11am EST or later.
By definition the intraday models do not hold any positions overnight - the models exit any open position at the close of the last bar (3:59pm bar or 4:00pm bar, depending on your platform's bar timing convention).
To avoid getting whipsawed, use at least a 5-minute closing or a higher time frame (a 1-minute if you know what you are doing) - depending on your risk tolerance and trading style - to determine the signals.
(WHAT IS THE CREDIBILITY and the PERFORMANCE OF OUR MODEL TRADING PLANS over the LAST WEEK, LAST MONTH, LAST YEAR? Please check for yourself how our pre-published model trades have performed so far! Seeing is believing!)
NOTES - HOW TO INTERPRET/USE THESE TRADING PLANS:
(i) The trading levels identified are derived from our A.I. Powered Quant Models. Depending on the market conditions, these may or may not correspond to any specific indicator(s).
(ii) These trading plans may be used to trade in any instrument that tracks the S&P 500 Index (e.g., ETFs such as SPY, derivatives such as futures and options on futures, and SPX options), triggered by the price levels in the Index. The results of these indicated trades would vary widely depending on the timeframe you use (tick chart, 1 minute, or 5 minute, or 15 minute or 60 minute etc.), the quality of your broker's execution, any slippages, your trading commissions and many other factors.
(iii) These are NOT trading recommendations for any individual(s) and may or may not be suitable to your own financial objectives and risk tolerance - USE these ONLY as educational tools to inform and educate your own trading decisions, at your own risk.
#spx, #spx500, #spy, #sp500, #esmini, #indextrading, #daytrading, #models, #tradingplans, #outlook, #economy, #bear, #yields, #stocks, #futures, #inflation, #recession, #softlanding, #higher4longer, #higherforlonger, #israel, #geopolitical, #earnings
A brief Analysis of meta Facebook stockLooking at the stock post Earnings date, what things become Immediately clear? do you See an Uptrend? Is momentum Gaining or declining? How is the Company's approach to AI working? Are there any observations that you can make by looking at this chart?

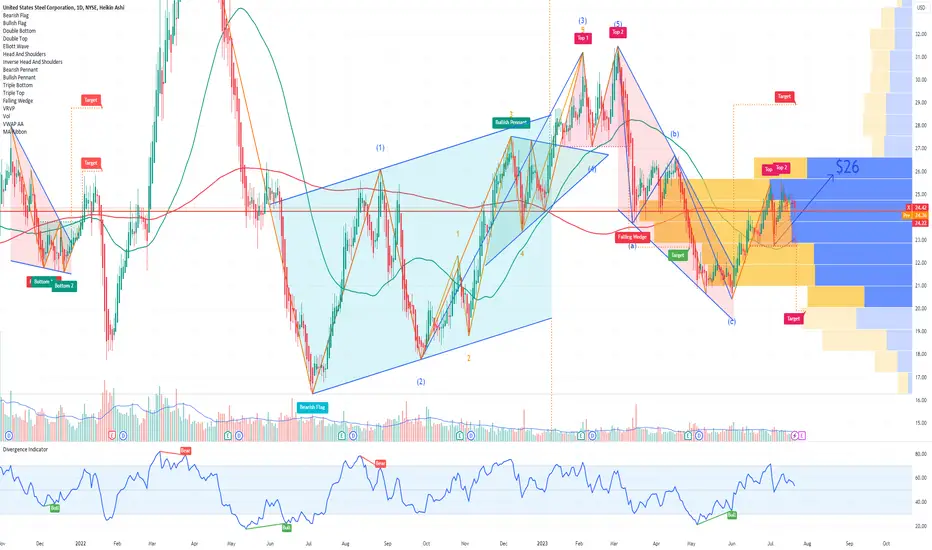
X United States Steel Corporation Options Ahead of EarningsIf you haven`t bought X here:
Then analyzing the options chain and the chart patterns of X United States Steel Corporation prior to the earnings report this week,
I would consider purchasing the 26usd strike price Calls with
an expiration date of 2023-10-20,
for a premium of approximately $1.24.
If these options prove to be profitable prior to the earnings release, I would sell at least half of them.
Looking forward to read your opinion about it.
ES Levels - CGG Newsletter 07/31-08/04Upside
4628 → 4643 → 4667 → 4695
Downside
4604 → 4587 → 4564 → 4554
ES is forming a bull flag on the daily.
A breakout to the upside can send us to the daily FVGs above:
4667-4695 (Fib extension 50%-61.8%)
4716-4765
Full Measured Move at 4777
All Time High 4808

SNAP Options Ahead of EarningsIf you haven`t sold SNAP here:
or ahead of the previous earnings:
Then analyzing the options chain and chart patterns of SNAP prior to the earnings report this week,
I would consider purchasing the 13usd strike price Calls with
an expiration date of 2023-7-28,
for a premium of approximately $1.34.
If these options prove to be profitable prior to the earnings release, I would sell at least half of them.
Looking forward to read your opinion about it.

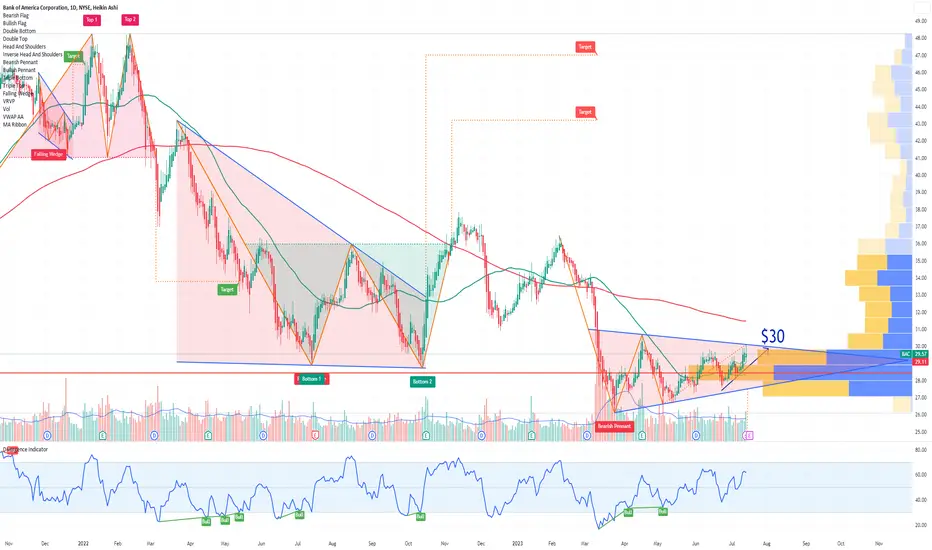
BAC Bank of America Corporation Options Ahead of EarningsIf you haven`t bought BAC here:
Then analyzing the options chain of BAC Bank of America Corporation prior to the earnings report this week,
I would consider purchasing the 30usd strike price Calls with
an expiration date of 2023-9-15,
for a premium of approximately $0.83.
If these options prove to be profitable prior to the earnings release, I would sell at least half of them.
Looking forward to read your opinion about it.
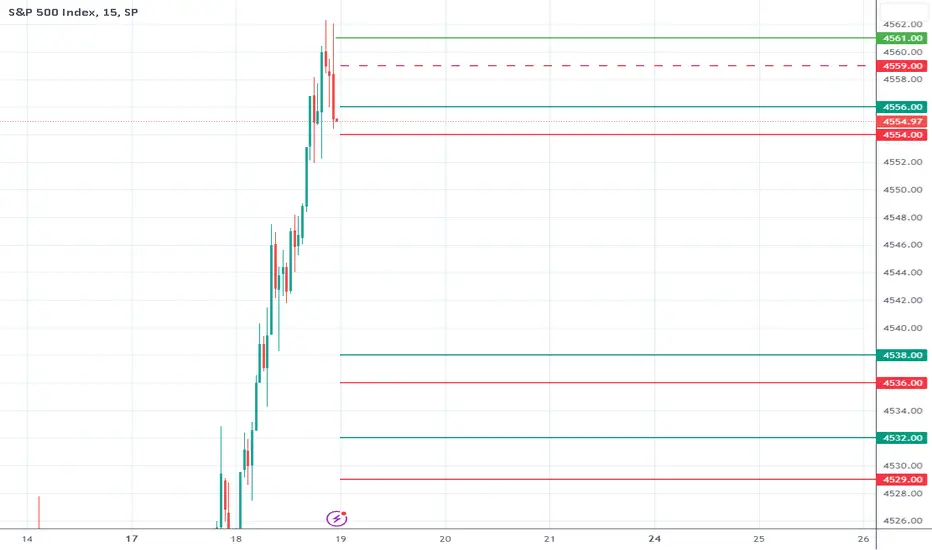
Q2 Earnings Releases Gain Momentum - Day 3S&P 500 INDEX MODEL TRADING PLANS for WED. 07/19
This week's earnings should shed some light on how the markets are shaping up in the wake of the sticky inflation. With a quarter-point rate increase almost a given, the July FOMC meeting may be a non-event, and earnings could be the driving force for the next few weeks.
Early earnings so far indicate strong earnings momentum. If the earnings continue to appear to be on track or with a bias to the upside surprises then the next bull leg could get well entrenched. But, If the earnings show any unexpected weakness ("unexpected" is the key word there), then we might have seen an interim top.
The previously stated level of 4500-4505 is now a key area of support, and 4605-4610 is the upside target - and, next area of resistance - which could be tested in the near future if earnings momentum continues.
Positional Trading Models: Our positional models indicate staying out of the markets until otherwise stated.
By definition, positional trading models may carry the positions overnight and over multiple days, and hence assume trading an index-tracking instrument that trades beyond the regular session, with the trailing stops - if any - being active in the overnight session.
Aggressive/Intraday Models: Our aggressive, intraday models indicate the trading plans below for today.
Aggressive, Intraday Trading Plans:
For today, our aggressive intraday models indicate going long on a break above 4561, 4556, 4538, or 4532 with an 8-point trailing stop, and going short on a break below 4554, 4536, or 4529 with a 9-point trailing stop.
Models indicate explicit long exits on a break below 4559. Models also indicate a break-even hard stop once a trade gets into a 4-point profit level. Models indicate taking these signals from 09:31am EST or later.
By definition the intraday models do not hold any positions overnight - the models exit any open position at the close of the last bar (3:59pm bar or 4:00pm bar, depending on your platform's bar timing convention).
To avoid getting whipsawed, use at least a 5-minute closing or a higher time frame (a 1-minute if you know what you are doing) - depending on your risk tolerance and trading style - to determine the signals.
(WHAT IS THE CREDIBILITY and the PERFORMANCE OF OUR MODEL TRADING PLANS over the LAST WEEK, LAST MONTH, LAST YEAR? Please check for yourself how our pre-published model trades have performed so far! Seeing is believing!)
NOTES - HOW TO INTERPRET/USE THESE TRADING PLANS:
(i) The trading levels identified are derived from our A.I. Powered Quant Models. Depending on the market conditions, these may or may not correspond to any specific indicator(s).
(ii) These trading plans may be used to trade in any instrument that tracks the S&P 500 Index (e.g., ETFs such as SPY, derivatives such as futures and options on futures, and SPX options), triggered by the price levels in the Index. The results of these indicated trades would vary widely depending on the timeframe you use (tick chart, 1 minute, or 5 minute, or 15 minute or 60 minute etc.), the quality of your broker's execution, any slippages, your trading commissions and many other factors.
(iii) These are NOT trading recommendations for any individual(s) and may or may not be suitable to your own financial objectives and risk tolerance - USE these ONLY as educational tools to inform and educate your own trading decisions, at your own risk.
#spx, #spx500, #spy, #sp500, #esmini, #indextrading, #daytrading, #models, #tradingplans, #outlook, #economy, #bear, #yields, #stocks, #futures, #inflation, #recession, #earnings
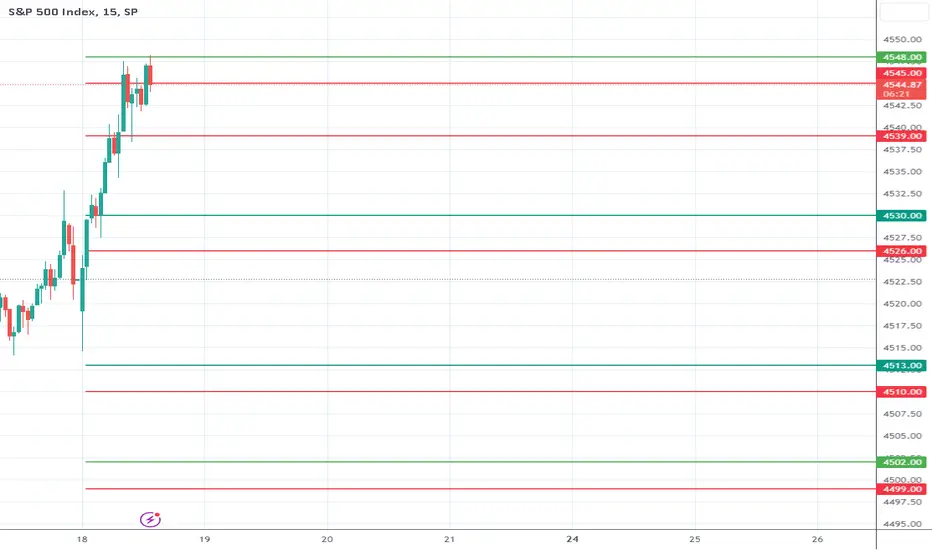
Earnings Under Microscope - Day 2S&P 500 INDEX MODEL TRADING PLANS for TUE. 07/18
This week's earnings should shed some light on how earnings are shaping up in the wake of the sticky inflation. With a quarter-point rate increase almost a given, the July FOMC meeting may be a non-event, and earnings could be the driving force for the next few weeks.
Early earnings yesterday and today indicate strong earnings momentum. If the earnings continue to appear to be on track or with a bias to the upside surprises then the next bull leg could get well entrenched. But, If the earnings show any unexpected weakness ("unexpected" is the key word there), then we might have seen an interim top.
The previously stated level of 4500-4505 is now a key area of support to watch.
Positional Trading Models: Our positional models indicate staying out of the markets until otherwise stated.
By definition, positional trading models may carry the positions overnight and over multiple days, and hence assume trading an index-tracking instrument that trades beyond the regular session, with the trailing stops - if any - being active in the overnight session.
Aggressive/Intraday Models: Our aggressive, intraday models indicate the trading plans below for today.
Aggressive, Intraday Trading Plans:
For today, our aggressive intraday models indicate going long on a break above 4548, 4530, 4513, or 4502 with an 8-point trailing stop, and going short on a break below 4545, 4539, 4526, 4510, or 4499 with a 9-point trailing stop.
Models indicate no explicit exits for the day. Models also indicate a break-even hard stop once a trade gets into a 4-point profit level. Models indicate taking these signals from 01:16pm EST or later.
By definition the intraday models do not hold any positions overnight - the models exit any open position at the close of the last bar (3:59pm bar or 4:00pm bar, depending on your platform's bar timing convention).
To avoid getting whipsawed, use at least a 5-minute closing or a higher time frame (a 1-minute if you know what you are doing) - depending on your risk tolerance and trading style - to determine the signals.
(WHAT IS THE CREDIBILITY and the PERFORMANCE OF OUR MODEL TRADING PLANS over the LAST WEEK, LAST MONTH, LAST YEAR? Please check for yourself how our pre-published model trades have performed so far! Seeing is believing!)
NOTES - HOW TO INTERPRET/USE THESE TRADING PLANS:
(i) The trading levels identified are derived from our A.I. Powered Quant Models. Depending on the market conditions, these may or may not correspond to any specific indicator(s).
(ii) These trading plans may be used to trade in any instrument that tracks the S&P 500 Index (e.g., ETFs such as SPY, derivatives such as futures and options on futures, and SPX options), triggered by the price levels in the Index. The results of these indicated trades would vary widely depending on the timeframe you use (tick chart, 1 minute, or 5 minute, or 15 minute or 60 minute etc.), the quality of your broker's execution, any slippages, your trading commissions and many other factors.
(iii) These are NOT trading recommendations for any individual(s) and may or may not be suitable to your own financial objectives and risk tolerance - USE these ONLY as educational tools to inform and educate your own trading decisions, at your own risk.
#spx, #spx500, #spy, #sp500, #esmini, #indextrading, #daytrading, #models, #tradingplans, #outlook, #economy, #bear, #yields, #stocks, #futures, #inflation, #recession, #earnings
Q2 Earnings to Come Under MicroscopeS&P 500 INDEX MODEL TRADING PLANS for MON. 07/17
The big banks have kickstarted the earnings season last Friday with JP Morgan and Wells Fargo, and are going to gain steam this week with other big names in Finance and Tech. This week should shed some light on how earnings are shaping up in the wake of the sticky inflation. With a quarter-point rate increase almost a given, the July FOMC meeting may be a non-event, and earnings could be the driving force for the next few weeks.
If early earnings show any unexpected weakness ("unexpected" is the key word there), then we might have seen an interim top; but, if the earnings appear to be on track or with a bias to the upside surprises then the next bull leg could get well entrenched.
The previously stated level of 4500-4505 is now a key area to watch for both as a support and as a resistance level.
Positional Trading Models: Our positional models indicate staying out of the markets until otherwise stated.
By definition, positional trading models may carry the positions overnight and over multiple days, and hence assume trading an index-tracking instrument that trades beyond the regular session, with the trailing stops - if any - being active in the overnight session.
Aggressive/Intraday Models: Our aggressive, intraday models indicate the trading plans below for today.
Aggressive, Intraday Trading Plans:
For today, our aggressive intraday models indicate going long on a break above 4526, 4520, 4513, or 4502 with an 8-point trailing stop, and going short on a break below 4510, 4499, or 4490 with a 9-point trailing stop.
Models indicate explicit long exits on a break below 4523 or 4517, and short exits on a break above 4493. Models also indicate a break-even hard stop once a trade gets into a 4-point profit level. Models indicate taking these signals from 11:31am EST or later.
By definition the intraday models do not hold any positions overnight - the models exit any open position at the close of the last bar (3:59pm bar or 4:00pm bar, depending on your platform's bar timing convention).
To avoid getting whipsawed, use at least a 5-minute closing or a higher time frame (a 1-minute if you know what you are doing) - depending on your risk tolerance and trading style - to determine the signals.
(WHAT IS THE CREDIBILITY and the PERFORMANCE OF OUR MODEL TRADING PLANS over the LAST WEEK, LAST MONTH, LAST YEAR? Please check for yourself how our pre-published model trades have performed so far! Seeing is believing!)
NOTES - HOW TO INTERPRET/USE THESE TRADING PLANS:
(i) The trading levels identified are derived from our A.I. Powered Quant Models. Depending on the market conditions, these may or may not correspond to any specific indicator(s).
(ii) These trading plans may be used to trade in any instrument that tracks the S&P 500 Index (e.g., ETFs such as SPY, derivatives such as futures and options on futures, and SPX options), triggered by the price levels in the Index. The results of these indicated trades would vary widely depending on the timeframe you use (tick chart, 1 minute, or 5 minute, or 15 minute or 60 minute etc.), the quality of your broker's execution, any slippages, your trading commissions and many other factors.
(iii) These are NOT trading recommendations for any individual(s) and may or may not be suitable to your own financial objectives and risk tolerance - USE these ONLY as educational tools to inform and educate your own trading decisions, at your own risk.
#spx, #spx500, #spy, #sp500, #esmini, #indextrading, #daytrading, #models, #tradingplans, #outlook, #economy, #bear, #yields, #stocks, #futures, #inflation, #recession, #earnings
