TSM - 5th leg down, 3 drive pattern SHORT CITYIt is in my humble opinion TSM is looking at a rather large drop looming ahead - symmetrically the pattern meets the harmonic qualifications as well as the elliot wave theory macro wave iterations.
It is possible TSM will make a small shoulder before breaking the $100 price level - should it break this level and close below I believe it will be a swift fall to the $85 level, however if it wasn't "quick" the position I hold does allow for some time.
Trade: 6/17 exp $85 PUTS @ 1.17 on 4/1 - currently trading at 1.62 at time of post
Earningsseason

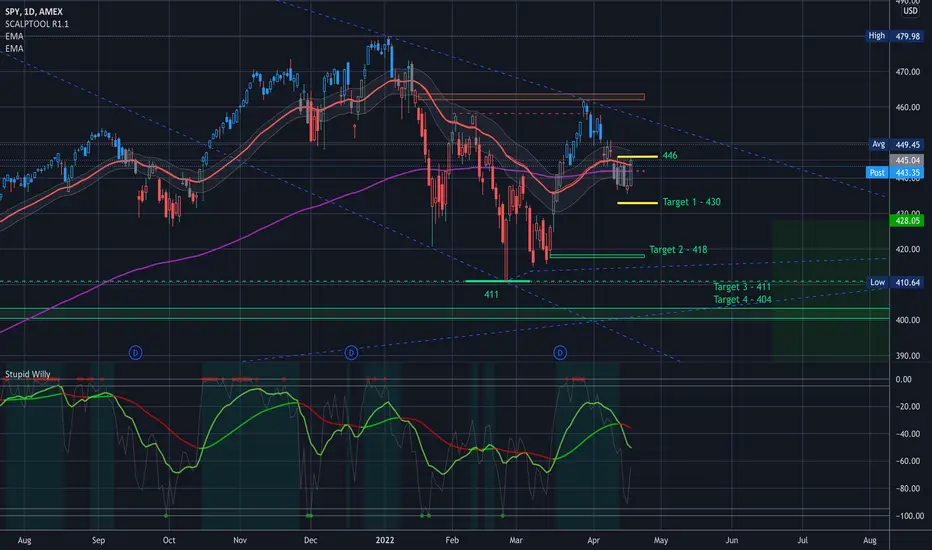
$SPY Key Levels, Analysis, & Targets $SPY Key Levels, Analysis, & Targets
Today with Vix up over 5% (up to 7, but I rolled around 5.5%) I took advantage and rolled my Long puts up to 446, and my short puts up to 430, making my strikes a little wider and setting up to collect more premium when vix goes back up.
My long strikes are still ITM (and in the bear gap), and the short strikes are a little further down.
And sell target is still 418…
---
On the Put side:
When VIX goes up, roll long puts down and short puts up to collect premium.
When VIX goes down, roll short puts down and long puts up, to strengthen your position.
On the Call side:
When VIX goes down roll long calls up and short calls down to collect premium.
When VIX goes up roll long calls down and short calls up to strengthen your position.
—-
I am not your financial advisor. Watch my setups first before you jump in… My trade set ups work very well and they are for my personal reference and if you decide to trade them you do so at your own risk. I will gladly answer questions to the best of my knowledge but ultimately the risk is on you. I will update targets as needed.
GL and happy trading.
IF you need anything analyzed Technically just comment with the Ticker and I’ll do it as soon as possible…
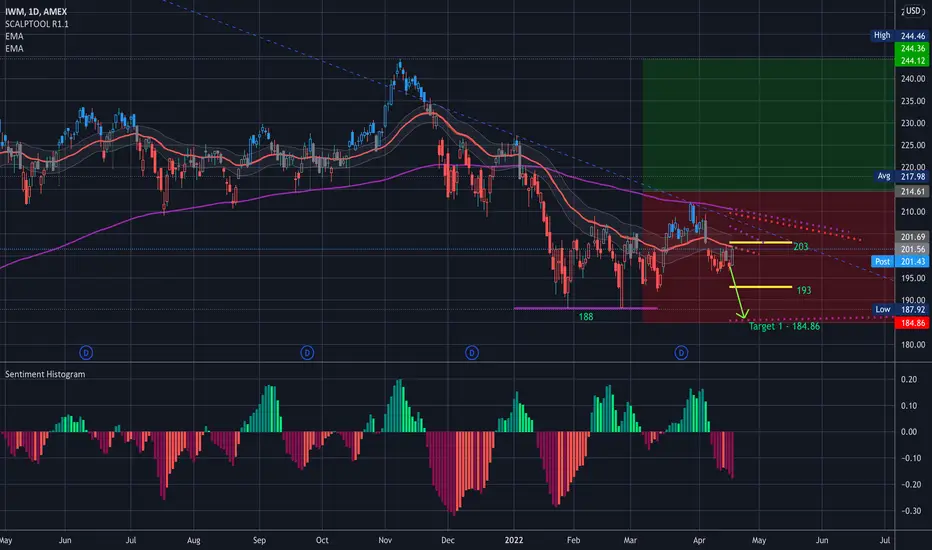
$IWM Key Levels, Analysis, & Targets $IWM Key Levels, Analysis, & Targets
So today with Vix up over 5% (up to 7, but I rolled around 5.5%) I took advantage and rolled my Long puts up to 203, and my short puts up to 193, making my strikes a little wider and setting up to collect more premium when vix goes back up.
My long strikes are still ITM, and the short strikes are a little further down.
And sell target is still 184…
—-
I am not your financial advisor. Watch my setups first before you jump in… My trade set ups work very well and they are for my personal reference and if you decide to trade them you do so at your own risk. I will gladly answer questions to the best of my knowledge but ultimately the risk is on you. I will update targets as needed.
GL and happy trading.
IF you need anything analyzed Technically just comment with the Ticker and I’ll do it as soon as possible…
Philip Morris: earnings play decent setup here with earnings in sight for a bullish play. Chart looks good and is building a base, with earnings as the fuel for the next leg higher. Even better if played with options, some lotto play.

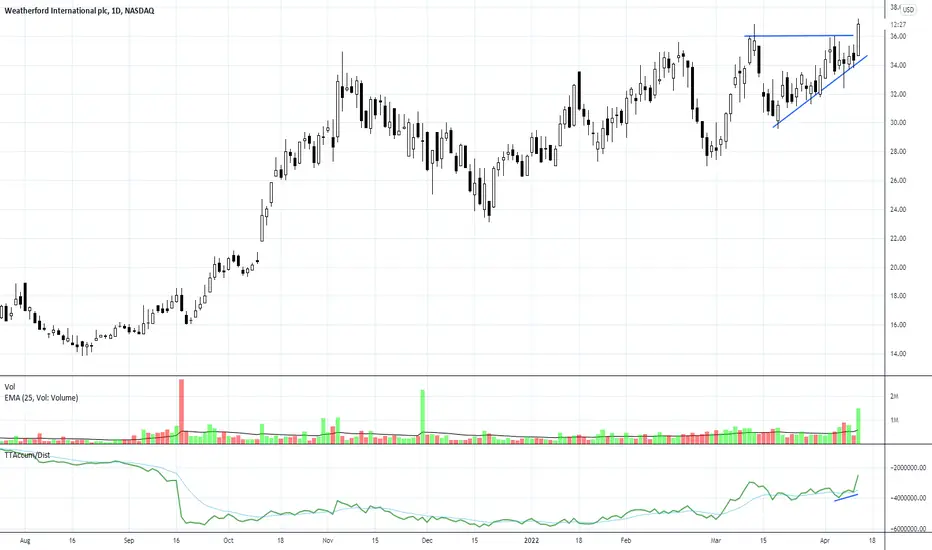
Breakout on accumulation patterns: WFRDThe breakout is on a surge of volume following "quiet accumulation" patterns in candlestick trendline and AccumDist indicators. Possible run to earnings for short-term.
Digital Turbine $APPS August 2021 BreakoutExpected earnings reporting on 4 August 2021 together with current trend may indicate a strong upwards momentum. $APPS has a recent history of beating analyst estimates.

How Earnings Season Affects OptionsAs most of you are aware, it is earnings season. So today we’re going to talk about how earnings season can impact options trading, because, as you know, I trade options.
Now, just a brief intro. Earnings season happens quarterly, meaning four times a year, and this is when corporations reveal their financial results for the previous quarter.
Now, the results of a company’s earnings report can have a major impact on the stock price, and options will often price in the expectations for a big post-earnings move before the event.
This is why it is likely that options premium are more expensive during this time.
Implied Volatility
One thing to know about this and how it can impact your trading is implied volatility. See, there several things that make up an options price, including the market’s expectation for future volatility, and that is called implied volatility.
So why is this important? Well, as the buyer of an option, higher implied volatility means that you are paying more for your contract.
So if you buy an option before earnings and hold through earnings, you put yourself at risk for a so-called volatility crash.
Now, part of the reason implied volatility goes up so much ahead of earnings is because traders don’t know which way the stock is going to go or by how much.
I mean, remember Netflix at the beginning of March? Who would have known that Netflix would soar 17%?
But you see, once a company reports earnings, there is no more uncertainty, and this is when implied volatility drops, and in some cases, so does the options price.
So if you bought an expensive option, there’s a chance that you have to sell it to close at a lower price even if a stock moves in the direction you want it to.
And let me show you a very, very specific example of a volatility crash and why it is so important that you understand the concept of volatility and how it can impact your options trading.
So I want to show you right here we see Seagate. Seagate reported earnings last week. And so here is the pre-earnings options data.
The day before Seagate, STX, was trading at $61.45, and an At-The-Money call with a 61.50 strike price was going for the last traded price of $1.74, and the implied volatility was 128%.
On the other hand, the put was going for $1.82 and the implied volatility was also 128%.
Now, this was the day before earnings. Now let’s talk of what happened the day after earnings.
So again, here Seagate was trading at $61.45 before earnings, but then the next day, Seagate dropped to $59.33. So it fell dramatically and therefore, and the price of the 61.50 call is only a penny.
So it’s not surprising that the call is not worth anything, but here’s the key. Even though the stock fell quite substantially, the put only went from $1.82 to $2.51 so it went up because puts go up as the stock goes down.
So this means that the put only went up to $0.70, $0.69 to be exact. You see this is how the volatility crash affects the option price, because even though the put is worth more now, and is now in the money, but it also lost a lot of value due to the decline in implied volatility.
See, the previous day, it was 128%, this implied volatility, and the day after only 96%. So you have to factor this in when trading options into earnings.
How Is Implied Volatility Measured?
So let’s talk about this implied volatility thing and how is this measured, right? You know me, I’m all about practical stuff, so I don’t want to bore you with the math behind it and I don’t have to.
The good news is that there are plenty of places online that calculate the implied volatility for you, and I want to show you exactly how you can see if the implied volatility, is high, low, or average. Here is the easiest way to do it.
You compare the implied volatility to the stock’s historical volatility for exactly the same time frame. The implied volatility measures the market expectation for future price action.
Now, the historical volatility measures the volatility for a stock that already occurred over a specific time frame. All you have to do to see if the implied volatility is high, low, or average compare it to the historical volatility.
We can use the implied volatility of AAPL Apple’s Q1 earnings season. Apple was trading at 142. For an at-the-money call, expiring in four days, the implied volatility was 71%, and for the put was 70%.
The historical volatility of Apple. And this is something that you’re charting software can show you, it makes sense to look at it in 10, 20, 30, 40 days increments. So if we were to look at the past 10 days, the historical volatility was 37%.
But the call was trading at 71%. So what does it tell us? It tells us that the premium on this call, and also on the put, was running more expensive than usual. So now we can see, how this is affected by earnings.
Now, let’s take a look at the implied volatility of an at-the-money Apple call from the same time that expired later out at, let’s say March 19th.
So for calls expiring March 19th, you see right now the implied volatility is much, much, much lower at 43% for the call, and 43% as well for the put.
The historical volatility over the past 60 days was 40.69%. Now compare this to the 43% and we see that it is pretty much in line here.
So this means that the premium that was on these calls and puts on options that had 53 days until expiration was pretty much average.
Why You Shouldn’t Sell Options Into Earnings
Options traders are always talking about implied volatility and historical volatility, and now you know what it is. Now I want to tell you why I don’t sell options into earnings.
I mean, even though the stock moves in the direction that you want to, your option premium is getting sucked out of there because of the volatility crash.
You see, and this where, as an option seller, you might say, “don’t I want the premium to be as high as possible?” and yes, of course, you do.
But let me make you very clear why I don’t sell options into earnings.
If you have been following me for a while, you know that I love trading the Wheel, and as part of this strategy, we are selling options.
Well you see, earnings plays are hit-and-miss. Sure, everybody can get lucky and most people who start trading expect their account to explode from one or two big trades.
This is where we have some stocks that are jumping just dramatically. Looking at Intel, INTC over the last three earnings.
Huge gap down right when we had earnings, then there was another earnings play, and Intel really crashed down hard again.
Then also here during the last earnings season, initially, Intel went up but then started crashing down.
You see, some people like these earnings plays because they believe the hype that they can make a lot of money with very little work involved, but see, trading just doesn’t work this way because, in reality, the key to becoming successful in trading is consistency and growing your account systematically.
That’s what I mean when I talk about generating SRC profits, right? SRC is an acronym that stands for Systematic because I like to trade what I see and not what I think.
This is why I use indicators and have a trading strategy that tells me when to trade, what to trade, when to enter and when to exit. The R stands for repeatable and by trading my plan, I’m able to find repeatable profit-making opportunities. The C in SRC profit stands for consistency.
You see, I’d rather make slightly less money more often than biting off all my nails waiting for a big winner. As you know, part of my systematic approach to trading is to use The Wheel Strategy and the PowerX strategy.
Now, especially with The Wheel strategy that, where I’m trading right now with you here, the idea is to get paid while you wait to buy the stock, and because I’m collecting premiums on the puts that I sell, I’m looking for stocks with higher volatility, right?
This means making more money, and as a rule of thumb, I look for stocks with an IV, implied volatility, of at least 40%. The Wheel strategy can relatively safely produce profits, but I don’t recommend you to trade into earnings, at least that’s not what I do.
So I will not target options with an expiration date that includes the company earnings report. I am trading options before we are running into earnings. So this is why I think it is very important that you know when trading options, whether it is buying or selling, that you don’t trade into earnings.
At least that’s what I do because earnings are a wildcard and there’s just too much uncertainty. Remember, I’m not looking for fireworks here, I’m looking to systematically grow my account through consistent and repeatable strategies.
Where To Check For Earnings
Now, I want to give you two more resources, if you want to see for yourself who is reporting and when.
These are two websites that are pretty cool that I personally use. So the first one here is “stock earnings.” If you go to stockearnings.com or they even have stocksearning.com, they will show you see the notable earnings that are coming up this week.
Now, another one that many people like to use is earningswhispers.com. So that’s another great source for finding out when companies will report earnings because this way you can make sure that you’re not trading right into earnings.
It’s always good to know when they report earnings if you have any open positions, whether you’re buying stocks or selling stocks so that you’re not caught off guard.
So I hope that this helped you to see how earnings impact option prices and why I never sell options into earnings.

Is Lowes Signaling An Overall Market Decline?Lowe's triggered my early-warning price reversal algorithm. The full accuracy when this occurs is detailed in the article at my website below. The RSI algorithm determines overbought and oversold levels. The algorithm signaled a SELL on April 6, 2021. Equities nearly always obey the signal and move down, but sometimes it may continue to move up first. This is interesting if the signal is accurate. We are heading into the summer months which would ultimately be profitable for the company. The stock could be in for another short-lived cool off which is most likely the case here. Most of my algorithms may point to a reversal but that reversal ends up reversing usually within 50 trading bars. While the current signal ultimately has the stock dropping, it could gain slightly first. Once the drop has occurred, there is no doubt Lowe's will be primed to retrace this drop.
I have placed two red boxes and two green boxes on the chart. The larger red box depicts all of the historical movement, from a percentage standpoint, that this stock has moved on the Daily chart after a SELL signal occurred. Therefore, this box represents 100% of previous movement upward before the stock finally moved downward. The smaller red box represents 50% of all historical movement upward, before the stock moved downward. The smaller box is more of a precise target for the potential top in this instance.
The green boxes represent the same thing. In this instance, the smaller green box would be my projected target for the final bottom.
The black dotted arrow represents median historical movement. Medians are a good metric, but they are just one of many I use when forecasting future movement.
As always, the stock could decline the very next bar after the signal without looking back (therefore the red boxes would not come into play) or the stock may never decline (and the green boxes may never come into play).
All statistics and the full analysis are available for free as always at the site below.

Air BnB follow the Yellow Fib Road Air BnB Printing a Fresh ATH Recently and now pulling back towards the .66 as per the chart ... Climbing up a Acending Channel Since its inception in December with healthy pullbacks along the way .
If this trend is to continue then we shall fall down to the 190 region before a move upwards to perhaps another ATH . Be aware of Earnings Numbers on the 25 Feb .
IN the meantime Thanks for stopping by and remember to have a plan in place before taking any trade . Like and follow is all i ask .. My Gratitude and thanks

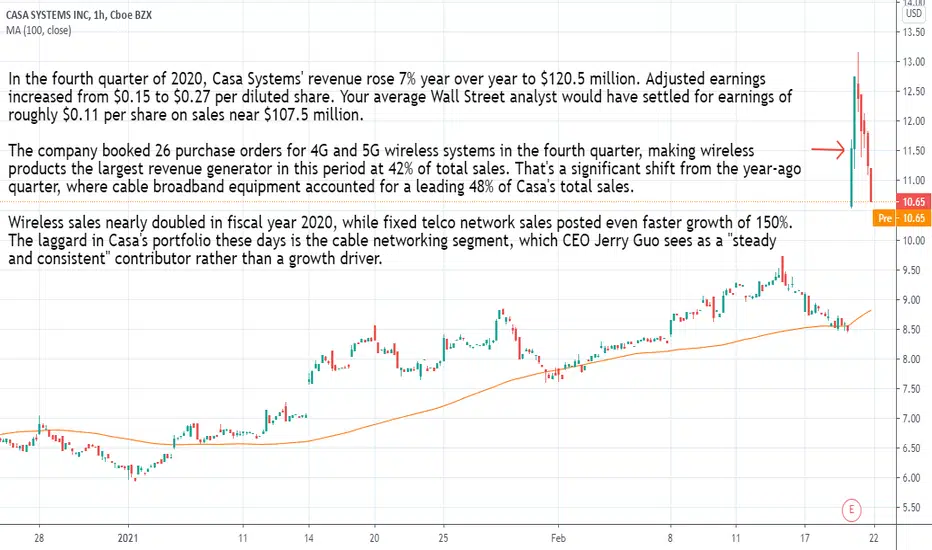
$CASA strongest Q4 with record wireless revenueIn the fourth quarter of 2020, Casa Systems' revenue rose 7% year over year to $120.5 million. Adjusted earnings increased from $0.15 to $0.27 per diluted share. Your average Wall Street analyst would have settled for earnings of roughly $0.11 per share on sales near $107.5 million.
The company booked 26 purchase orders for 4G and 5G wireless systems in the fourth quarter, making wireless products the largest revenue generator in this period at 42% of total sales. That's a significant shift from the year-ago quarter, where cable broadband equipment accounted for a leading 48% of Casa's total sales.
Wireless sales nearly doubled in fiscal year 2020, while fixed telco network sales posted even faster growth of 150%. The laggard in Casa's portfolio these days is the cable networking segment, which CEO Jerry Guo sees as a "steady and consistent" contributor rather than a growth driver.
www.fool.com
“We had one of our strongest quarters with record wireless revenue and a healthy backlog to support our top-line growth in 2021,”
finance.yahoo.com
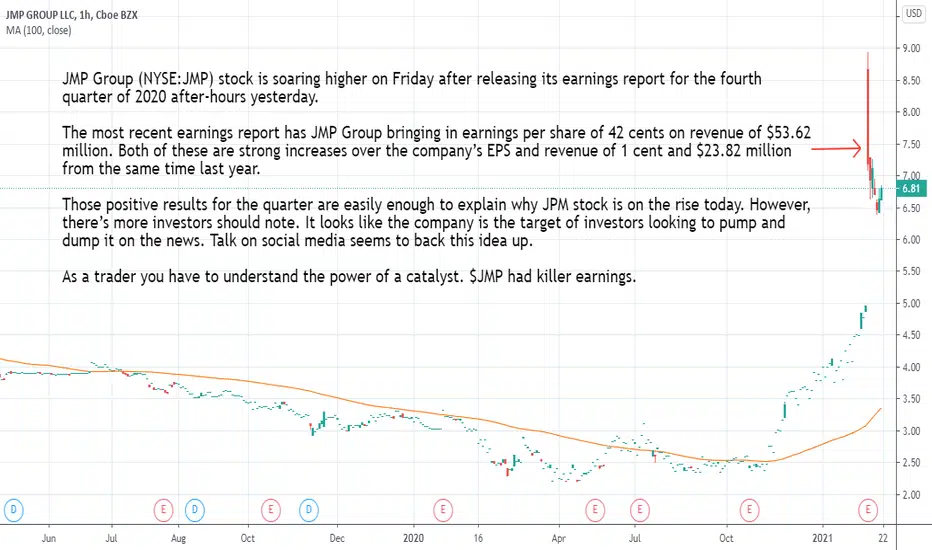
$JMP killer earnings $0.45 per shareJMP Group (NYSE:JMP) stock is soaring higher on Friday after releasing its earnings report for the fourth quarter of 2020 after-hours yesterday.
The most recent earnings report has JMP Group bringing in earnings $0.45 per share of on revenue of $53.62 million. Both of these are strong increases over the company’s EPS and revenue of 1 cent and $23.82 million from the same time last year.
Those positive results for the quarter are easily enough to explain why JPM stock is on the rise today. However, there’s more investors should note. It looks like the company is the target of investors looking to pump and dump it on the news. Talk on social media seems to back this idea up.
As a trader you have to understand the power of a catalyst. $JMP had killer earnings.
finance.yahoo.com
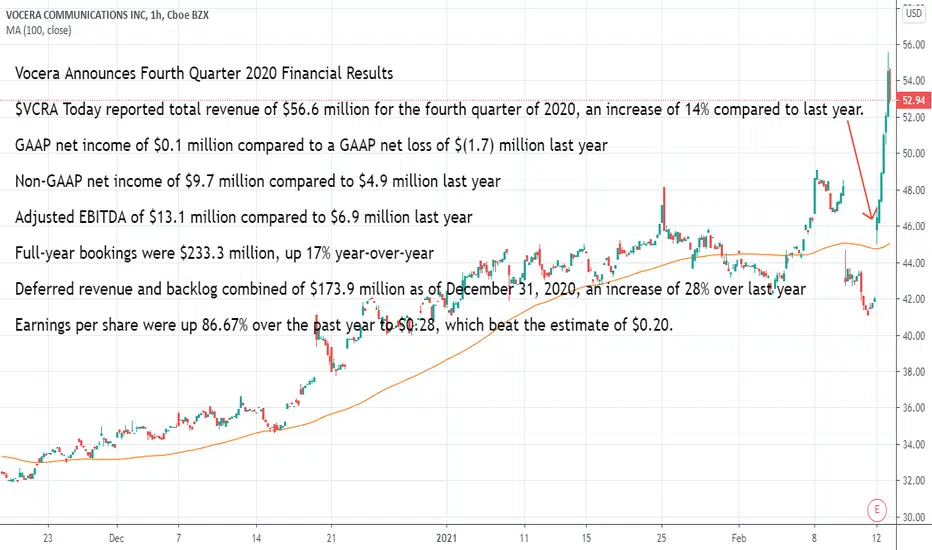
$VCRA provide outstanding Fourth Quarter 2020 Financial ResultsVocera Announces Fourth Quarter 2020 Financial Results
$VCRA Today reported total revenue of $56.6 million for the fourth quarter of 2020, an increase of 14% compared to last year.
GAAP net income of $0.1 million compared to a GAAP net loss of $(1.7) million last year
Non-GAAP net income of $9.7 million compared to $4.9 million last year
Adjusted EBITDA of $13.1 million compared to $6.9 million last year
Full-year bookings were $233.3 million, up 17% year-over-year
Deferred revenue and backlog combined of $173.9 million as of December 31, 2020, an increase of 28% over last year
Earnings per share were up 86.67% over the past year to $0.28, which beat the estimate of $0.20.
finance.yahoo.com
finance.yahoo.com
MA (MASTERCARD INCORPORATED) LONG SET UP (EARNINGS)TITLE/(DATE)- Buy LIMIT MA
ASSET- MA
PLATFORM- MT4
ORDER TYPE- Market first entry / Buy limit second
Time Frame- 1D
ENTRY PRICE 1- $314.50 (Market)
ENTRY 2- $307.50 (Pending)
STOP LOSS- $300.50 (140 PIPs)
TAKE PROFIT 1- $328.50 (140 PIPS)
TAKE PROFIT 2- $342.50 (280PIPS)
TAKE PROFIT 3- $356.50 (420 PIPS)
TAKE PROFIT 4- $370.50 (560 PIPS)
STATUS: ACTIVE
Aug-27-20 Initiated Mizuho Buy $400
Jul-21-20 Resumed Daiwa Securities Neutral $314
Jul-14-20 Initiated Goldman Buy $364

3 ways to play this earnings | Beyond Meat Technical Analysis3 in-depth scenarios taking you through how I plan on playing earnings with NASDAQ:BYND
Scenario 1: Mini Falling Wedge (Bullish)
If this is indeed a falling wedge, we should see it smack both support and resistance 3 times prior to its decision.
If this is the case, I'll be looking to grab a position later this week for a short-term trade.
Scenario 2: Massive Bullish Channel
This is why we need to be very patient with this trade. TA would tell you we should see another retest with even lower lows before breakout long-term. If we hold under I'll back up the truck and prepare to load up the puts.
Scenario 3: Beautiful Earnings Rip
In the case of a massive breakout, I will aim to grab a few calls with some time (expiring 2 weeks after earnings) with a strike around $120. If we get a solid correction I'd hope we can grab something like $115 strikes for the price of the $120 strikes at open.
Once again, if breakout is successful we will see price movement toward $120 before earnings most definitely. If we grab 3 or 4 $115 calls expiring may 22, we will probably be able to sell 2 for our original investment plus profit. This would allow us to hold the remaining contracts through earnings.
"Risk it for the biscuit" but secure your profits at the same time :)
Depending on the next 48 hours, I will choose one of these scenarios. We will ball out, this is Easy Loot.
DO NOT TRADE THIS! YOU WILL LOSE MONEY...
DOTCOMJACK

QCOM Breaks to New HighQCOM is running up ahead of earnings with a rebound off of a sell down during last earnings season. The recovery is a fast short-term V bottom.

ORBEX: Look at SPX Volumes for Further Clues!Despite the US-China phase one trade deal supporting equities the upside could be minimized if priced in already since as indices have been moving up since the December truce!
Geopolitics suggest more strength, however, technicals indicate otherwise! Will corporate earnings trigger a shift from a macro perspective? Well, either that or weaker US inflation data!
It seems that equities hang on earnings and inflation, whereas the US index only on inflation data.
Timestamps
SPX 8H 01:30
DXY 8H 04:25
Trade safe
Stavros Tousios
Head of Investment Research
Orbex
This analysis is provided as general market commentary and does not constitute investment advice

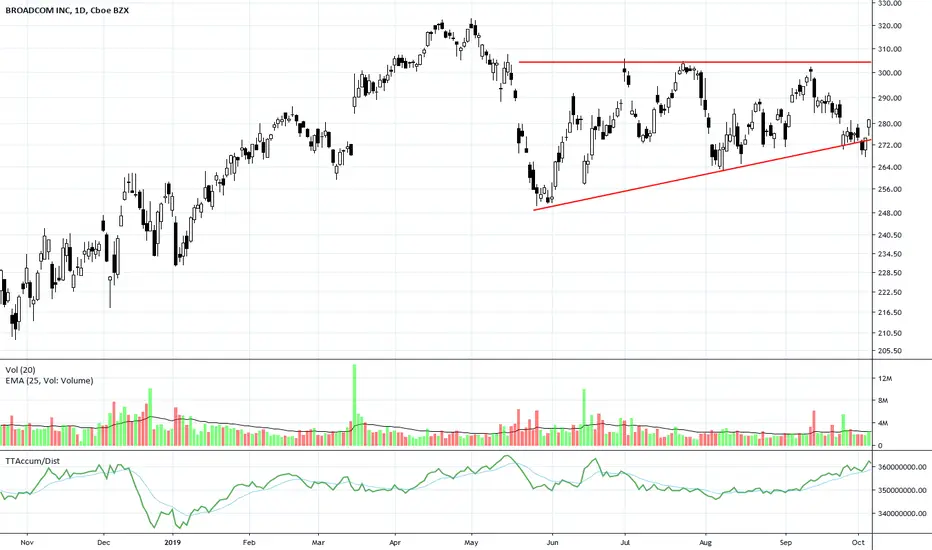
AVGO Forms an Asymmetrical Triangle Ahead of Earnings SeasonAVGO is slowly working to complete the Asymmetrical Triangle candlestick pattern that started in June.
KLAC Compression Pattern Ahead of Earnings SeasonKLAC has hit a new all-time high and is now in a tight compression, even as Dark Pool Quiet Rotation™ continues.

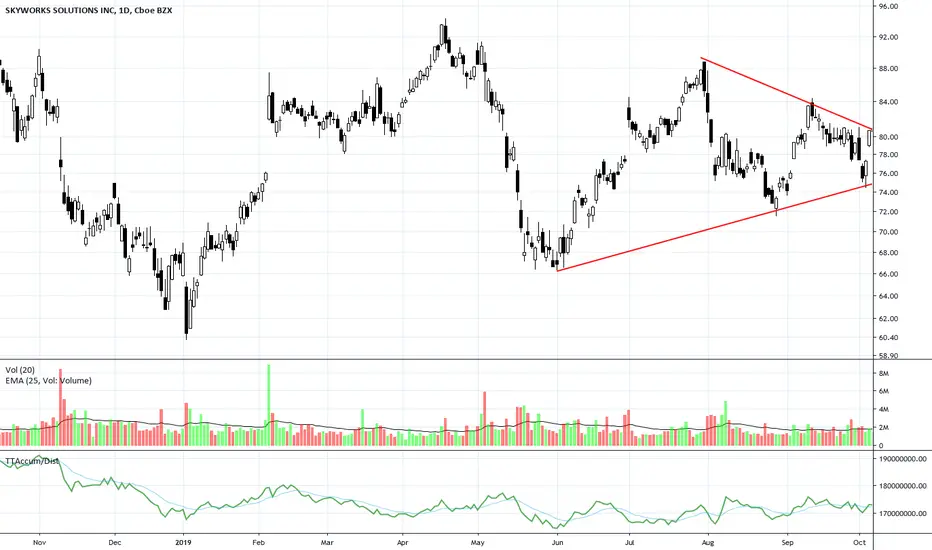
SWKS Developing Symmetrical TriangleSWKS shows an unusual Symmetrical Triangle formation ahead of Earnings Season. The triangle follows a failed attempt to break out above the previous all-time high.
AAPL Earnings Report Gap FailsAlthough Apple news claimed that the company “beat expectations,” the stock gapped up and quickly reversed, then moved down further. This is due to their Guidance for the next quarter. Many companies are able to beat the analysts’ estimates, but forecast lower for next earnings season.

$AAPL into EARNINGS #AAPLFirst of all $AAPL is at a mayor trendline so a miss could make us fall heavy.
If Apple has a miss in earnings, we could see a downtrend starting aiming at the 50ma weekly at $192 and 100ma weekly at $182. On the daily timeframe theirs also a lot of support around the $180-$190 zone.
If Apple has a beat in earnings. We could see $230, $260 and $270 as first take profits.
Will update this post what my feelings are going to be on the earnings from. $AAPL.

INTC Has Massive Gap to Run DownINTC not only had a poor earnings season, but it also faces challenges from recent new tariffs in China. Intel’s stock price has fallen back to the lows of December 2018. This should provide support for the stock due to fundamentals.

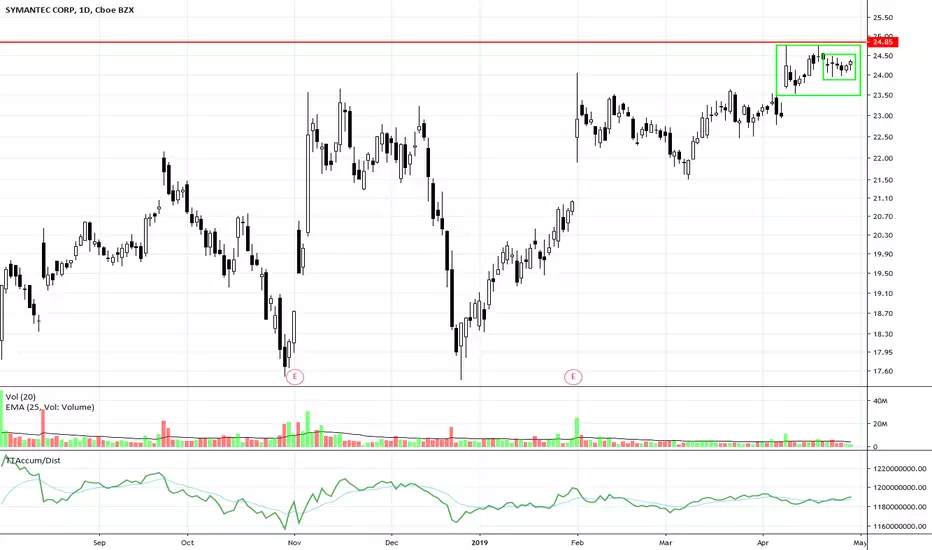
SYMC Compression Below ResistanceSymantec Corp. was sideways for most of this year. Recently, it gapped up during earnings season. A weak retracement may be a setup for a breakout attempt against long-term resistance. Red line shows that resistance level on this chart.