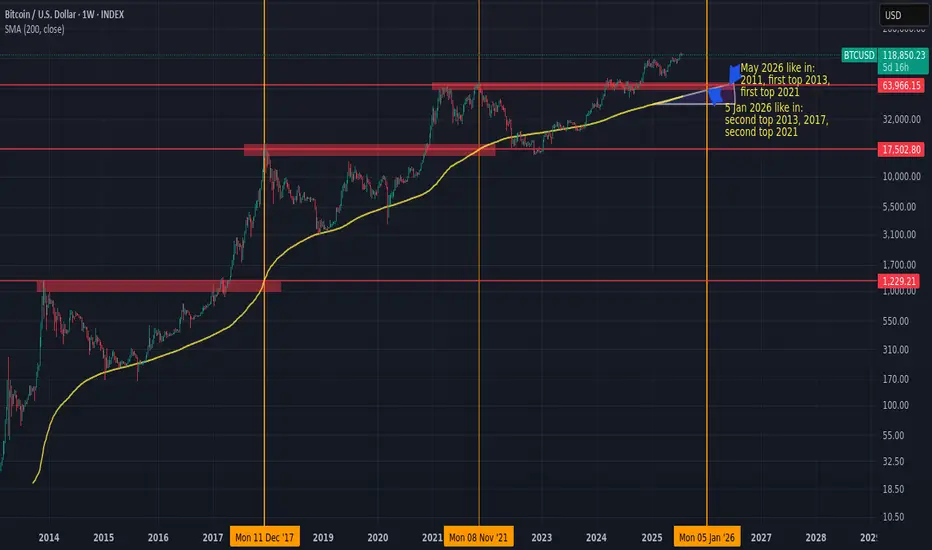
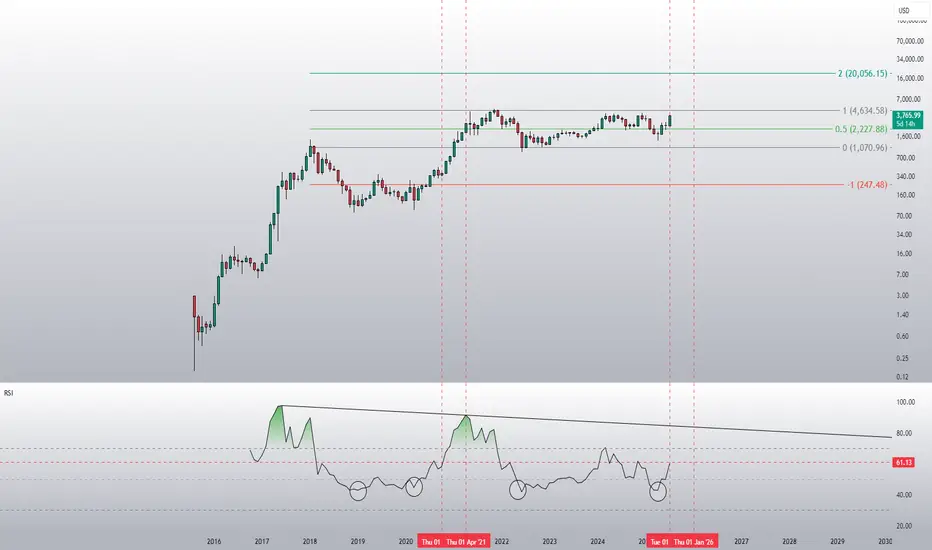
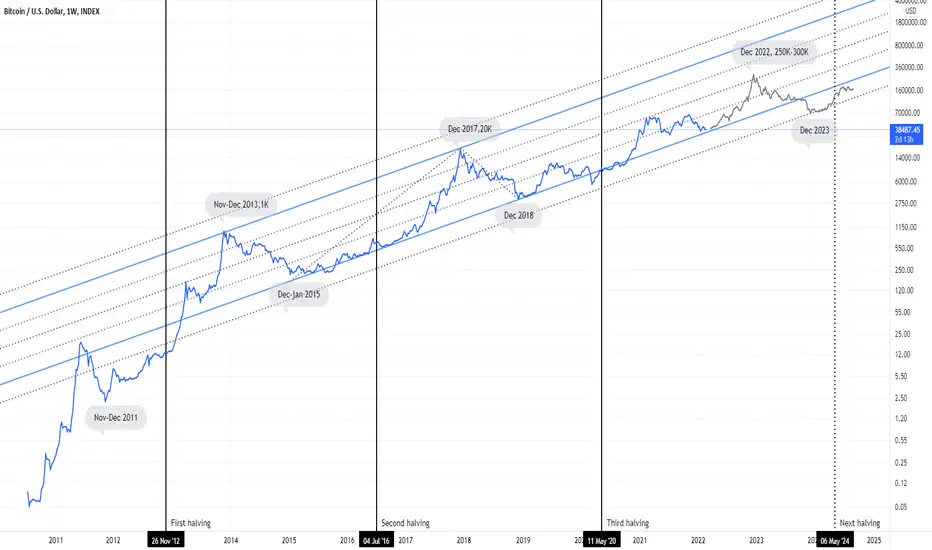
Next BTC topHistorically, BTC/USD has tended to peak when the 200-week simple moving average (200W SMA) approaches or crosses the high from the previous market cycle.
If this pattern holds, and assuming the 200W SMA continues rising at its current pace, the next top could occur sometime between January and May 2026.
If BTC accelerates earlier, the moving average would steepen, potentially shifting the timing forward.
Something worth watching to manage risk and position sizing accordingly.
Economic Cycles
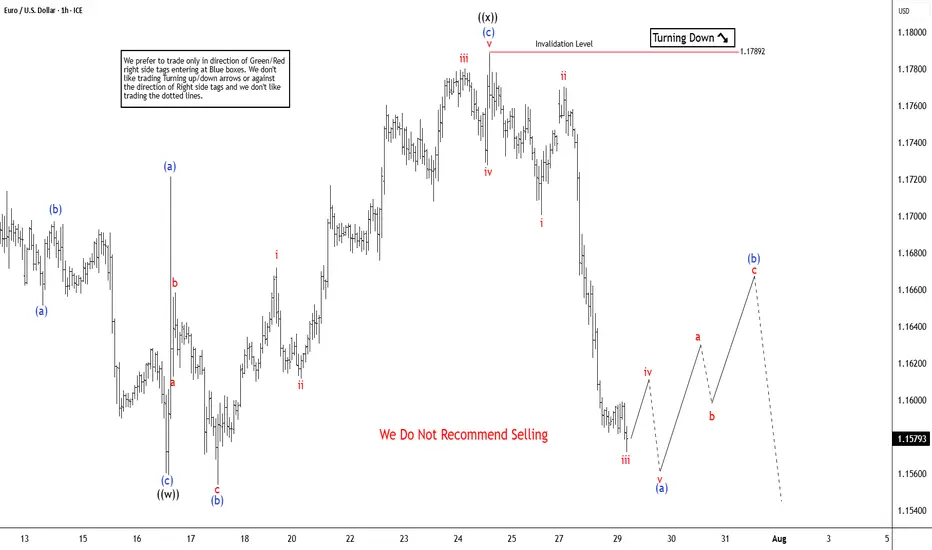
Elliott Wave Update: EURUSD Favors Weakness In To Support ZoneThe EURUSD favors upside in 3 swings from September-2022 low & should extend towards 1.1929 or higher against 1.13.2025 low. In 4-hour, it favors double correction lower from 7.01.2025 high to correct 5.12.2025 low. It favors short term pullback into 1.1512 – 1.1340 area in 7 swing pullbacks before continue rally in cycle from 1.13.2025 low. Above January-2025 low, it ended (1) at 1.0533 high, (2) at 1.0210 low, (3) at 1.1573 high, (4) at 1.1065 low & favors higher in (5). Within 4-hour, it placed 1 at 1.1830 high & correcting in 2 as double three correction before two more highs. It placed ((w)) at 1.1559 low in 3 swings zigzag correction. In ((w)), it ended (a) at 1.1659 low, (b) at 1.1714 high & (c) at 1.1559 low of 7.16.2025. Later, it unfolded expanded flat correction in ((x)) that ended at 1.1788 high of 7.24.2025. Within ((x)), it placed (a) at 1.1721 high, (b) at 1.1554 low & (c) in 5 swings at 1.1788 high.
Currently, it favors downside in ((y)) of 2 & expect sideways to lower in to support zone. It favors zigzag correction lower in ((y)) to finish 2 into extreme area before resume rally. Short term, it favors downside in (a) of ((y)) since 7.24.2025 high. In (a), it placed i at 1.1700 low, ii at 1.1771 high & favors downside in iii of (a) towards 1.1576 – 1.1569 area before bounce in iv. It expects a bounce soon in iv followed by one more push lower in v to finish (a) in 5 swings. Wave (a) of ((w)) should end near 1.1578 before bounce in (b) in 3 or 7 swings connector. The bounce in (b) should fail below 1.1788 high to extend lower in (c) into 1.1512 – 1.1340 area to finish correction. It should find next support into that area to rally higher as the part of daily sequence targeting 1.1929 or higher. We like to buy in to that area for next leg higher or at least 3 swings bounce. If it breaks above 7.01.2025 high, it expects two more highs to finish cycle from January-2025 before next pullback start.
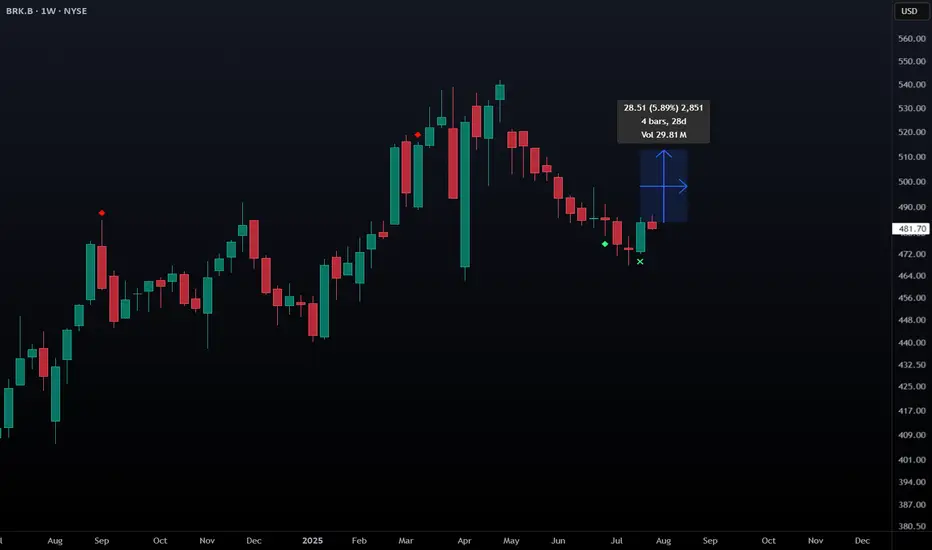
BRK.B - L2 Bullish Weekly Exhaustion SignalNYSE:BRK.B NYSE:BRK.A has triggered a level 2 bullish exhaustion signal on the weekly. This signal has triggered just 3 times in the stock's history with a 100% win rate and avg move of 5.89% over the following 5 candles.
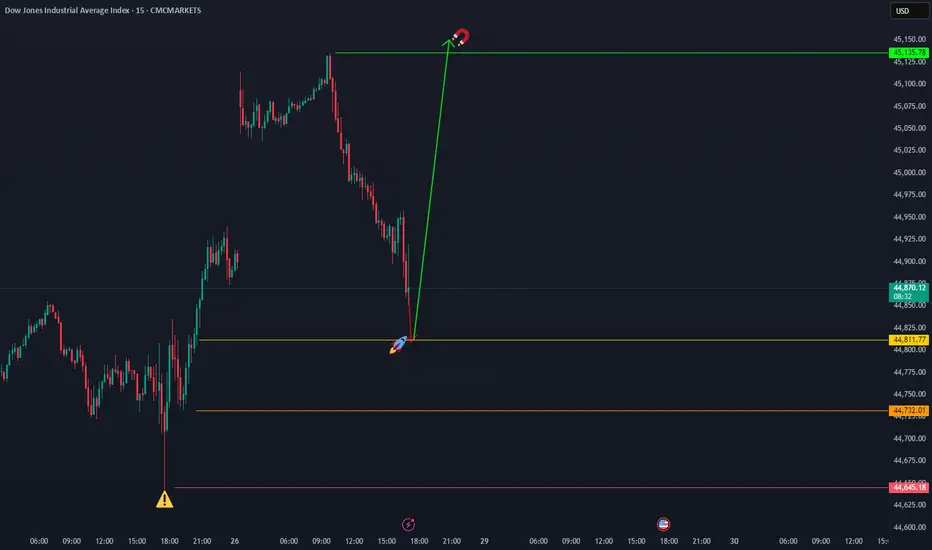
"We are going higher than 45,135.78The Dow Jones has the potential to start an upward move from the 44,811.77 and 44,732 levels, aiming for 45,135.78." CMCMARKETS:US30
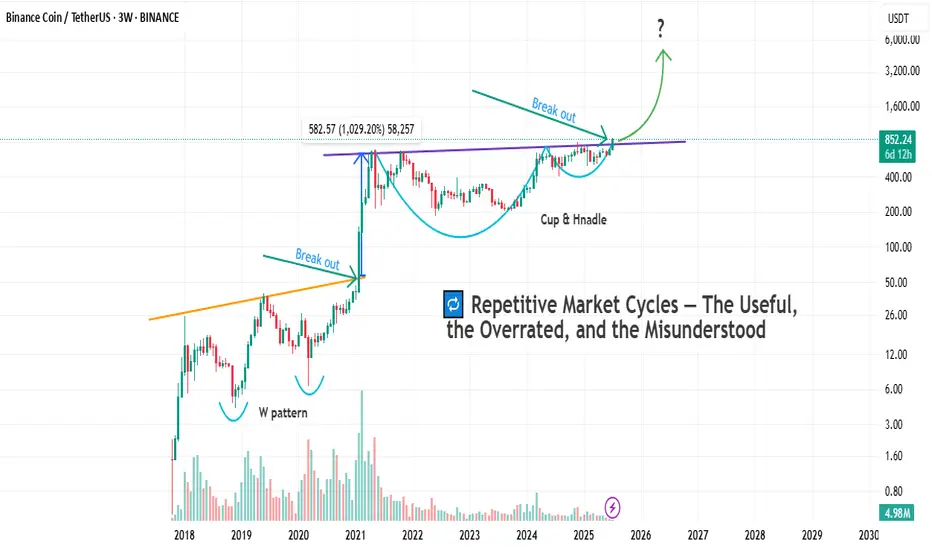
Cycles Don’t Lie — But Which One Speaks Here ?Markets love to repeat themselves.
But just because something repeats, doesn’t mean it’s predictable — or useful.
Let’s break down the main types of market cycles that traders talk about, and more importantly, let’s call out their flaws. No sugarcoating.
🔹 1. Time Cycles
These are based on the idea that price behaves in a similar way over specific time intervals — whether it’s 90 days, 4 years, or a custom Fibonacci count.
They show up in seasonal patterns, halving cycles (like Bitcoin), or through tools like Gann, Hurst, or even basic cycle lines.
The problem?
– The exact timing is rarely clean. A 120-day cycle might play out in 87 days next time.
– Flat, choppy markets will destroy any cycle-based setup.
– Different timeframes show different "cycles," so good luck aligning them.
– Most cycle tools are complicated and impractical for real-time decision making.
🔹 2. Psychological Cycles
The famous emotional rollercoaster: Hope → Euphoria → Fear → Panic → Capitulation → Depression → Optimism.
Every bull and bear market goes through these in some form — in theory.
The problem?
– It’s almost entirely subjective. Everyone sees a different phase.
– You usually recognize the cycle only after it’s over.
– Emotions aren’t equal across all assets — BTC retail emotions ≠ S&P500 institutional sentiment.
– There’s no precise tool to measure this. You’re mixing vibes with candles.
🔹 3. Structural Cycles (e.g. Wyckoff)
This one’s more about price behavior itself — accumulation, markup, distribution, markdown. The idea is that markets rotate through these four structural phases again and again.
The problem?
– Identifying where you are in the structure is hard in real time.
– Markets don’t always follow the Wyckoff textbook. Sometimes they just... go.
– It relies heavily on volume — and that doesn’t always align.
– Traders love to force a structure where there isn’t one. Confirmation bias, anyone?
🔹 4. Macro Cycles
Classic economic boom and bust: Expansion → Peak → Recession → Trough.
These cycles move slow but shape everything — interest rates, employment, growth, and eventually, risk assets.
The problem?
– They’re way too slow to help short-term traders.
– Good luck timing the top or bottom of the economy.
– Governments and central banks constantly interfere with natural cycles.
– Most macro data is lagging, so you’re reacting to history, not forecasting the future.
🔹 5. Liquidity / Volume Cycles
This idea tracks capital flow: when liquidity comes in, prices rise. When it dries up, risk assets fall. Simple, right?
The problem?
– Volume isn’t universal. Crypto volume =/= stock volume =/= forex volume.
– You can’t always track capital flow accurately, especially in OTC markets.
– Low volume doesn’t always mean weakness — sometimes it’s just summer.
– Volume data can be misleading, especially on shady exchanges.
🔹 6. Fractal Cycles
Markets repeat — at every level. 5-minute looks like the 4-hour, which looks like the daily. Elliott wave, harmonic patterns, whatever — the idea is that patterns echo across timeframes.
The problem?
– Pattern recognition can be wildly subjective.
– The market doesn’t always care about geometry. Sometimes it’s just noise.
– By the time a pattern is “confirmed,” you missed the move.
– Focusing too much on pattern symmetry makes you blind to macro/fundamentals.
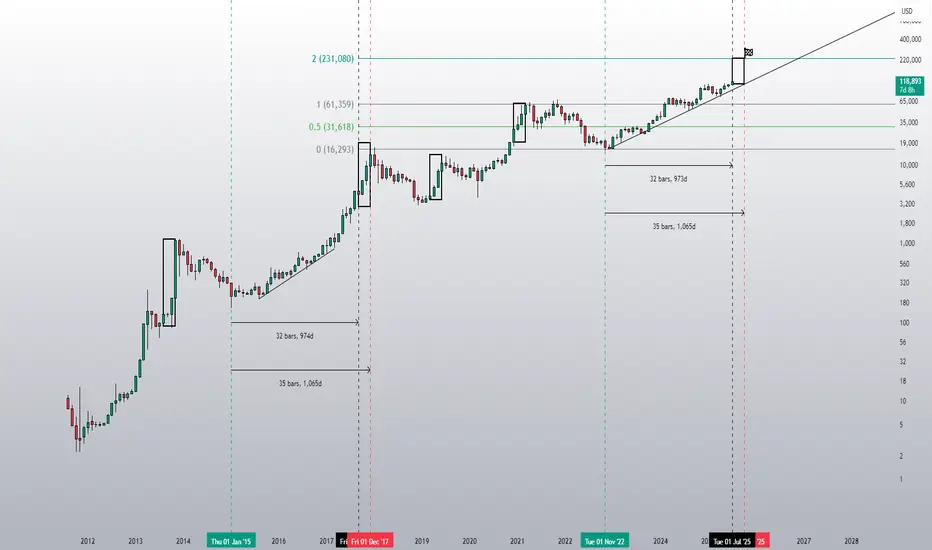
So after breaking all that down, let’s finally get to the chart in front of us.
Let’s take a closer look and see which cycle has actually played out here — and more importantly, which one actually helped :
As you can see on the chart, before every breakout above the previous all-time high, the market tends to form some sort of bottoming structure or reversal pattern.
And once that structure completes, the actual breakout usually leads to a solid price pump.
But here’s the key question:
Which one of the cycles we talked about earlier does this actually follow?
If you ask me, a professional trader will always try to use every tool available — not because any single one gives you the answer, but because combining them gets you closer to what's likely to happen.
And that’s what separates a well-rounded trader from a one-dimensional one.
Why do I say “one-dimensional”?
Because if you insist on looking at the market through a single lens, you’re bound to make bad decisions. We’re not here to prove our personal theories — we’re here to profit from what actually happens in the market, not what we think should happen.
In the chart above, we actually see a mix of all the cycles we talked about.
But I’d love to hear from you as well — let’s brainstorm together.
What do you see here as a trader?
And what’s your take on this setup?
Bottom Line
Yes, markets repeat.
But repetition doesn’t equal reliability.
Every cycle has its use — and its blind spot.
Know the difference. Use what fits your style.
And don’t romanticize a model just because it looks clean on a chart from six months ago.
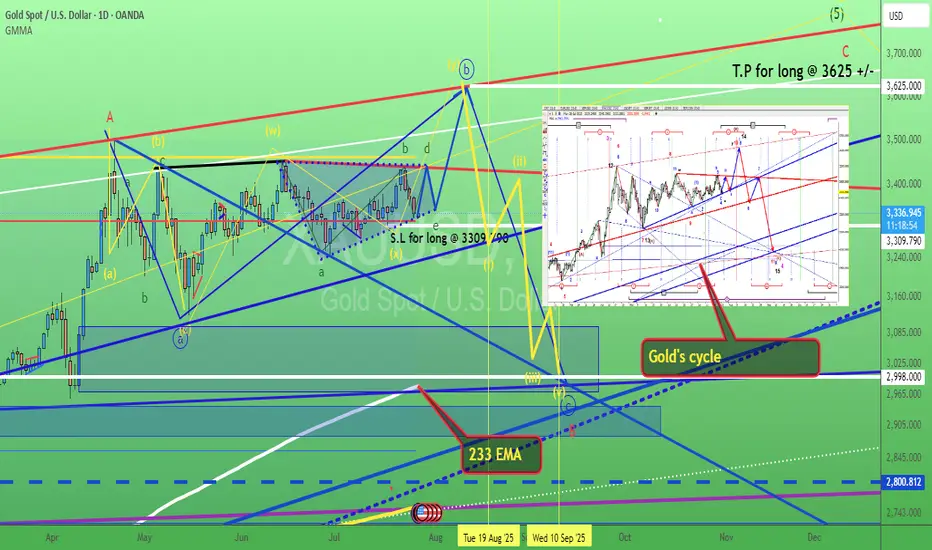
Gold. Bull Trap "triangle". 28/July/25XAUUSD, by checking gold latest speed of chart with its cycle. we might have a bull 'trap" triangle. A base for rallying to ATH again before a very deep pullback toward 233 Daily EMA which have not been "touched" for long time...
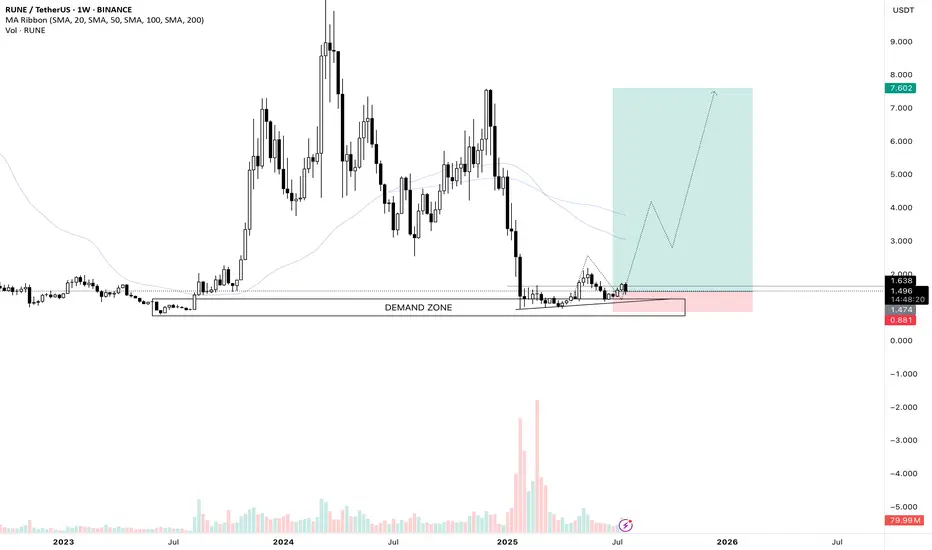
RUNE/USDT Weekly swing set upI love this chart and I entered a long trade on futures. After a sharp decline of the price we are retesting a huge weekly demand zone, we saw the volume really spike up on this area. If Ethereum continues its run which I believe so, I think Rune could really perform well. It is a swing trade so I am going to keep this position open for a few months and see how it develops.
Like and share guys and leave your thoughts on the comment section!
See you on the next one.
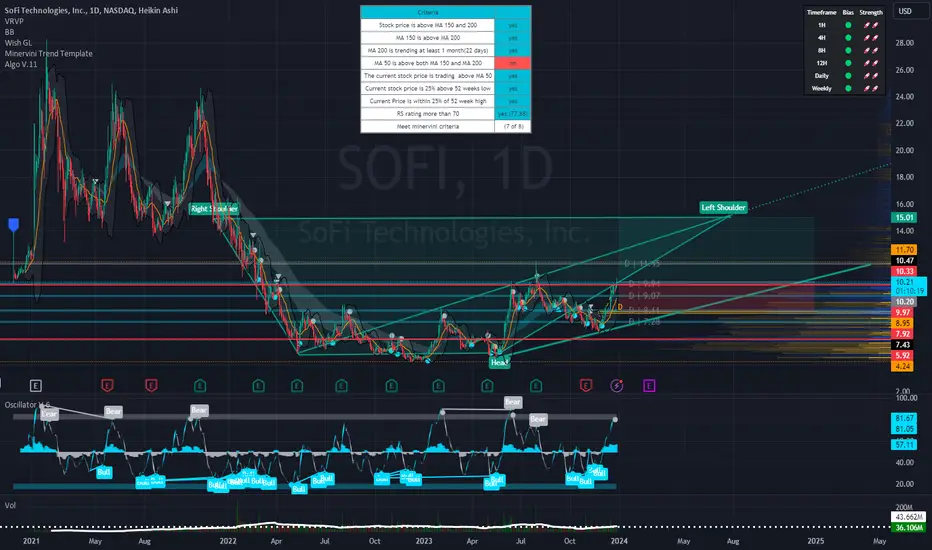
SoFi's Surge: Unveiling 2023 and What Lies Ahead in 2024Technical Analysis Overview
Current Price : $10.34, a 3.77% increase.
Weekly Trend : Showing a positive trend with a 5.35% increase over the last five days.
1-Month Trend : A significant increase of 51.96%, indicating strong bullish sentiment.
6-Month and Yearly Trends : A 17.04% increase over the last six months and a 124.51% increase year to date, highlighting a robust bullish trend.
Advanced Technical Indicators
Relative Strength Index (RSI) : 70.41 - Indicating that SOFI is nearing overbought territory, which could lead to a potential reversal or consolidation in the short term.
Moving Average Convergence Divergence (MACD) : 0.63 - Suggesting bullish momentum, indicating a strong buying trend.
Other Indicators : STOCH (83.28), STOCHRSI (84.02), ADX (37.09), Williams %R (-8.57), CCI (104.63), ATR (0.46), Ultimate Oscillator (54.76), and ROC (24.66) all contribute to a picture of current bullish momentum but with potential for short-term volatility or pullback.
Market Sentiment and External Factors
Market Capitalization : $9.904B USD.
Trading Volume Analysis : A high trading volume of 35,199,288, suggesting active market participation and interest in the stock.
Recent News Coverage Impacting SOFI
Bullish Outlook for 2024 : Analysts predict SOFI stock could continue its rally in the new year, benefiting from expected interest-rate cuts. A notable analyst has set a high price target of $14 for SOFI stock, implying significant upside potential ( InvestorPlace ).
Focus on Non-Lending Businesses : Analysts appreciate SoFi's shift towards non-lending businesses, improving earnings quality despite a higher-for-longer interest-rate policy.
Central Bank Policy Changes : Potential interest rate cuts in 2024 could benefit SoFi's lending business, as lower rates tend to spur borrowing and lending activity.
Conclusion
SOFI's stock shows strong bullish signs in the medium to long term, but the current overbought condition warrants caution for short-term traders.
The recent news and analyst predictions provide a positive outlook for 2024, making SOFI an interesting stock for both traders and long-term investors.
ETH is about to go parabolicDid people realise that Ethereum hit its historical lows on the monthly RSI in April this year? Some people are laughing at the idea of a target of 20k this year, but that would only represent a 20x increase from 2022 to 2025. In contrast, Ethereum achieved a 60x increase from 2018 to 2021.
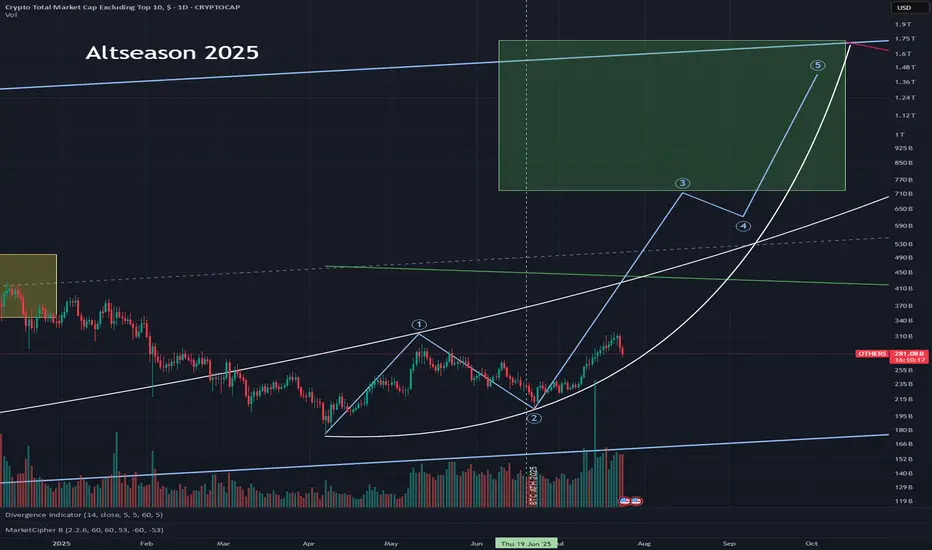
Altseason 2025 – EthseasonWe’ve officially entered #ETH season. Some liquidity is flowing into alts, but CRYPTOCAP:ETH has now taken the lead from CRYPTOCAP:BTC as the big dog.
Old retail is here and slowly buying this dip... but the new retail is nowhere to be seen, yet! Still positioning for that full-blown altseason:
🥑 POLONIEX:GUACUSDT 🧱 MEXC:YBRUSDT ⛏️ MEXC:KLSUSDT
🌐 HTX:SYNTUSDT 🧪 MEXC:DEAIUSDT ✳️ MEXC:SAIUSDT
🔗 POLONIEX:LLUSDT 🎮 KUCOIN:MYRIAUSDT 🤖 COINEX:ENQAIUSDT
#crypto #altseason2025 #altseason #ethseason
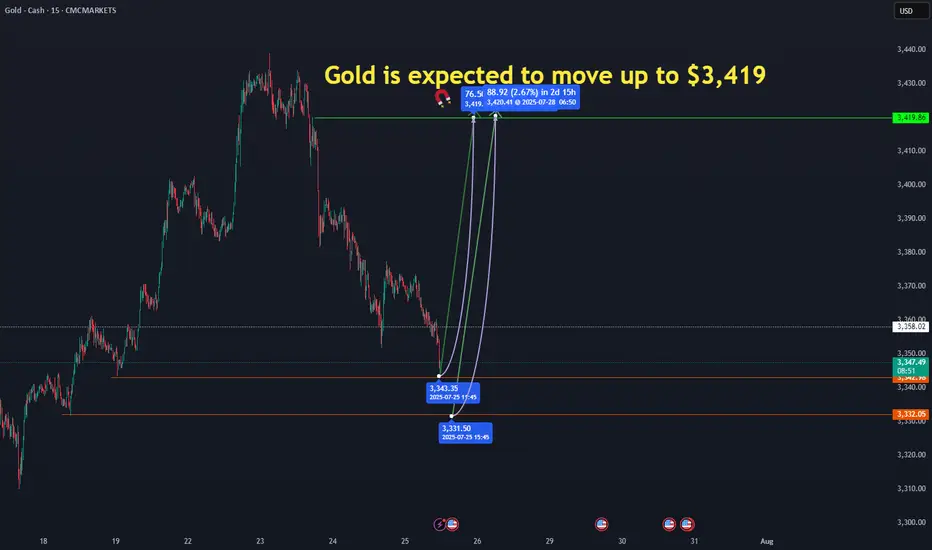
GOLD move up to 3419$Gold has the potential to start an upward move from the 3,343 and 3,331 levels. Reaching 3,419.86 is certain." CMCMARKETS:GOLD
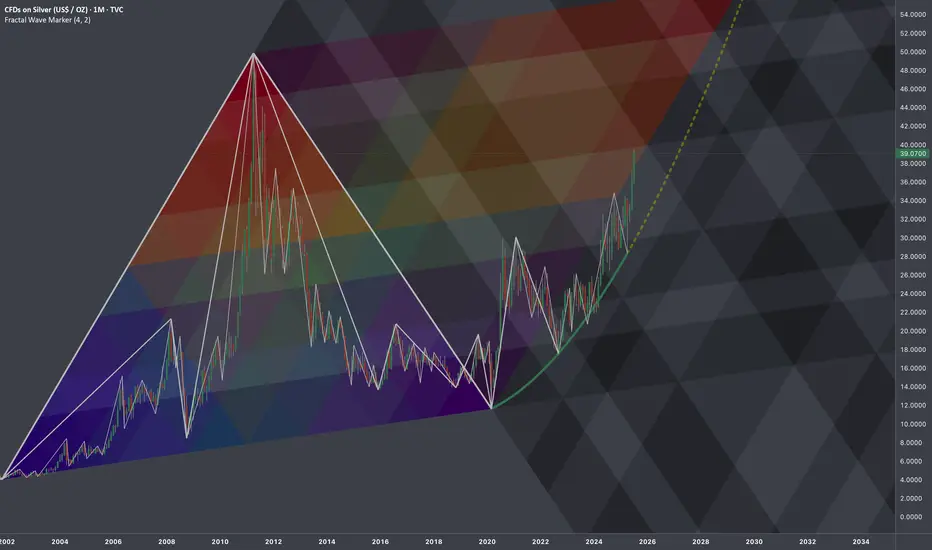
$SILVER: Fractal Geometry (Cycle 2001-2020)Research Notes
Working out probabilistic texture using multiple fibonacci channels on just 3 coordinates of fractal cycle (late 2001 - 2020) on linear scale (on log chart it would still be relevant, so you can switch to view with right click on price scale for selection).
To describe behavior of price and key levels on smaller scale starting from covid we'll use
L-H-L:
Using coordinates to express surface area of broken cycle with fibs mimicking rise, fall and side mapping cycle:
I'd look for patterns of bullish exhaustion only after price crosses the curve.
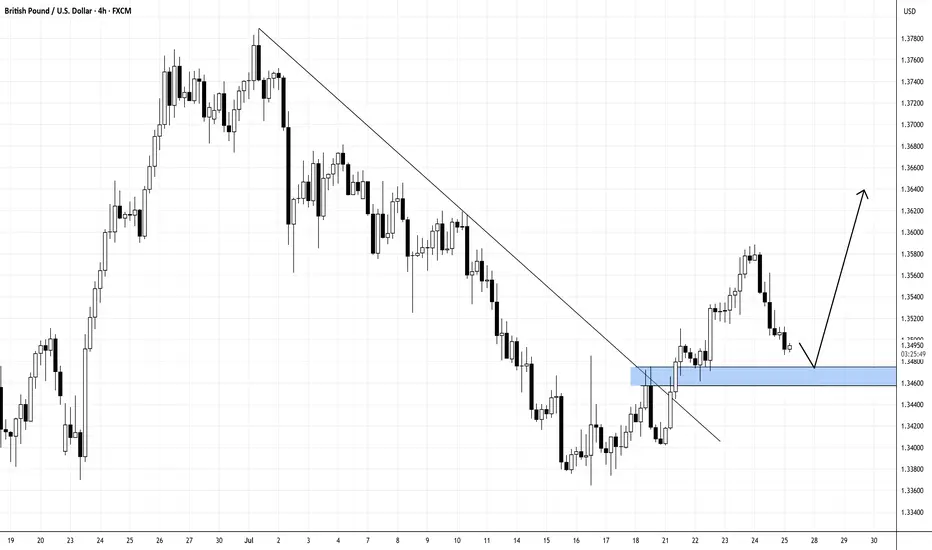
After Breaking Downward Trend, GBPUSD Ready for Upward Rally!GBPUSD
N.B!
- GBPUSD price might not follow the drawn lines . Actual price movements may likely differ from the forecast.
- Let emotions and sentiments work for you
- ALWAYS Use Proper Risk Management In Your Trades
#audusd
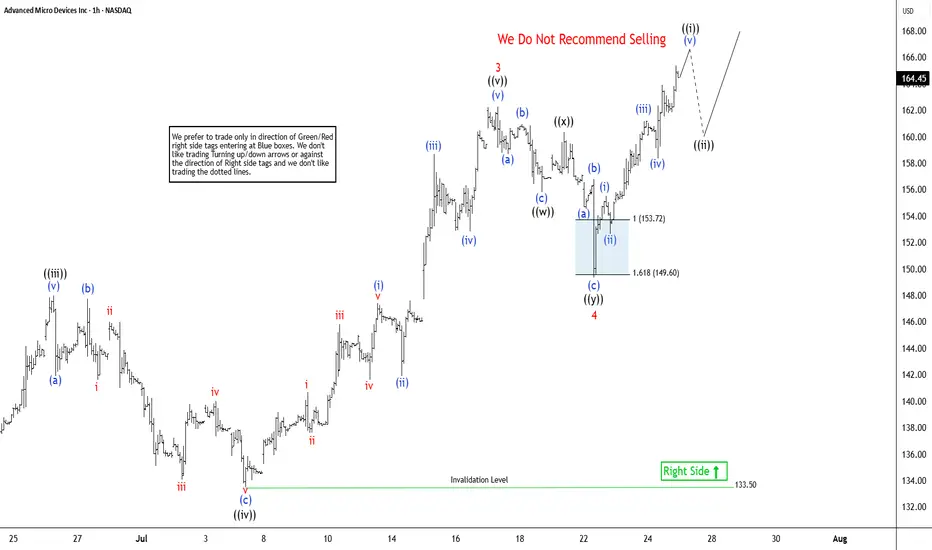
Elliott Wave Outlook: AMD Expects Pullback Soon Before RallyThe Advanced Micro Devices Inc., (AMD) favors rally in impulse Elliott Wave sequence from 4.09.2025 low & expect upside in to 168.36 – 190.36 to finish it. Impulse sequence unfolds in 5, 9, 13, 17…., swings & ends with momentum divergence. In daily, it ended pullback in 3 swings at 75.22 low in blue box area from March-2024 high. It is trading higher in nest & expect 13 swings to finish the impulse ((1)) before correcting next. Currently, it favors rally in 7th swing in daily & expect end soon in to 165.63 – 179.16 area before correcting in (4) as 8th swing. In 4-hour, it ended (1) of ((1)) at 97.91 high, (2) at 83.75 low in 4.21.2025 & favors rally in (3) as extended wave. Within (3), it placed 1 at 122.52 high, 2 at 107.09 low, 3 at 162.36 high, 4 at 149.34 low of 7.22.2025 & favors rally in 5. It is showing higher high since April-2025 low.
Below 3 high of 162.36, it ended 4 pullback in double three correction at 149.34 low. It ended ((w)) at 155.81 low, ((x)) at 160.34 high & ((y)) at 149.34 low. Above 4 low, it favors rally in ((i)) of 5 in to 165.44 – 170.43 before correcting next. Within ((i)), it ended (i) at 155.53 high, (ii) at 152.66 low, (iii) at 161.20 high, (iv) at 158.36 low & favor higher in (v). It appears three swings in (v) & expect pullback before final push above 161.52 low before correcting in ((ii)). Alternatively, the current cycle from 4 low can be 5 of (3) before it corrects in (4). In either the case, the next pullback should remain supported. In 4-hour, it is trading in 11th swing & expect pullback in 12th swings later before final rally. We like to buy the pullback in 3, 7 or 11 swings at extreme area for the upside in ((1)).
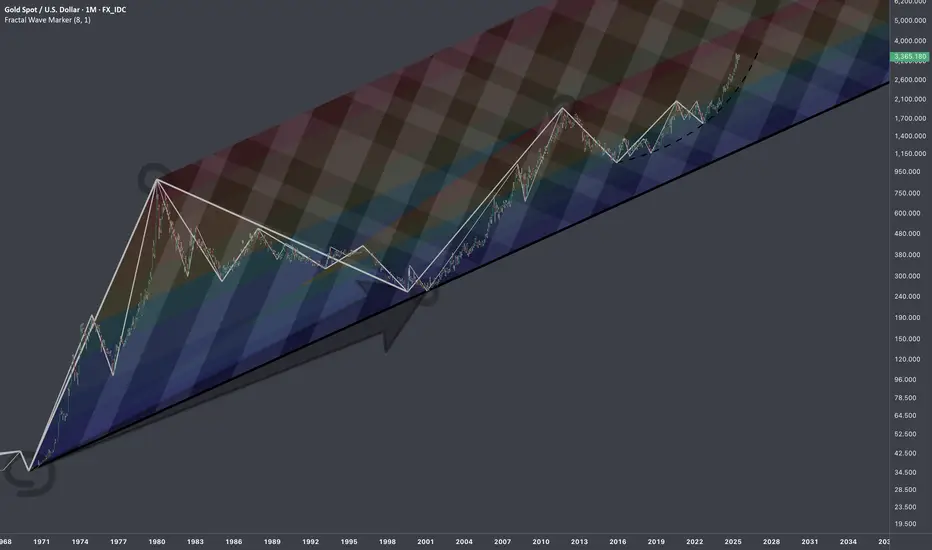
$XAUUSD: Macro InterconnectionsResearch Notes
Linking historic surface area and coordinates of consistent geometric expressions to document and learn more about the "texture" of self-organizing processes. The topology assumes that current price is a result of all history together that took to make the price end up where it is.
The fastest shortcut to figure out fractal hierarchy of waves and general direction is through Fractal wave marker .
Since angle of highs cycle is broken and price stayed above it for long time. That means it would be better to strip the chart starting from the lower levels, in order to get better coordinates for structural basis.
FWM helps to spot that distinctive part of broken waves that enables visual orientation in the rhythm. They manifest in its closest formative across cycles.
The angle that links the pattern through the time can have deterministic property, therefore we can use that direction for fibonacci channels to fill the gaps.
The fact that on log scale the bits from bullish phase of cycles contracted on price scale, I'd orientate with thin fibonacci channels (that is based on angle of lows of macro-cycle applied to previous ATH.
There are some other interconnection that are being tested.
BTC 24.07.2025I just had this idea on BTC of a PO3 creation on friday, consolidation over the weekend followed by a sell off into the range demand. I will only be interested in trading something outside of this range, so if BTC decides to do the exact opposite it's also fine, but fridays are perfect for manipulation events like this.(Something like i have drawn here would match with my cycle count, but is no confirmation for anything)

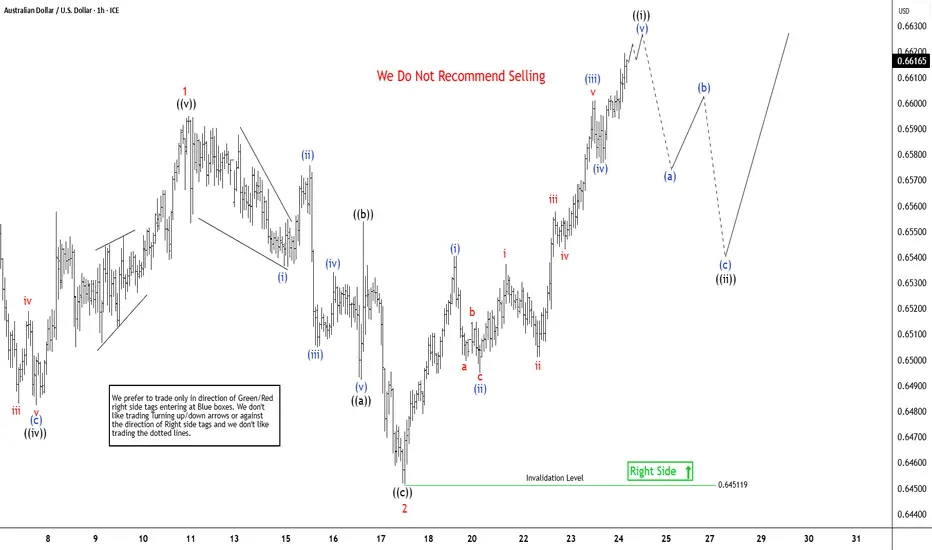
AUDUSD Elliott Wave Outlook: Impulse Pattern Approaching To EndThe AUDUSD pair is showing higher high from 4.09.2025 low, expecting rally to continue from 5.12.2025 low. It favors zigzag corrective bounce from April-2025 low & should continue rally against 0.6451 low. In daily, it started corrective bounce from 4.09.2025 low & may extend towards 0.6720 – 0.6955 area in next few weeks. Above 4.09.2025 low, it ended (A) at 0.6515 high of 5.06.2025, (B) at 0.6354 low of 5.12.2025 & favors upside in (C). Ideally, (C) can extend towards 0.6955 or higher levels, while pullback holds above 5.12.2025 low. Within (C), it placed 1 at 0.6595 high, 2 at 0.6451 low in corrective pullback & favors upside in 3. Within 1, it ended ((i)) at 0.6552 high, ((ii)) at 0.6369 low, ((iii)) at 0.6590 high, ((iv)) at 0.6451 low & ((v)) at 0.6595 high in overlapping diagonal. Below 1 high, it ended 2 in zigzag correction at extreme area before resume rally in 3.
It placed ((a)) of 2 at 0.6492 low in 5 swings, ((b)) at 0.6554 high & ((c)) at 0.6451 low in 5 swings. Wave 2 pullback ended at 0.618 Fibonacci retracement of 1. Within 3, it favors impulse in ((i)) started from 7.17.2025 low. It placed (i) of ((i)) at 0.6540 high, (ii) at 0.6495 low, (iii) at 0.6601 high, (iv) at 0.6576 low & favor upside in (v) targeting in to 0.6606 – 0.6637 area to finish it. It already reached minimum area, but can see more upside above 0.6593 low. Alternatively, the current move even can be (iii) of ((i)) followed by small pullback in (iv) & higher in (v). Later, it expects ((ii)) to correct in 3, 7 or 11 swings against 7.17.2025 low & find support from extreme area to continue rally. Wave 3 should extend in to 0.6692 – 0.6841 area in 5 swings before correcting in 4 of (C). We like to buy the pullback in 3, 7 or 11 swings at extreme area against 7.17.2025 low.
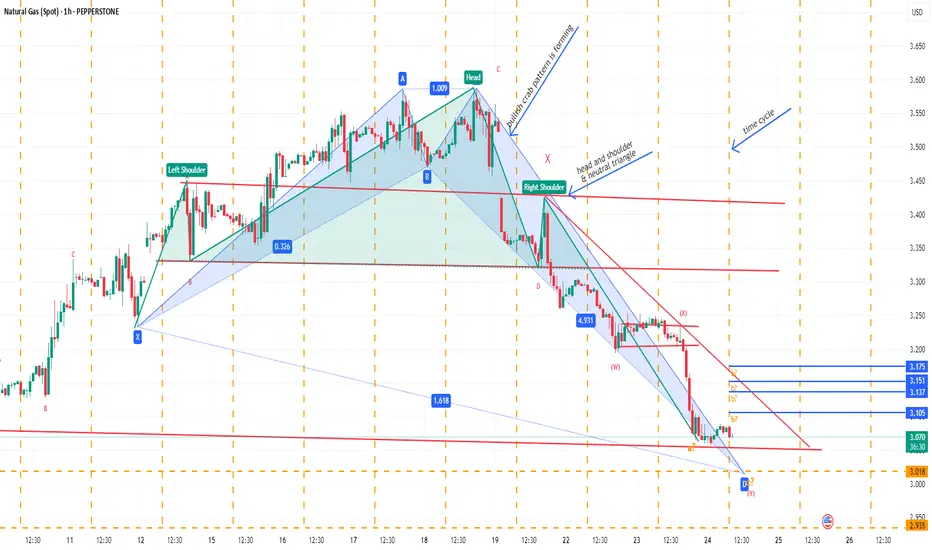
NATURAL GAS SPOTBullish crab pattern may form, if another harmonic pattern may develop later.
Neo wave wise may be in wave Z need confirmation.
Time cycle high low break may be trend continue in break out/down direction.
Not sebi research analyst.
$SOLUSD: Scaling LawsResearch Notes
Progressions here are evident so I'll use the historic bits and organize them into structure that would determine the levels inside dark highlighted zone of the local scope.
If we scale back, it's hard to avoid the massive drop that structurally can serve as reference point.

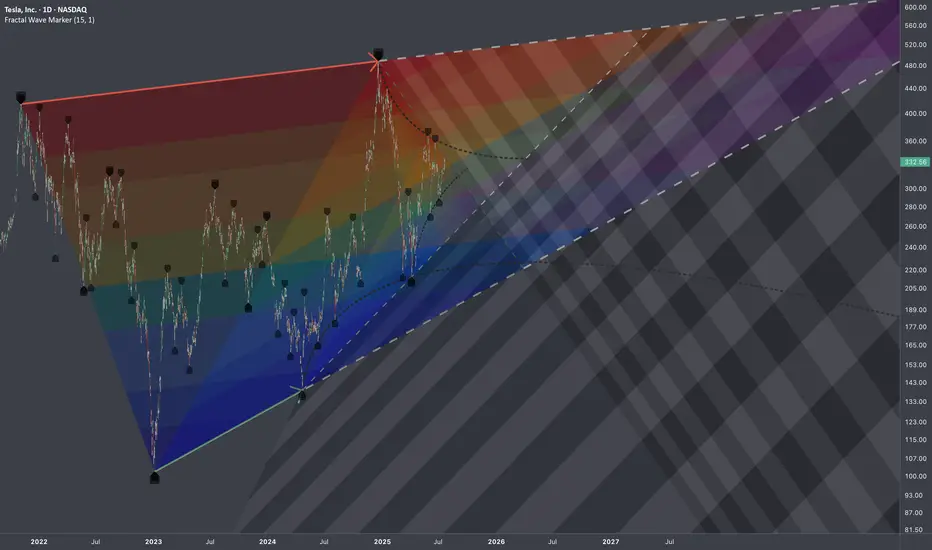
$TSLA: Multi-Scale DensityResearch Notes
Identified structural compressions happening within two periods:
This set has provided a perfect opportunity to study exponential fibs with growth rate starting from phi^1/4 applied to area of expression of squeeze.
Geometrically, gives a better sense of a continuity than regular fibs.
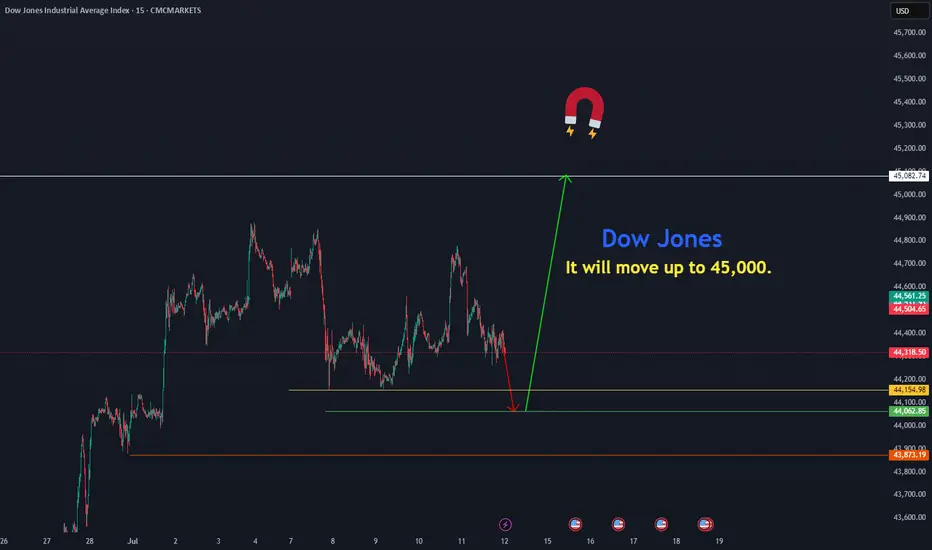
Dow Jones move upThe Dow Jones is resuming its rally toward 45,082 from the price zones of 44,154.97 and 44,000.
CMCMARKETS:US30