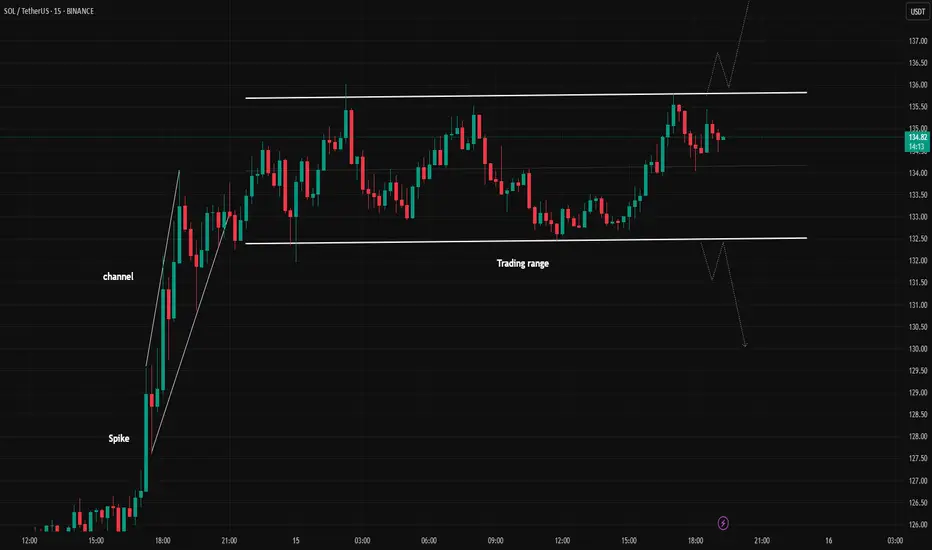
SOLUSDT Upward or downward?Hello,
In the 5-minute timeframe, you can sell at the top of the trading range and buy at the bottom of the trading range (by observing reversal candles and patterns).
Alternatively, you can wait for a breakout and enter in the direction of the breakout.
Be mindful of fake breakouts.
May your trades be profitable!
Economic Cycles
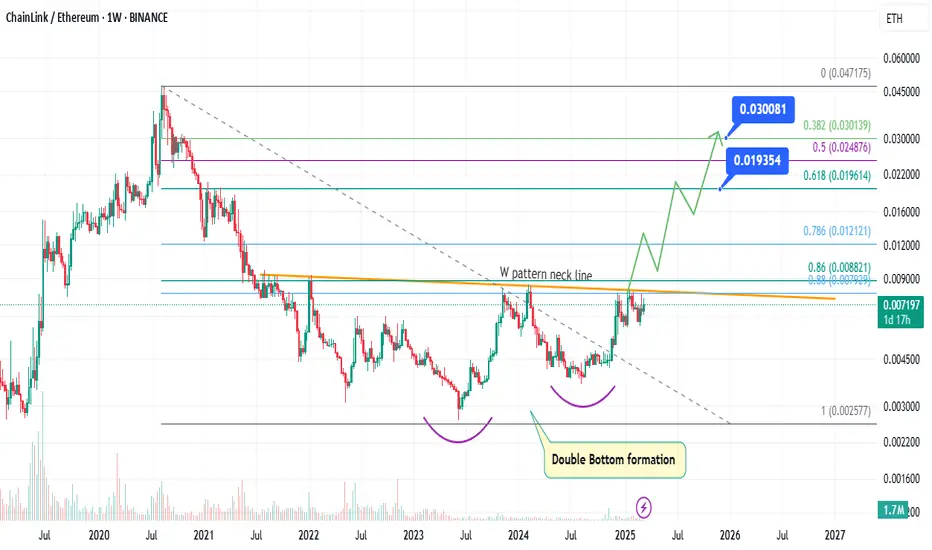
LINK is set to outperform ETH in this cycle ! 🔥 Hello Traders 🐺
In this idea, I want to talk about LINK/ETH and why we should pay attention to it 👇
As you might know, there are two indicators that usually signal the beginning of Altcoin Season:
1️⃣ BTC.D (Bitcoin Dominance)
2️⃣ ETH/BTC chart
These two factors help us identify when exactly ETH is going to outperform BTC and where the possible price targets are. I've already discussed them in my recent ideas — you can check them out on my profile or in the related ideas section. So make sure to follow me to stay tuned! ✅
⚡️ Why should we pay attention to LINK/ETH right now?
During Altcoin Season, other altcoins start to move alongside ETH, but how they react to ETH’s movements depends heavily on their chart performance against ETH. If an altcoin shows strength against ETH, we can easily see:
🚀 10% pump in ETH price
🚀 25% pump in that specific altcoin
📉 Let’s dive into the LINK/ETH chart:
As you can see, the price has already formed a W pattern and we've tested the neckline multiple times. And you know the rule:
👉 The more we test a support or resistance, the weaker it becomes!
🎯 Now the big question: What is the price target for LINK in this cycle?
📍 First target (minimum): 0.019600 ETH per LINK
📍 Second target: Around 0.03 ETH per LINK
💡 My personal strategy: Sell 50% of your LINK at the second target and keep the rest for bigger gains because LINK has massive potential for this cycle! 🚀
✅ I hope you enjoyed this idea!
Don't forget to like & follow for more 🔥
🐺 KIU_COIN 🐺
Short Idea on Nasdaq (NQ1!)- Stop loss : 22771.25
- Profit target : 20507.75
Based on seasonality,valuation, volume profile levels

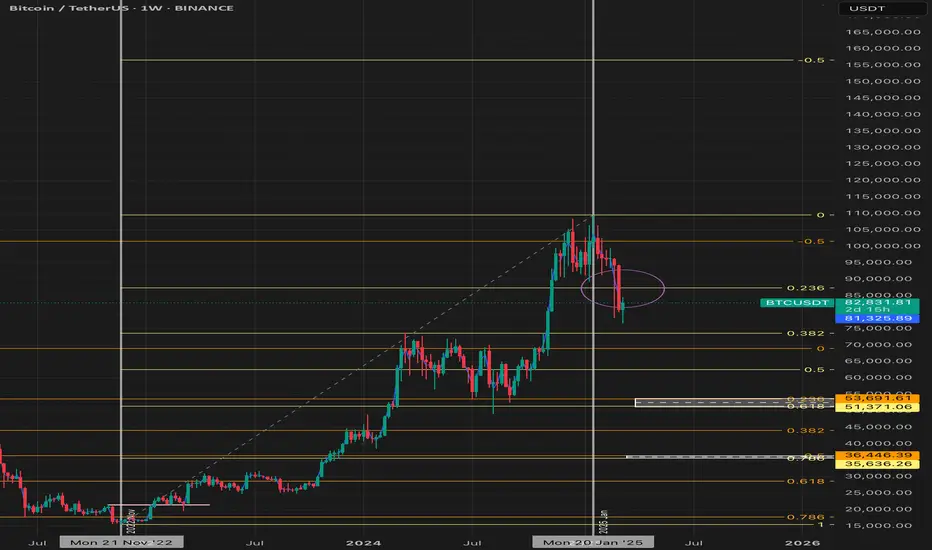
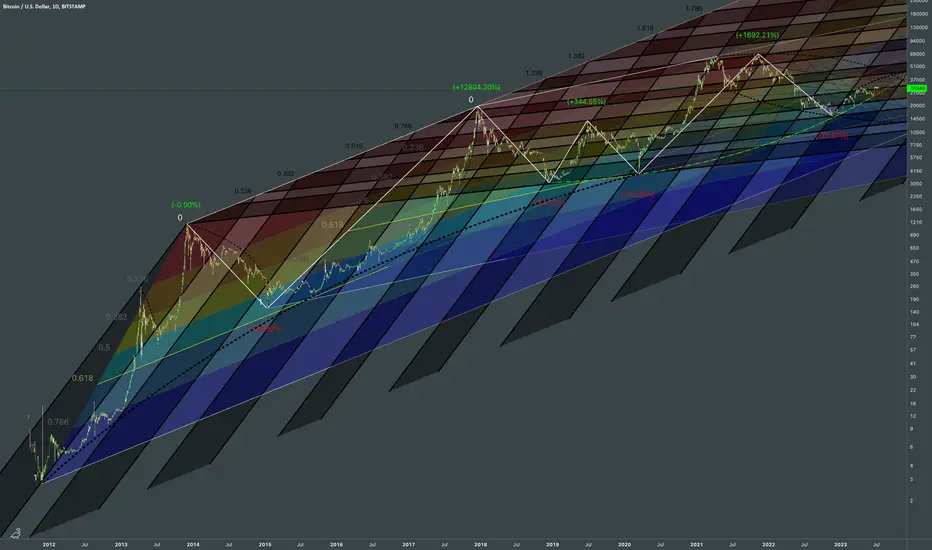
Bitcoin is Headed to $36K And It’s Happening NOW!This might not be the most popular opinion, especially among those who still believe the current Bitcoin bull cycle hasn’t ended. However, I encourage you to take a few minutes, approach this with an open mind, and let me know whether you agree or disagree.
Understanding the Previous Cycle (2020–2021)
The last Bitcoin bull cycle began in March 2020, when BTC bottomed at approximately $3,810. It then surged to an all-time high (ATH) of $69,870 in November 2021, marking the cycle top.
By applying a Fibonacci retracement to this entire range, we can see that the golden pocket (0.618 - 0.786 Fib)—often a key support zone during bear markets—fell between $17,700 and $28,690.
Looking at the chart, BTC beautifully retraced into this zone, even dipping slightly below it to form a cycle bottom at $15,500 in November 2022.
The key sign that the bear market had ended and a new bull market had begun was when Bitcoin broke above the 0.786 Fibonacci level of the previous cycle and established a higher high on the weekly chart. This marked a clear shift from a bearish to a bullish market structure.
The Current Cycle (2022–2025)
From the November 2022 bottom, Bitcoin rallied, setting a new ATH at $73,600—just slightly above the previous peak. After some consolidation, it found strong support at the 0.236 Fib level of the previous bull cycle, signaling that the uptrend was still intact.
The real breakout came when BTC surpassed the psychological $100,000 level and consolidated around the -0.5 Fib extension of the previous cycle. The cycle top appears to have been put in after Donald Trump took office in January 2025, marking an approximately 26-month bull run—longer than previous cycles.
However, a major bear market confirmation signal has now emerged: BTC has decisively broken below the 0.236 Fib retracement of this cycle, which historically signals the end of a bull market and the beginning of a new bear phase.
Where is the Next Bottom?
By analyzing the Fibonacci levels of both the previous and current bull cycles, we can identify key potential support zones where Bitcoin may bottom out:
1. $51,370 - $53,700
• This range aligns with:
• 0.236 Fib of the previous bull cycle
• 0.618 Fib of the most recent bull cycle
• This zone has confluence, making it a high-probability support level.
2. $35,600 - $36,500
• This range aligns with:
• 0.5 Fib of the previous bull cycle
• 0.786 Fib of the most recent bull cycle
• If BTC breaks below the first support zone, this is the next key level to watch.
Historically, Bitcoin bear markets last around one year, so we can expect this downward trend to play out over a similar timeframe.
How to Position Yourself?
For long-term investors, these support zones offer prime buying opportunities to accumulate Bitcoin at discounted prices before the next bull run begins. While the market won’t move in a straight line down—expect bounces and fake-outs—the general expectation is that BTC will find its next higher low within one of these zones.
Looking Ahead: Next Bull Cycle Target
If we use the same -0.5 Fib extension strategy that predicted the previous cycle’s top, we can estimate the next bull market peak. Based on the current cycle’s Fib range, the projected ATH for the next bull run would be around $157,000.
Final Thoughts
While nobody can predict the future with certainty, historical price action, Fibonacci levels, and market structure provide strong clues about where BTC is headed next. As always, flexibility is key—if market conditions change, so should our expectations. But if history repeats itself, these levels offer a solid framework for identifying the best entry points and positioning for the next major bull run.
What do you think? Do you agree with this analysis, or do you see it differently? Let me know in the comments!
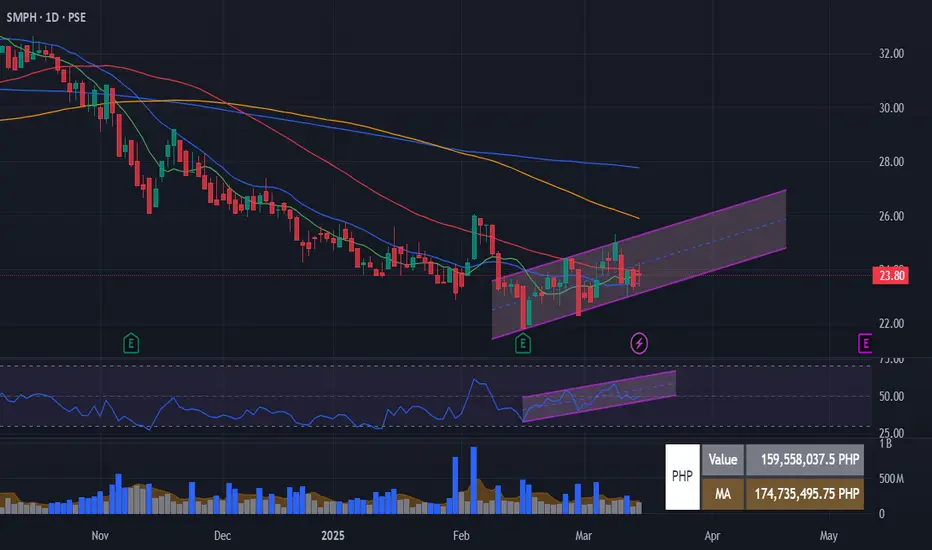
SMPH Possible Trend ReversalAfter months of downtrend, SMPH seems to be somehow recovering from its bearish sentiment. From downtrend to sideways
Confluence
Macro: Shift from downtrend to sideways
Daily chart: higher lows
RSI: higher lows
Short term outlook: Looking like a 1 month short term uptrend.
Other Notes
Possibly looking to make a DB MB BO and hopefully a DB BT BO
Coming from a macro downtrend, sentiment shifting to defensive stocks. Property sector may not be the first mover post bearish sentiment since its not a defensive sector but perhaps the speculated rate cuts may help.
Earnings also released and looking good.
Whales are loading up ETH while retailers are giving it away...Hello Traders 🐺
In this idea, I want to talk about the ETH/BTC chart, because in my opinion, ETH is already heavily oversold, and this signals a massive upward move coming for ETH. 🚀
Also, I've brought solid evidence showing that whales are silently accumulating ETH, just like they did when ETH was around $ 4000 — while right now, we are sitting at the very bottom of the cycle, far from the previous ATH. 👀
Take a look at this CryptoQuant chart, showing the ETH balance of whale wallets (10K - 100K ETH):
🧐 My Analysis:
As you can see, whales have been silently accumulating ETH since early 2023, while the price (white line) has been consolidating. 📈
This exact same pattern happened in 2017 and 2020 before Ethereum's major bull runs.
🔥 What does this mean?
✅ Whales always accumulate before the big move happens.
✅ This is a strong signal for an upcoming ETH breakout.
✅ We are currently at the bottom of the ETH/BTC chart, which gives the highest risk/reward opportunity right now.
In my opinion, Ethereum will be one of the best-performing assets in this bull cycle. 🐂💎
Don't miss it. 🚀
🐺 KIU_COIN 🐺

XAUUSD 14.03 – Watching for Shorts After ExpansionAfter yesterday’s expansion move up, making higher highs, we are now looking for shorts targeting the Previous Month’s High (PMH) at 2955 and the 2935-2940 range (50% Daily retracement).
- Narrative: Possible expansion to retracement
- Current Price Action: Manipulation of yesterday’s high + lower timeframe break suggests shorts may be in play.
Refer to the video for a detailed breakdown.
#PipsnPaper #TradingView #XAUUSD #PriceAction

M2 GLOBAL LIQUIDITY COMING TO SAVE THE DAYDoes the market look dead?
Wanna know what brings it back?
PRICE.
Wanna know what brings back price?
LIQUIDITY.
Steady lads, deploying more capital 🚢

NAB Monthly Long term structureElliotticians, don't crucify me... I'm no expert in EW theory!
But I believe we are seeing a super high level double or triple three pattern emerging in NAB
Long term it appears that NAB was in a trending pattern till 2009
Currently we are in a long term corrective phase, which consists of large Flat corrections and zigzags or triangles
Overall we just completed a large Flat 3-3-5 wave pattern and likely to see a fall into an ABC correction (zigzag) to start a new corrective phase or possibly create a large long term triangle
What this suggests is that this is in a large ranging pattern... so trading in and selling out at long term resistances would be the smart play until such time as the longer term structure becomes clear and builds a completed base to start a trending move outside of this structure
Ranging markets chew up time to create the base for the next long term trend and in this case we are likely to see the range continue until we see some completed structure
Some beginners sometimes do not understand ranging markets as they are harder to understand than trends... but if you get the overall grasp of them you can differentiate the difference between a real buying opportunity that have completed ranging structures within it and a short term buying opportunity and position yourself accordingly
I've posted a few on the ASX over the years and each time the moves out of these tend to be strong and persistent

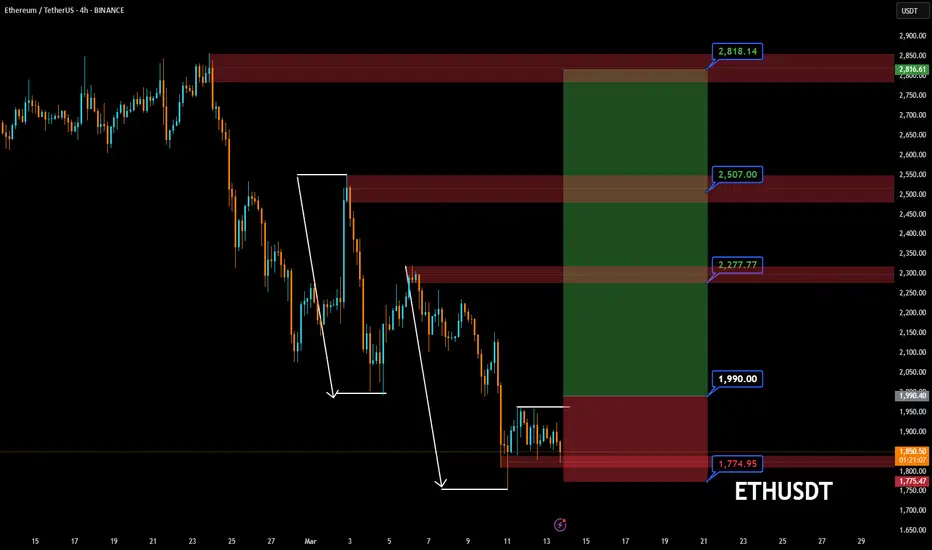
ETHUSDT 📉 ETHUSDT Trade Signal 📈
🔥 Long Entry: $1,990
🎯 Targets:
✅ 1️⃣ $2,277
✅ 2️⃣ $2,507
✅ 3️⃣ $2,818
🛑 Stop Loss: $1,774
⚡ Breakout Watch: Wait for confirmation above $1,990 before entering! 🚀
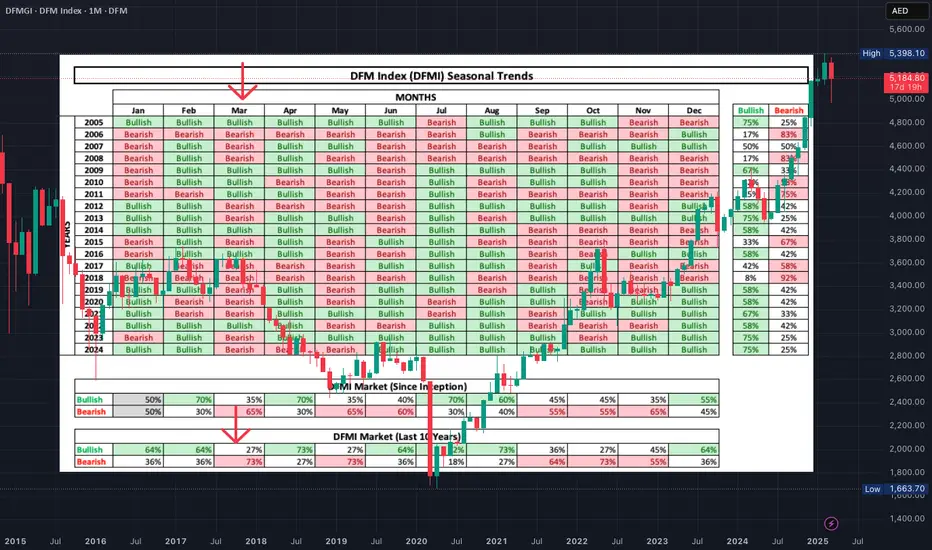
DFMGI - DFM Index - Seasonal Trends [Good News!]Good Day, Trader!
Our seasonal analysis of the DFM Index over the past 10 years reveals that March has historically been bearish more than 70% of the time.
However, there’s good news on the horizon— April has shown a bullish trend in over 70% of the past decade!
For a complete view of the seasonal and cyclic trend analysis of the DFM Index since inception, check out the full chart.
Happy Trading!
Quarterly Theory "QT"
Introduction to Quarterly Theory (QT)
Time must be divided into quarters for a proper interpretation of market cycles.
Combining QT (Quarterly Theory) concepts with basic ICT concepts leads to greater accuracy.
Understanding QT allows you to be flexible. It adapts to any trading style as it is universal across all time frames.
QT eliminates ambiguity by providing specific time-based reference points to look for when entering trades
.
THE CYCLE
Annual Cycle - 3 quarters each
Monthly Cycle - 1 week each
Weekly Cycle - 1 day each*
Daily Cycle - 6 hours each
Session Cycle - 90 minutes each
*Monday to Thursday, Friday has its own specific function .
Annual Cycle:
Q1 JANUARY - MARCH
Q2 APRIL - JUNE
Q3 JULY - SEPTEMBER
Q4 OCT - DECEMBER
Monthly Cycle**:
Q1 FIRST WEEK
Q2 SECOND WEEK
Q3 THIRD WEEK
Q4 FOURTH WEEK
Weekly Cycle*:
Q1 MONDAY
Q2 TUESDAY
Q3 WEDNESDAY
Q4 THURSDAY
Daily Cycle:
Q1 ASIA
Q2 LONDON
Q3 NEW YORK
Q4 AFTERNOON
**Monthly Cycle starts with the first full week of the month.
*Friday has its own cycle, which is why it is not listed.
Q1 indicates the quarters that follow.
If Q1 expands, Q2 is likely to consolidate.
If Q1 consolidates, Q2 is likely to expand.
TRUE OPENS
True price opens are the beginning of Q2 in each cycle. It validates key levels.
What are the true opens?
Yearly: First Monday of April (Q2)
Monthly: Second Monday of the month (Q2)
Weekly: Second daily candle of the week
Daily: Start of the London session (6 hours after the open of the daily candle)
Asia - London - NY - Evening: 90 minutes after the open of the 6-hour candle.
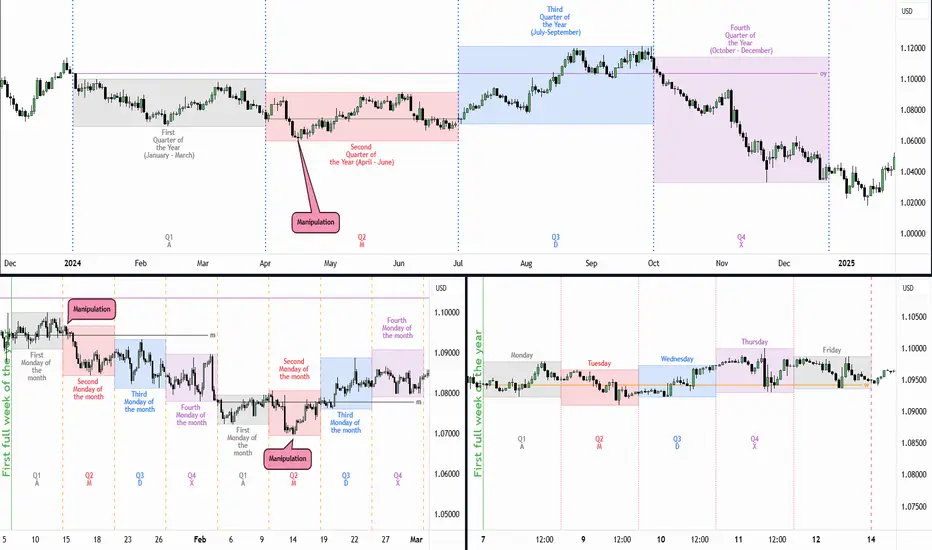
DIAGRAM:
Q1 (A) Accumulation - Consolidation.
Q2 (M) Manipulation - Judas Swing (Trade this).
Q3 (D) Distribution (Trade this).
Q4 (X) Continuation - Reversal of the previous quarter.
Q1 (X) Continuation - Reversal of the previous quarter.
Q2 (A) Accumulation - Consolidation.
Q3 (M) Manipulation - Judas Swing (Trade this).
Q4 (D) Distribution (Trade this).
ANNUAL CYCLE:
MONTHLY CYCLE:
WEEKLY CYCLE:
DAILY CYCLE:
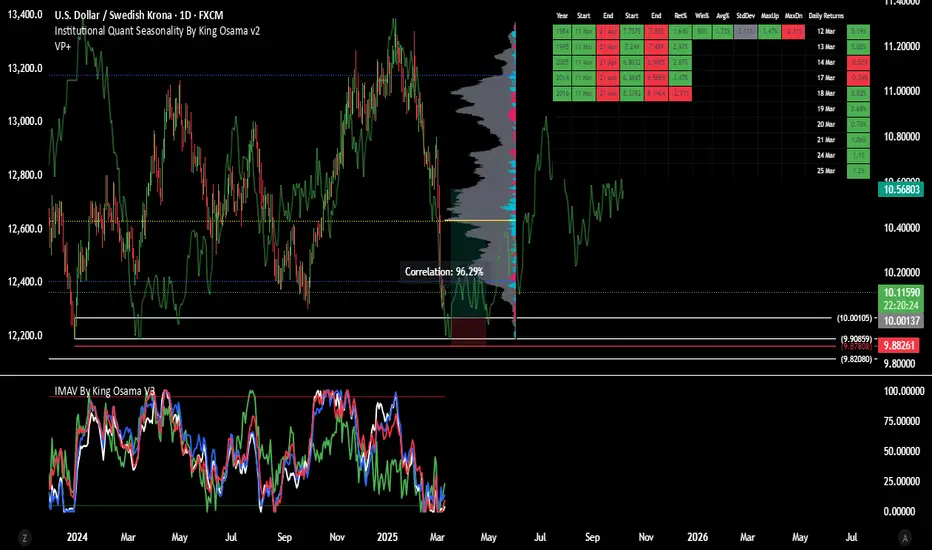
Buy idea on USD/SEKBased on
- Cycle analysis and quantitative data
- Strong Demand Zone
- Undervalued Conditions
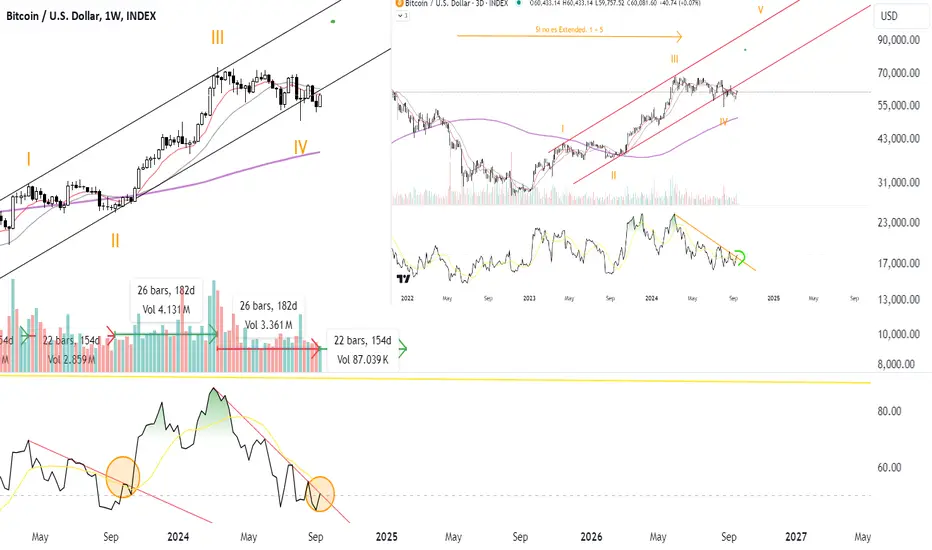
BTC 3 MONTHS LONG Starts, this week?Waiting for a last impulse 140 ds/3 months on INDEX:BTCUSD BITCOIN, this week could the 3 months BTC LONG START . Why? Let´s see:
- Channel with 4 elliot waves done. Looking for Wave 5.
- RSI 3D breaking out, like 1 year ago.
- RSI W Just about to Break out, like 1 year ago. Looking for confirmation.
- Rate Cuts this week, lets see.
tradingview.sweetlogin.com INDEX:BTCUSD
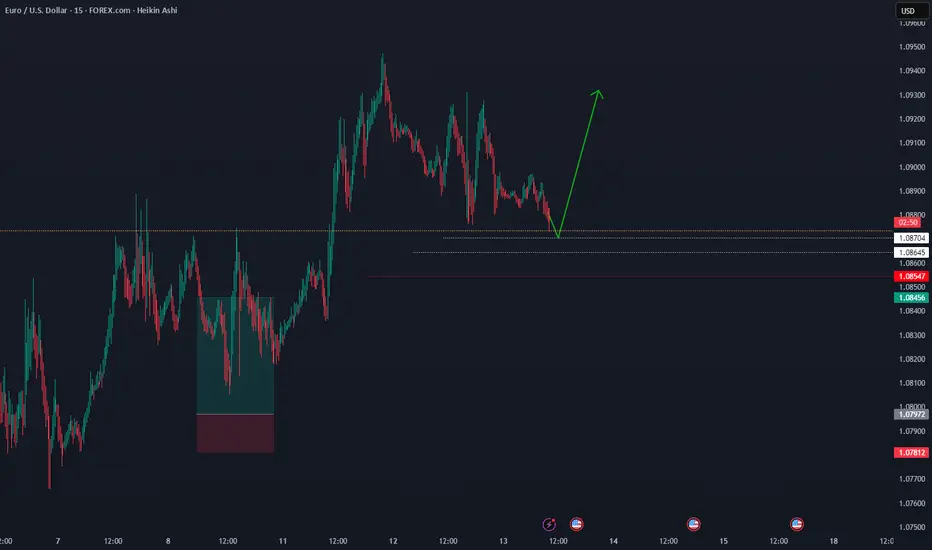
EURUSDFrom the price range of 1.08704 to 1.08645, there is a possibility of an upward move to the target of 1.09300.
Bitcoin Full InterconnectednessIn fractal analysis the randomness of price levels can be justified with the chart's historic HL coordinates.
We'll use the old structure below as a base for further cycle breakdown.
There are another two fib lines derived from angled trends, the fibs of which rhyme with chaos behind price action and cycle formation:
Steep fibs determine timing of high volatility change:
Note that they rhymed with other fib local wave measurement:
2013 ATH ⇨ Covid19 low related to pre-covid local high determines exact levels of support and resistance during the correction of pandemic fueled bullrun
What also deserves attention here is that direction of fibs which acted as support around 2019 and covid19 drop produces curve which mimics the support levels of 2023 growth.
So crossing below the support curve would be seen as first sign of bear market. Till that it has a time for growth justified by chart-based parabolic curve.
2 fibs derived from chart shows a decade of price & time interconnectedness which adds validity of the colored base structure.
This is important for scaling the fractal and estimating the boundaries of growth distinctive to the historic cycles.
Long trade
Thu 13th March 25
1.00 pm (NY time)
30min TF
Tokyo session PM
Reason for buyside trade:
Observed Price delivery
Buy/Sellside price action
On the 30 min TF...?
to determine directional
and buyside momentum
Entry 33.775
Profit level 34.290 (1.52%)
Stop level 33.725 (0.15%)
RR 10.3

SPY - L3 Bullish Daily Exhaustion SignalAMEX:SPY first level 3 bullish exhaustion signal on the daily since Jan 2016, when in marked the exact bottom. The other 3 times it happened in the past 30 years were during the 2000-2003 dot com bust.
Within 10 candles after the signal:
75% win rate
+3.5% average move
4 data points over 30 years

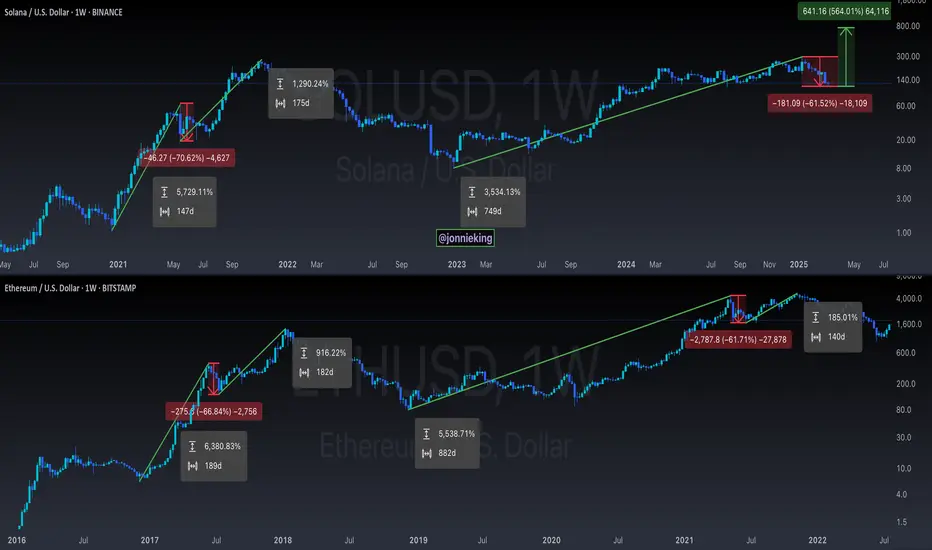
$SOL Dumps 60% - Is it Over !?CRYPTOCAP:SOL DUMPED OVER 60% ‼️
That’s after a 3,500% pump
from the bear market low in ’22.
Is it over!?
TL;DR - NO.
This is common after such an insane pump.
SOL Dec ’20 - May ’21
5,700% pump
71% correction
then another 1,290% pump
Let’s look at previous cycles with $ETH.
Dec ’16 - June ’17
6,380% pump
67% correction
then another 916% pump
Dec ’18 (bear market low) - May ’21
4,860% pump
62% correction
then another 185% pump
So you see my fine feathered friends,
there’s nothing new here.
Targets still remain $700-850 🤠
SELL GOLD Gold flat after Eu and China vow to counter US tariffs earlier this Wednesday.
A US-brokered ceasefire deal on Ukraine is up for Russia to consider in the coming days.
Traders are awaiting the upcoming US inflation data on Wednesday.

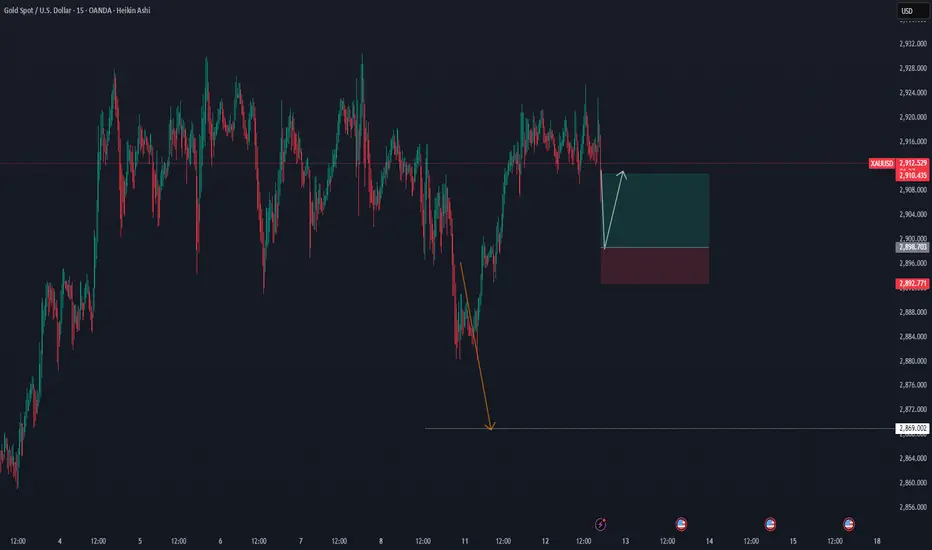
BTCUSDT During the American Session (Short from IFC)The price is in the premium zone on the 15-minute timeframe. An IFC bar has formed. A short trade from the IFC bar is possible.
In the inner block, a correction is expected: there is an opportunity to trade long against the trend up to the nearest liquidity.

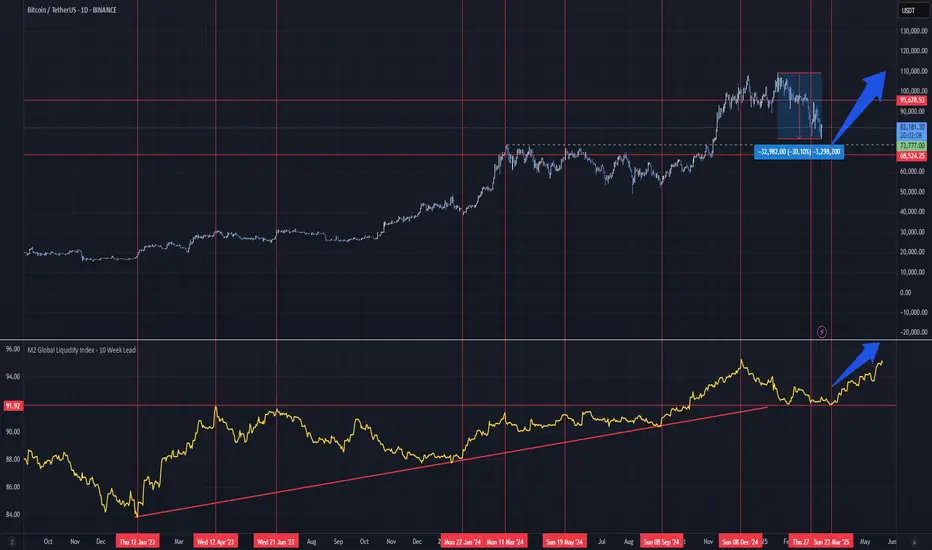
Don't Panic! Good times around the corner for BitcoinGlobal M2 Money Supply
Global M2 has been leading BTC price action very closely by 10 weeks.
Roughly 12 days from today for upward price action to strongly resume, if the correlation holds.
A wick down to 73-74k is nothing to worry about. In terms of time we are likely very close to the bottom, if it's not already in.
You can use the indicator on your chart for free below.
Shout out to @Mik3Christ3ns3n for the original indicator.