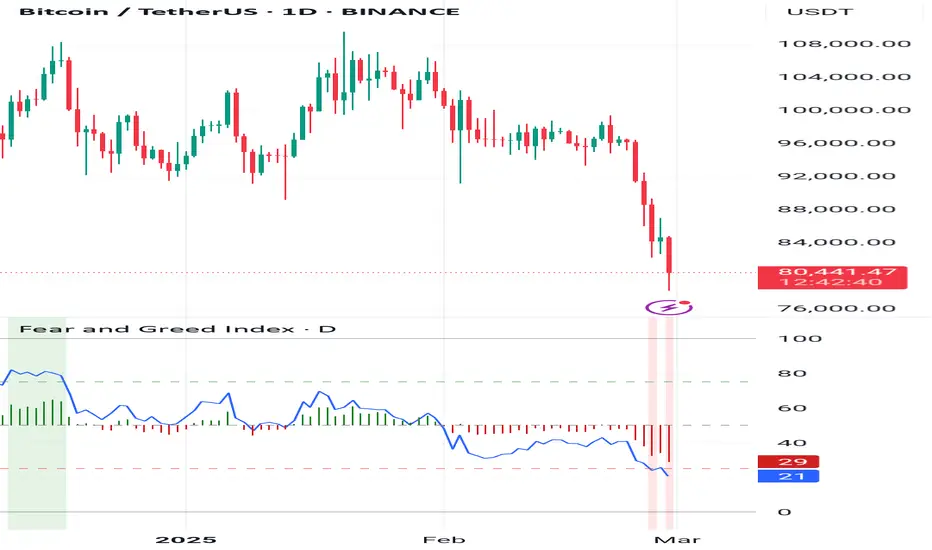
Alert!! market is in extreme fear nowBased on our Fear & Greed Index, the market is currently in a state of extreme fear. What led to this level doesn’t matter—what matters is whether we are seizing the opportunity to load up on our coins now.
Economic Cycles
BTC/USD H1 updated Cycles Forecast | February 28, 2025This forecast is based on cyclical patterns that aim to identify potential price reversal TIMES only.

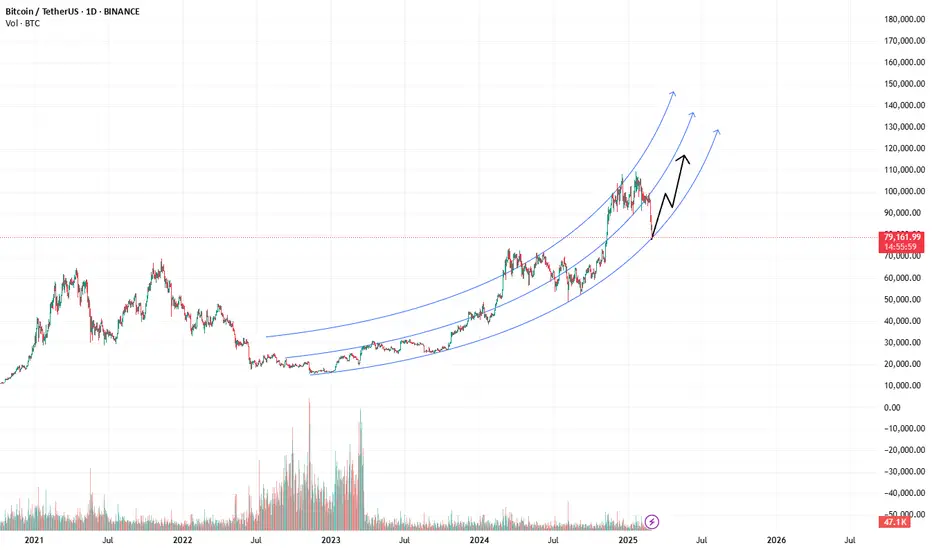
maybe Btc wake up!After almost 6 months since my last analysis, I’d like to share this analysis with you. After a long time, I’m finally buying a significant amount of Bitcoin because I feel it's a great buying opportunity, and we've reached the bottom of the curve that I drew for you.
i love you guys so much and I hope we all find success.
Left translated daily cycle to reset weekly cycleTargeting November futures gap.
Will flip bullish if reclaim and cross of 9/21D MA.

BTC/USD H1 Cycles Forecast | February 28, 2025This forecast is based on cyclical patterns that aim to identify potential price reversal TIMES only.

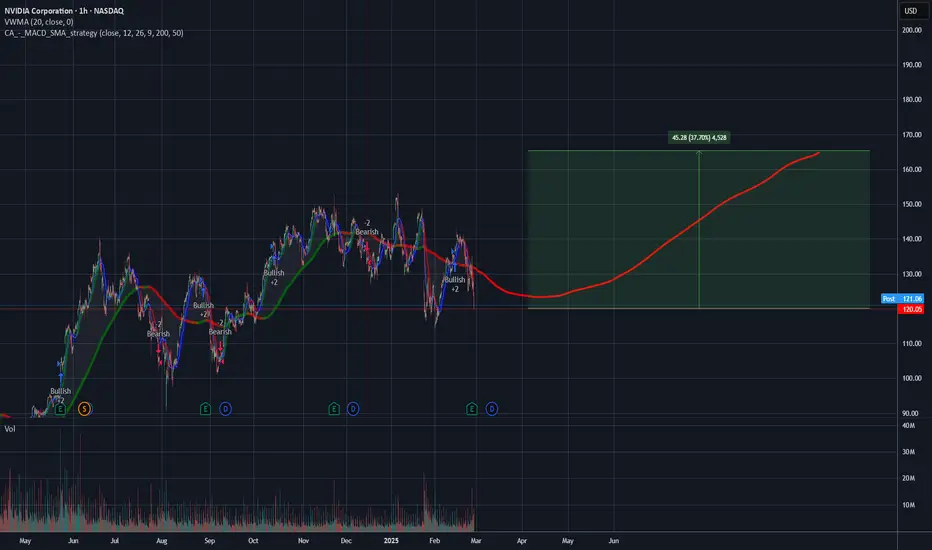
I think this looks logica. Am I crazy?NASDAQ:NVDA has always recovered strong after the earnings dip. I think the sell off has come to the end and the pump to $160 is ready
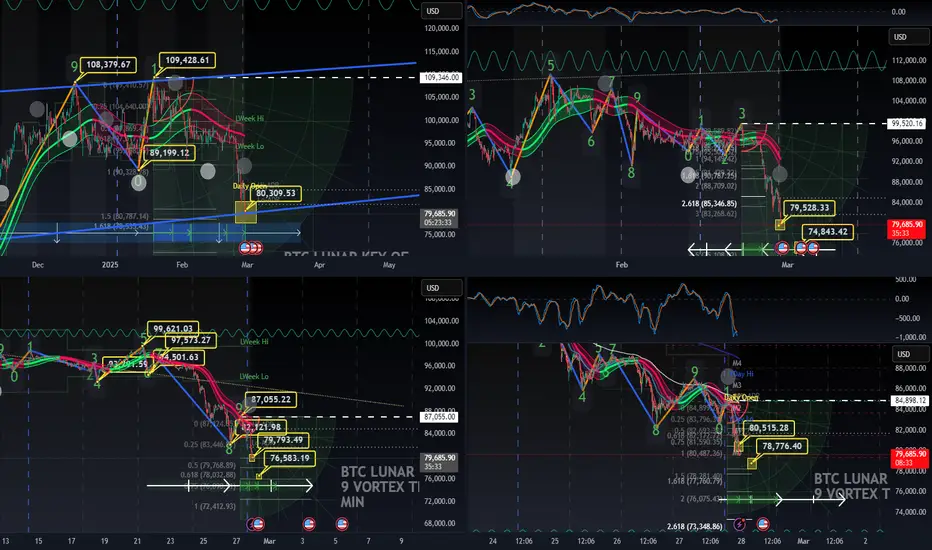
just an update on my 7 day key of 9 chart for bitcointhis is just an update to my key of 9 7 day chart for bitcoin so far so good

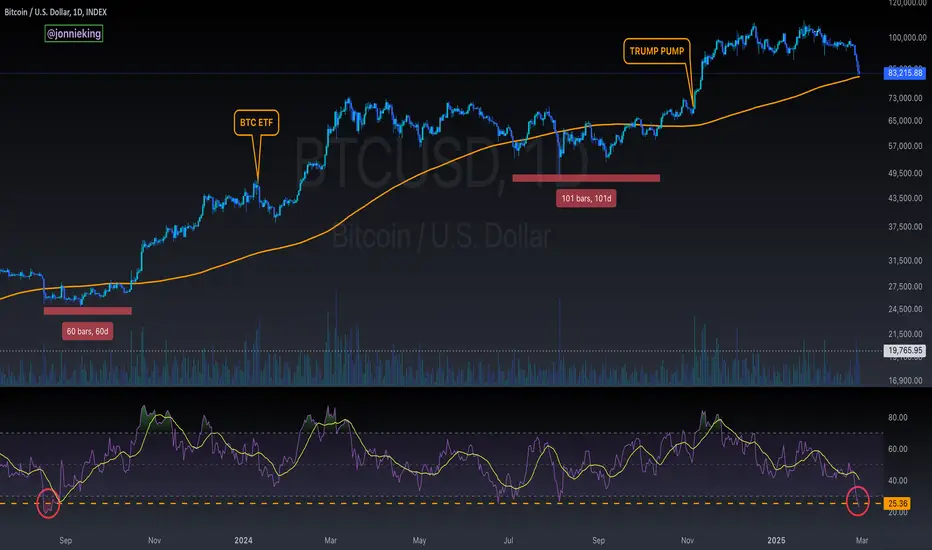
BTC At Critical Support on 200DMA + RSI Way Oversold₿itcoin testing critical support on the 200DMA 🚨
Last time it closed under on July 4, 2024 it ranged for 101 days.
RSI hasn't been this oversold since August, 2023.
Last time BTC was at this RSI level and closed under the 200DMA it ranged for 60 days.
HOWEVER, the only time BTC has ever closed under the 200DMA on a Post-Halving year was in May 2021, where it then went on to rally to another new ATH.
I'm personally buying here 💯
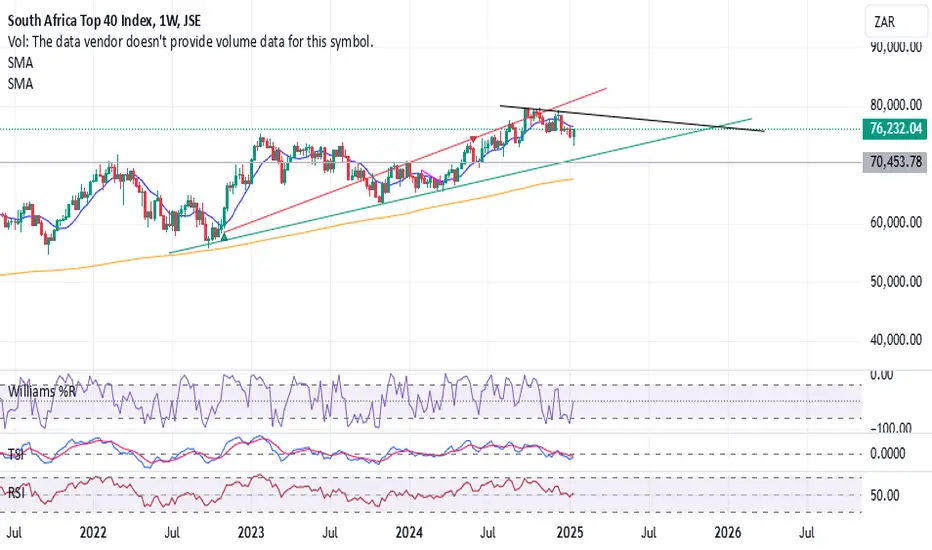
The JSE Top40 Medium-Term ViewThe JSE Top40 is at a point of a relief rally though the bigger picture is that of a yearly decline. So the expectation is that we can rally while expecting price to be capped by the black trendline, we either make it there or we turn down before reaching this point. Longer term I expect price to trend towards the green support line. Since we must breach this line, My interest will be on the grey horizontal line for support. A t the back of my mind is the COVID drop scenario, this is where we get extreme moves downwards representing a continuation of current cycle, otherwise without that scenario we would have a tough quarter one and two of 2025.
We have been in recession like conditions and so far, we could be going through a silent recession whereby conditions point that way but the economic measures do not confirm, does not help that US being leader in market sentiment has had war excursions to affect the indicators as well as constant revisions of the unemployment figures. The coming of Trump might cause war spend to decrease unraveling the dire state of the economy. It is best for traders to be aware of such a scenario and effect on the markets.
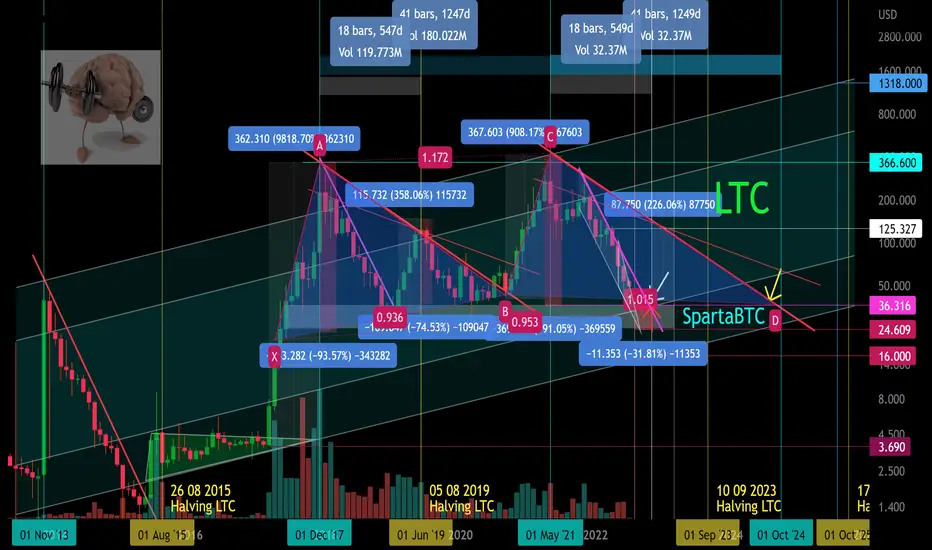
LTC/USD Main trend. Halving. Cycles The psychology of repetitionMain trend. The graph is logarithmic. The timeframe is 1 month. This idea is relevant both for understanding the secondary trend work and as a training in simple cyclic, logical manipulation processes. Note also the halving of the LTC and the designated time zones between cycles.
The primary trend is an uptrend in which a huge butterfly is forming (forming part 2)
Secondary trend is a downward channel.
Local trend in the secondary trend is a wedge.
Coin in the coin market : Litecoin
The chart is taken from the Bitfiniex exchange, I used it because of the long price history (the coin has been traded on this exchange for a long time). Of course, the chart is relevant for all exchanges with liquidity. The coin and the pair are liquid, it is acceptable to set large positions. The price behavior is predictable. Ups/Downs are similar. Let's consider them below.
Everything is unpredictable only for absolutely predictable people, it always was, is and will be.
Same time frame on a line chart (no market noise, pure trend direction)
A close-up of this area on the line chart.
And this area on the candlestick chart.
What matters is the average buy/sell. Approach the market regardless of the size of your deposit as a major market participant. Stop thinking like a "hamster". You don't need to guess, you need to know and be prepared for any outcome, even unlikely scenarios.
Psychology of behavior in the market.
Expectation. Reality. "Stop-loss resets. Cyclicality of predictable behavior. .
Predictable price behavior. "Knockouts" of obedient (acting by the rules) and naughty (acting on emotion) fools are as logical and predictable as anything else everywhere else. Increase your knowledge and experience, and it won't affect you.
Remember, theory without practice is nothing. Real trading is very different from theory, you should understand that. That's why all "programmed traders" lose money or their earnings are quite modest.
You should not ask anyone where to buy/sell this or that crypto-asset. You should initially know yourself under what conditions you will buy and under what conditions you will sell.
Past "stop-losses" before secondary trend reversals .
Secondary trend reversal zones and "takeout" before pullbacks in 2019 (+450 average) and 2021 (+900% average).
Candlestick chart. 3-day timeframe. Fear peak zones.
Line chart. Three-day timeframe. Fear peak zones. (without market noise).
As we can see, this "fear peak" on the line chart evaporates, all these local "super resets" have no effect on the trend. It's just the "death of hamsters." The capitulation of human stupidity and greed. You can add predictability and submissiveness to this. The train always leaves without such marketable characters.
Such always sell (fear) at the lowest prices, shortly before the trend reverses. It is worth adding that they buy at the highest prices "at the behest" of the pump to get fabulously "rich. This makes the cryptocurrency market super profitable. Such fuel is the basis of profit. "Market fuel flows" lend themselves to cycles.
Price management is the psychology and manipulation of people's minds through basic instincts through price values. All of this is real and as old as the world. A foolish person keeps stepping on the same rake, each time telling himself that this is the last time, or this is a special case.
This "last case" must be repeated systematically, but in different conditions that you create. Your effectiveness depends on how masterful you are at forming such obsessive thoughts in the mind of such market characters.
Fundamentals of Trading. Trading strategy. Capital management. Price forecasting.
It is your trading strategy and money management, based on your experience, that is the basis of trading, not guessing the price. But guessing is what most people want. Such people should have no money. As a rule, such people in real life are very poor, do not have their own business, go "to work" (do not want to take responsibility).
They think real life doesn't give them many resources, but market speculation will quickly make them fabulously rich. Rather the opposite is true. Total impoverishment regardless of the direction of the trend due to the reinforcement of destructive qualities of a person with financial instruments. The behavior of such people in the market is a projection of what they are like in real life.
The behavior of people in financial markets is a projection of what they are in real life. That is, their positive and negative psychological qualities. You can't run away from yourself. A stupid person will be overtaken by his own stupidity, a greedy person by greed, an intolerant person by intolerance, an indecisive person by indecision, an irresponsible person by irresponsibility.
Such will be punished by their own destructive qualities. The main thing is that the victim draws conclusions from this and it is an incentive to correct the root cause and basis of the failures, rather than looking for the culprit of his own stupidity in "random events" and other people.
You guessed once, second time, third time zeroed in and hit your own self-confidence with your own stupidity and predictability. Consequently, all your previous guesses at the distance equals zero.
Trading is a probability game. It is impossible to guess everything because of the many components of pricing. It is possible not to guess, but to know the more and less potentially realizable probabilities because of certain market conditions.
No one knows the exact future, there is only an assumed more likely future and the work that leads to it.
The basis of profit/loss is what you are in the here and now. Your knowledge and experience are projected onto the chart. The symbiosis of these two parameters makes or loses money in practice.
Read these 6 points carefully:
1) The first problem most marketers have is that everyone wants to get a lot of money in the moment and, most importantly, without effort. That's what most people want, so it's not rational or dangerous to satisfy their desires.
2) The second problem is that they can't be "out of the market" until they find a good entry point. "Fear of missing out" does its destructive work.
3) The third problem is, of course, the disease from "childhood," which manifests itself in adulthood. People begin to collect various crypto coins, endowing them with different values according to their beliefs and, above all, their desires.
4) The fourth problem is greed, insatiability combined with inexperience. People don't want to protect their profits, they want more and more and more and more and more, eventually from greed and inexperience they completely (more greedy) or partially (less greedy) nullify themselves.
5) Lack of knowledge and experience. Lack of desire to develop and learn. The less experienced a market participant is, the more confident he is in his competence and "screams text".
6) The sixth most serious problem - laziness. It manifests itself in the fact that few people want to work, everyone wants to have.
Under ideas are captured my trading ideas for this trading pair over the past 3 years. Most of them are previously closed trade ideas. There are 3 learning ideas that I have shown on this trading pair (based on publicly published simple trading ideas) .
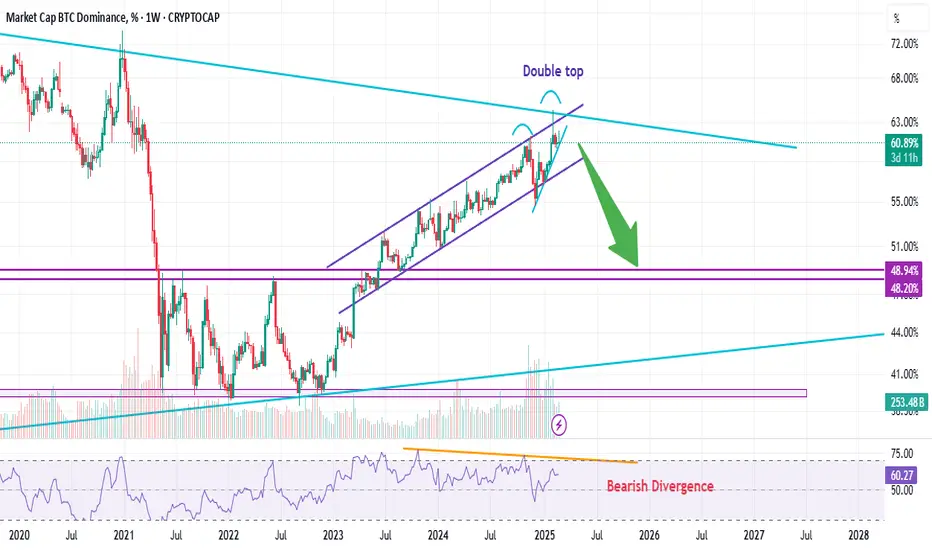
Bearish Divergence on the weekly chart !Hello Traders 🐺,
Over the past few days, we've witnessed a massive market dump. Interestingly, just one day before BTC's drop, I published an idea predicting the downturn, yet it received the lowest engagement I've ever had! Why? Because most people were expecting a continuous pump. But here's the truth: even in a bull market, price corrections are inevitable — that's how the market functions. 📉
So, if you want to stay ahead of the game and not miss the next big move, make sure you're following me for more insights! 🚀
Despite the recent dump, I still believe that Altcoins are about to experience a massive pump. But why?
As you can see in the chart, there's a significant bearish divergence on the weekly time frame. And as many of you know, the higher the time frame, the more reliable the signals, so a bearish divergence on the weekly is something we can really count on.
Secondly, we have a double top formation near a key resistance zone, which is a strong indication that a reversal could be near. Thirdly, we’re seeing a rising wedge pattern, which is another bearish sign.
So, in my opinion, all these factors together strongly suggest that we’re about to witness a major correction in the BTC.D chart — and a huge pump in the Altcoin market! 🚀
🐺 Stay sharp, trade smart! – KIU_COIN 🐺
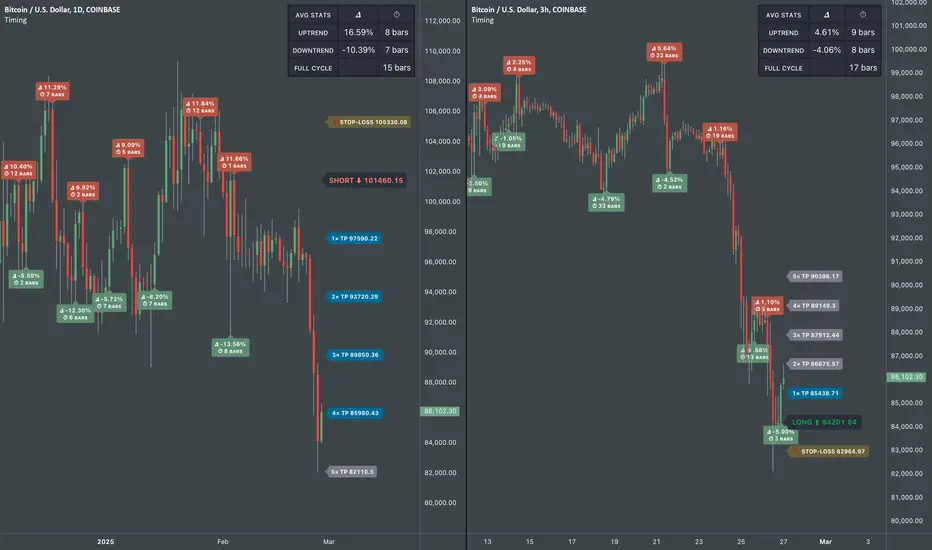
Strategy Development: Price Levels & Time ProcessingI’m currently working on a trading script designed to identify optimal stop-loss and take-profit levels based on market structure and volatility.
Day TF
Short entry: $101,460.15 with a stop-loss at $105,330.08
TP levels tested down to $82,110
Despite it played out ok I still need additional validation that will come with time. Point is to keep enhancing the script so most of the time price does not pass 5th take profit considering latest periods between consecutive Long & Short signals.
3H TF
Alternatively, I picked different timeframe for another layer of performance evaluation from another perspective.
Long entry: $84,201.84 with a stop-loss at $82,967.61
TP levels tested up to $90,372.97
Blue TP means the closing price reached the level, while gray - did not.
⏱ TIMING
Many traders focus on price levels but overlook the time duration between long and short signals. However, understanding how long trends last is just as crucial as knowing where price might go.
Why does this matter?
If your strategy enters a long trade too soon after a short trade, you might be catching a dead-cat bounce rather than a real reversal.
If your signals occur too frequently, the system may be overreacting to market noise rather than identifying meaningful trend shifts.
Tracking the duration of trend phases helps you align with market cycles rather than getting whipsawed by short-term fluctuations.
The results will be viewed carefully and will be used to improve the logic (code-wise) for better trend detection; stop-loss placements to avoid unnecessary stop-outs; refined entry timing.
The end goal is to make the strategy learn from both aspects of past data - price and time to completely eliminate a need for any user inputs.
Please, let me know:
How you incorporate time-based analysis (other than fixed cycles) into your trading.
If you would want this strategy available for public.
BE ALERT AUDJPY IN SUPPORT ZONE.Audjpy in support zone of Daily Timeframe if Any Daily Candle Give Us Confirm To Prices Go Up Market Will Go Their Rest Lequidity Areas To Hunt Or Fill The FVGs Of Sell Side.
Tip! Trading, like any high-performance endeavor, requires skill, focus, and discipline. Those who are in it for the money alone aren’t likely to focus on the process of being a good trader.

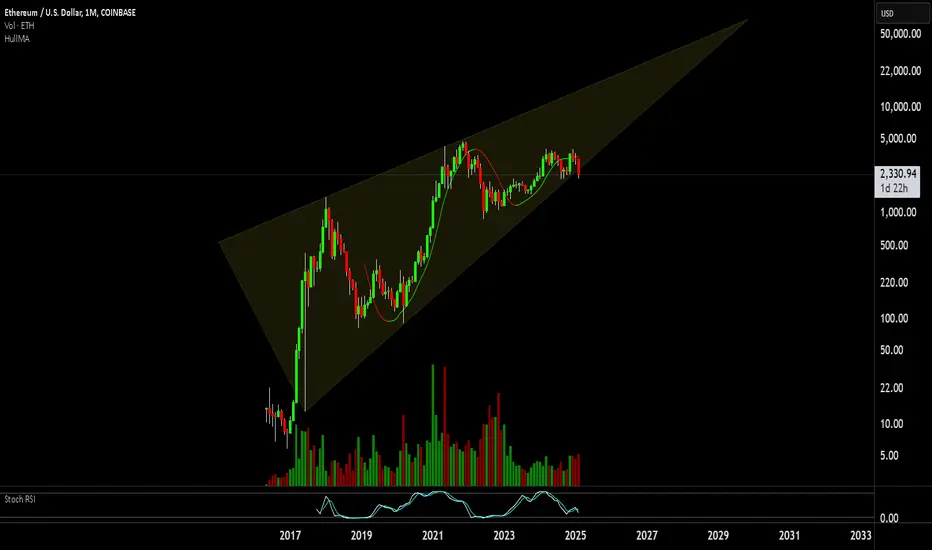
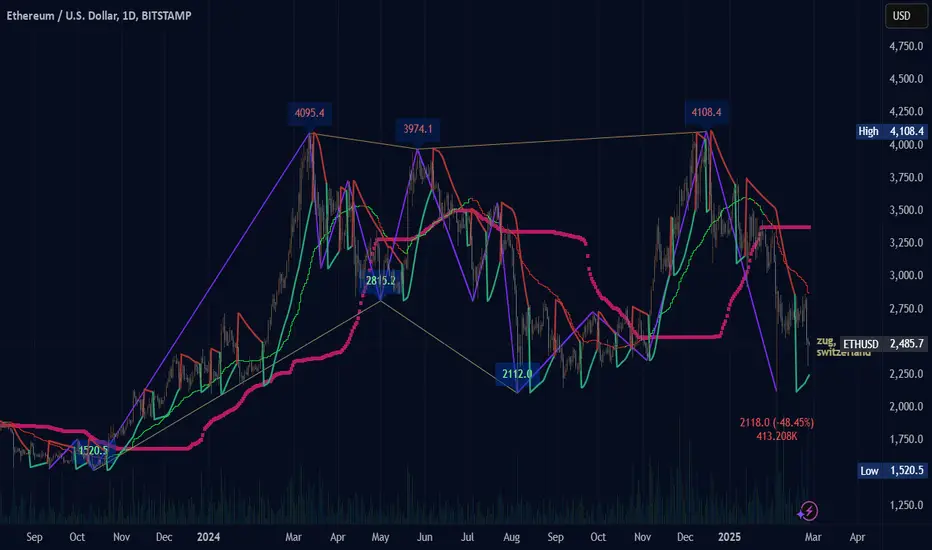
Ethereum Rising WedgeEthereum in all-time rising wedge, now borderline falling out and breakdown to a disastrous level...
It's Time for Bitcoin's Future Trend!As I mentioned in my post yesterday, there was a possibility of the price dropping to the 0.5 Fibonacci zone, from which I expected active buying followed by a trend reversal for Bitcoin and the entire crypto market.
The price of Bitcoin has dropped to the 0.5 Fibonacci level, and this was enough to trigger a reaction. We’ve already seen a +2,000 price bounce, and there may still be some volatility with price movements up and down, but a drop below 82k is unlikely. I’m waiting for the daily candle to close, after which I will consider my strategy for opening a position.

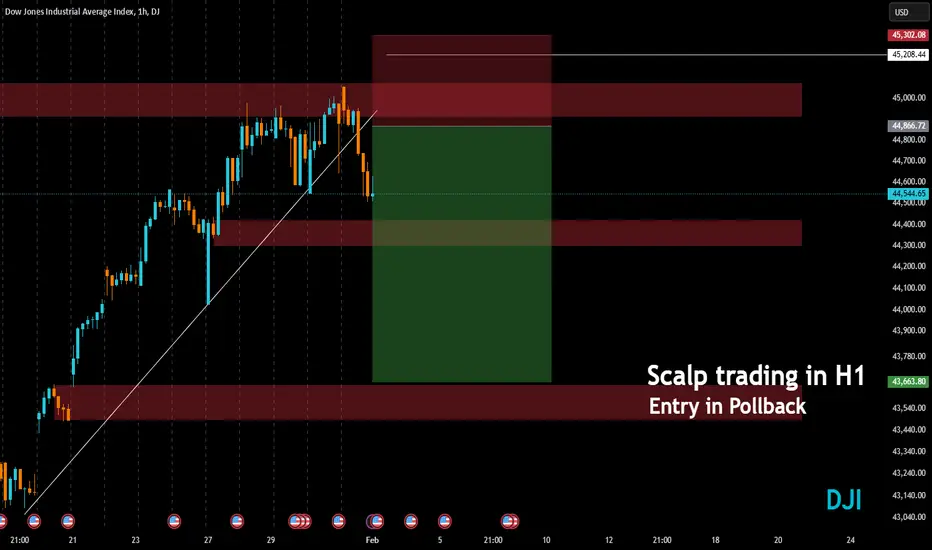
US30 sellOverall Trend:
The overall trend has been bullish, but there has been a breakout below the ascending trendline.
The price is currently retracing towards support zones.
Key Levels:
Main Resistance: Range between 45,208 - 45,300 (upper red zone)
Main Support: Range between 44,300 - 44,500 (lower red zone)
Important Mid-Level: Around 44,866
Trading Scenario:
After hitting resistance, the price has started a correction.
The highlighted green area marks a potential entry zone.
📉 Trading Signal:
🔹 Enter Short Position:
If the price pulls back to the 44,600 - 44,700 area and shows signs of bullish weakness, a short position could be considered.
🔹 Stop Loss:
Above the resistance zone at 45,208 (e.g., around 45,300)
🔹 Take Profit:
First level at 44,300
Second level at 43,663 (shown on the chart)
Third level at 43,140 if the downtrend continues
🔹 Risk Management:
The risk-to-reward ratio for this trade seems reasonable. Reassess the trade if the price breaks above 44,866.
✅ Conclusion:
Currently expecting a bearish correction, but if reversal candles or weakness in sellers are observed at support levels, there might be a chance for a trend change.
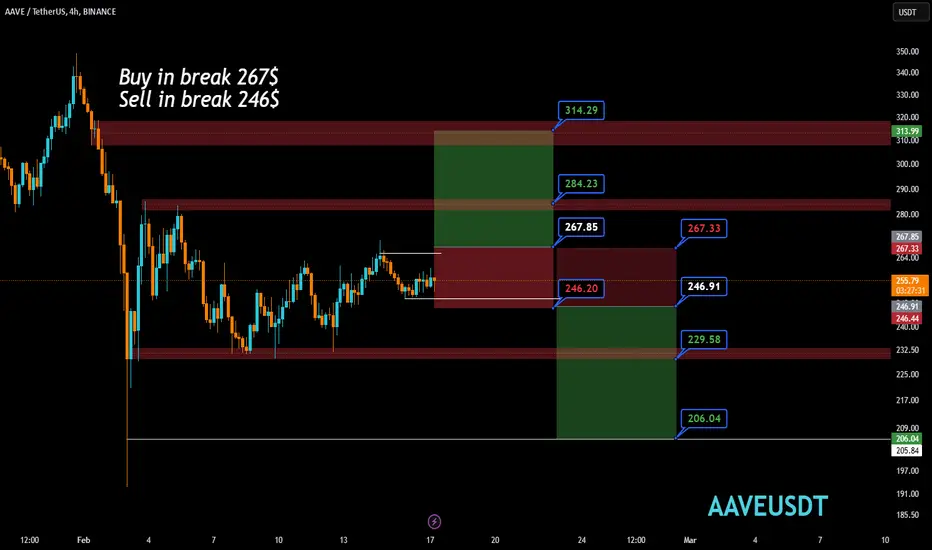
Buy and SellBuy and Sell Signal for AAVEUSDT
📌 Buy Signal:
Buy if the price breaks $267.
Stop-loss: $247
Bullish targets:
$284.23
$314.29
📌 Sell Signal:
Sell if the price breaks $246.
Stop-loss: $267
Bearish targets:
$229.58
$206.04
🔹 Risk Management: Considering support and resistance levels, an appropriate stop-loss should be set.
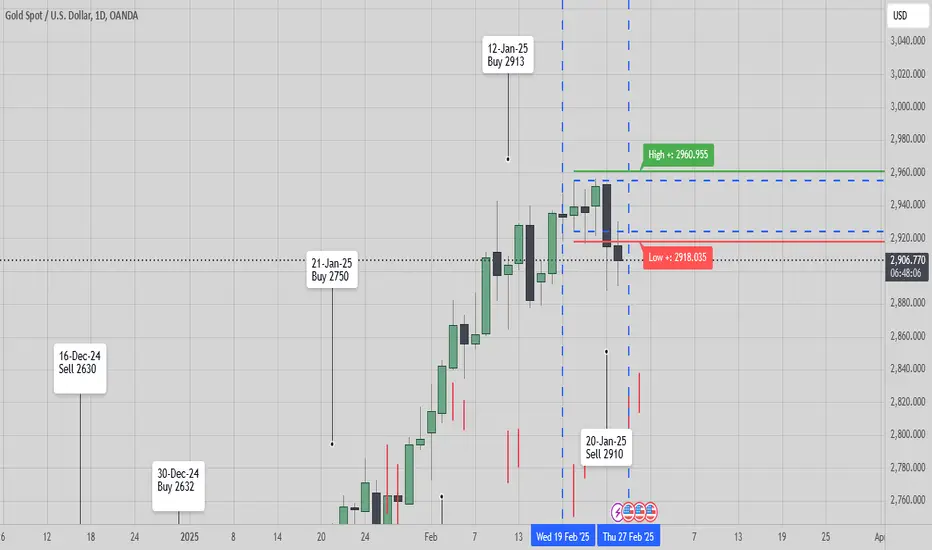
[ TimeLine ] Gold 20 February 2025Hello everyone,
I will be using the high and low price levels formed on the following dates as entry points for my trades:
February 20, 2025
We will wait for the price range from these candles to form as indicated with blue box. The trade entry will be triggered if the price breaks out of this range, with an additional buffer of 60 pips.
If the price moves against the initial position and hits the stop loss (SL), we will cut or switch the trade accordingly.
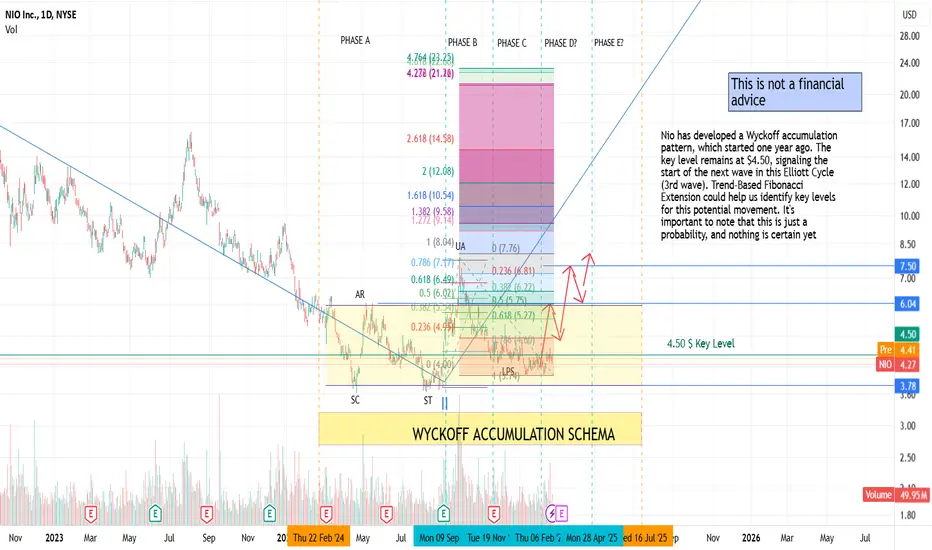
Nio - It's his time to change the EV conception?Nio has developed a Wyckoff accumulation pattern, which started one year ago. The key level remains at $4.50, signaling the start of the next wave in this Elliott Cycle (3rd wave). Trend-Based Fibonacci Extension could help us identify key levels for this potential movement. It's important to note that this is just a probability, and nothing is certain yet.
What about the company ?
NIO is a Chinese electric vehicle (EV) manufacturer that has gained significant attention in recent years, particularly for its innovative approach to battery technology and its premium EV offerings. Founded in 2014, NIO has positioned itself as a major player in the global EV market, particularly in China, and is looking to expand its presence internationally.
Over the past three years, NIO has shown impressive growth in terms of vehicle deliveries. In 2021, the company delivered over 91,000 vehicles, a substantial increase from the 43,000 vehicles delivered in 2020. In 2022, NIO continued its upward trajectory, delivering over 122,000 vehicles, marking a strong year despite global supply chain challenges.
One of NIO's most innovative features is its battery swapping technology, which sets it apart from many other EV manufacturers. Instead of relying solely on traditional charging methods, NIO offers a Battery as a Service (BaaS) model. This allows customers to swap their depleted battery for a fully charged one at one of NIO's battery swap stations. This process takes just a few minutes, significantly reducing the waiting time compared to traditional charging stations.
This battery swapping system is part of NIO's strategy to address some of the main challenges associated with electric vehicles, such as long charging times and the high cost of battery replacement. It also allows NIO to offer vehicles at a lower upfront cost, as the battery is leased separately. This innovative system has the potential to revolutionize the EV market by offering a more convenient and flexible solution for drivers.
NIO's focus on advanced technology, luxury EVs, and battery swapping has made it a strong competitor in the growing electric vehicle industry. With plans for further expansion into Europe and possibly the U.S., NIO’s innovative approach to the EV market could play a key role in the future of electric transportation.
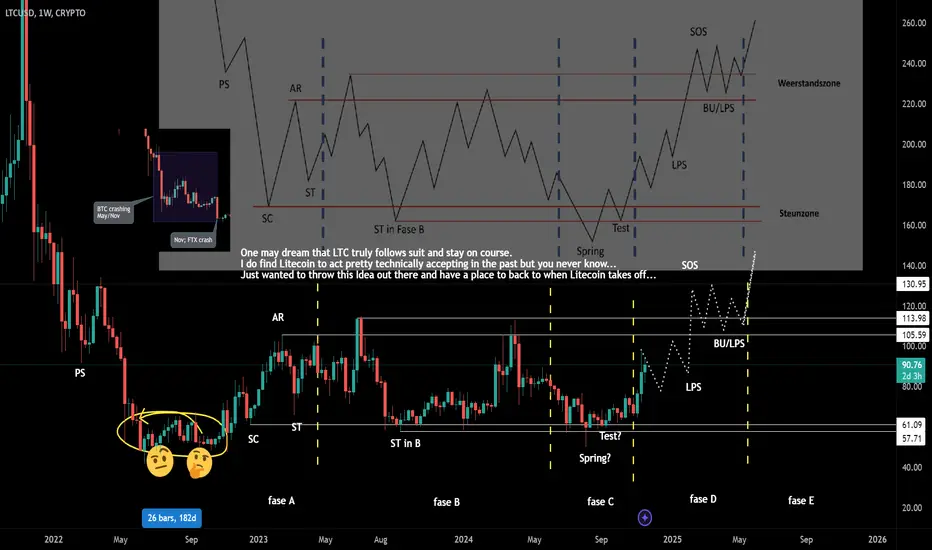
Litecoin Wyckoff Accumulation 2024One may dream that LTC truly follows suit and stay on course.
I do find Litecoin to act pretty technically accepting in the past but you never know...
Just wanted to throw this Idea out there and have a place to look back to when Litecoin takes off...
(ETH) ethereumWhen can we expect to see reports on the new concepts about Ethereum in the future?
Buying mode, price of Ethereum well under the dotted line. Ethereum has not had a strong position for some time and is likely to find profits. One large drop in price does not usually follow another than another than another and especially not with such large volume and capital. Am I in control of the flow, no. Do I have billions to make heavy movements, no. Am I interested in the progress of Ethereum despite holding little to no value in Ethereum, yes.
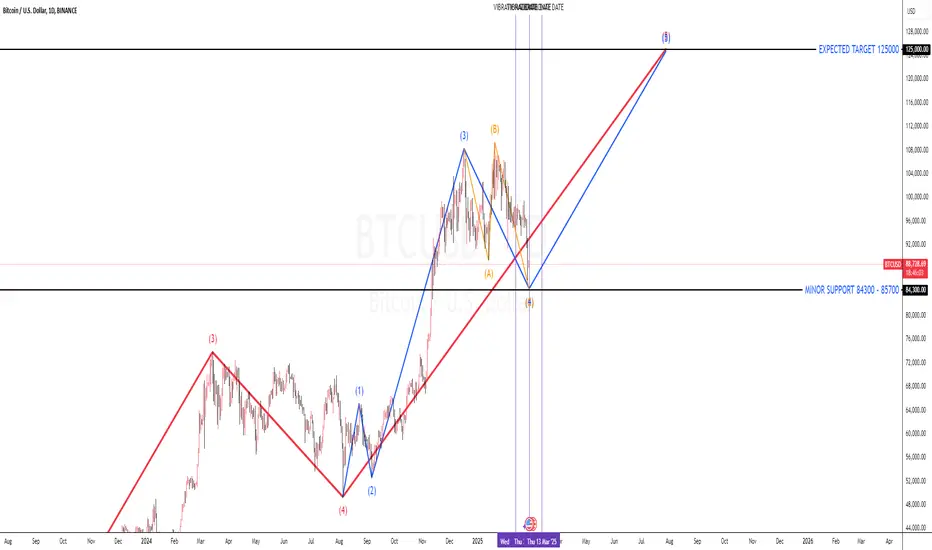
BITCOIN WILL EXPECTED TO 125000!!!As you can see now bitcoin make 4th cycle of elliot wave, and today we're gonna wait for price hit to minor support, the minimum takeprofit will be at 98000.