Important Bitcoin levels. The game of expectations.Today, it is important for Bitcoin to close below 88,000. There is a high probability that today the price will drop to the 0.5 Fibonacci level, thereby partially closing the gap on the daily chart, and the RSI will consolidate below 30 even with a closing price below 88,000. All these factors combined will be sufficient to trigger strong accumulation with a breakdown of the structure, leading to a new all-time high within the next 2-3 weeks.
However, the market doesn’t always play out perfectly. There remains a possibility of a prolonged scenario. In this case, from the current price block (88k - 86k), the price may form a local bounce with a full ABC cycle in the coming days and test the key resistance level (106,200). After that, the price will likely return to the 0.5 Fibonacci level and possibly retest this important level.
A similar scenario occurred last year during a similar phase of prolonged correction, where the price eventually reached the 0.5 Fibonacci level, though not immediately.
Economic Cycles

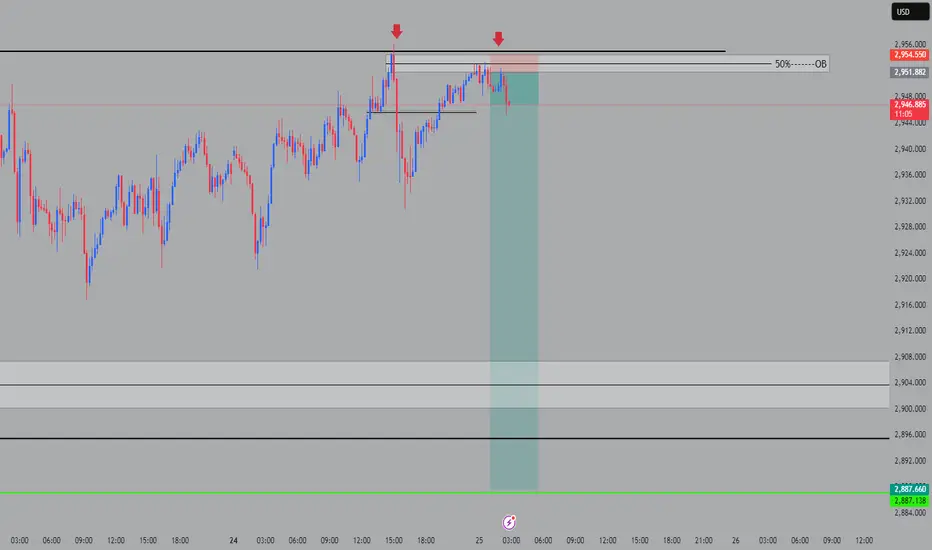
BTC dips below 91K – expected move within my frameworkBTC dips below 91K – expected move within my framework
This was a logical step in my theory. What’s 100% certain for me is that today and this week will be absolutely crucial. If BTC has gathered enough strength here to push above 100K, we’re in the game.
Here’s what I wrote on Discord about 10 days ago 👇👇
"BTC can only build momentum from lower levels. If it drops to 95K, it can bounce to 97K. If it hits 94K, it can reclaim 98K. And if it goes as low as 91K, I’d expect a strong enough push to send it flying anywhere."
I know this sounds rough, but it’s all part of the game. If you check the "from->to" moves, it’s clear on the chart where the bounces happened.
The chart illustrates it: green arrows mark the accumulation zones, red arrows show how high BTC managed to go, and the dotted red line represents the key 100K level.
🚀 Will we take off, or is this just another falling leaf?

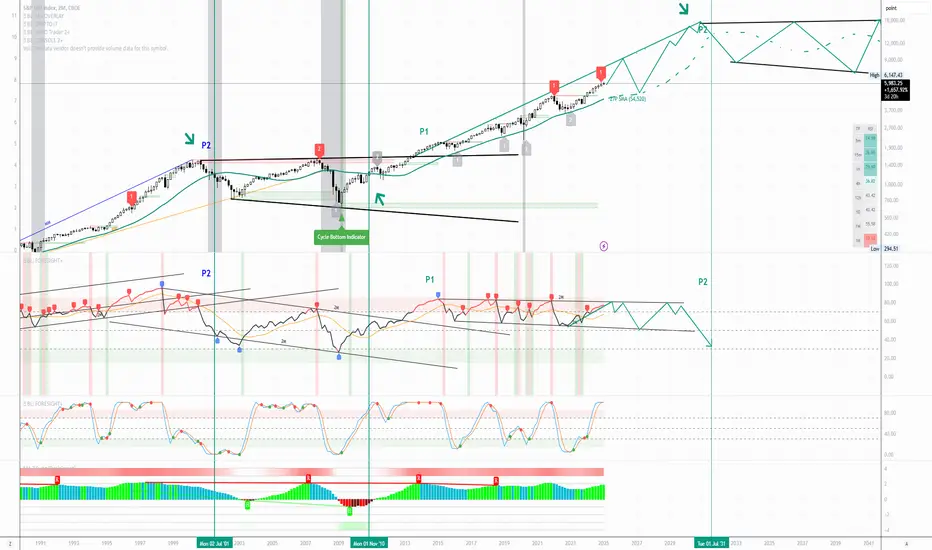
S&P500 | Historic Trends, Consolidation & Bull Flags [2030 END]I have been wanting to put my thoughts on the historic tends observed in the S&P500 in a post for some time and decided to focus this discussion on the relationship observed between S&P 500:
* Bull Flag runs (~17 to 25) years in length
* Consolidation Period (~13 to 15) years in length
* 27 Period (2 Monthly) SMA - Aqua Colored Line
* RSI
NOTE: Chart is looking at logarithmic price of the S&P500 on the 2 Monthly time period.
S&P 500 HISTORY | 27P(2M) SMA, CONSOLIDATION PERIOD & BULL FLAG RUNS SINCE 1943
The below images show 'Consolidation Periods' governed by 'Black Trend Lines', 'Bull Flags' (Orange / Navy / Aqua) governed by colored measured moves between these periods and the 27P(2M) SMA in Aqua.
Key Takeaways for Longterm Investors
Key take aways Looking at the S&P 500 from such a zoomed-out perspective:
* CONSOLIDATION: Periods of consolidation required investors to proactively manage their investment. A buy and hold approach left investors' money in limbo not doing a lot over these time periods. Investors who could identify the S&P was in a period of consolidation did well by selling at the upper and buying at the lower trend lines once they became apparent.
* BULL FLAG: Run periods rewarded the discipline 'Dimond hands' investor, providing key holds at the 27P(2M) SMA and future higher highs. A good strategy during these periods was to accumulate at the 27P(2M) SMA.
RSI ANALYSIS
As we are currently in a Bull Flag period for the S&P500 (Aqua Measured Moved), lets now look at the relationship between the RSI and price to identify key historic behavior which may be useful with current price behavior.
It is notable that historically the RSI tends to oscillate between rising and falling channels when exhibiting price Consolidation / Bull Flag price behavior.
Bull Flag (1943 to 1968) – 25 years
Focusing on the orange measured move or first Bull Flag period from approximately 1943 to 1968, observable characteristics include:
* At the consolidation period price break out, RSI continued to set higher highs until peaking (with the first lower high) at Point 1 - this marked approximately the halfway point of the bull run period.
* Retest and hold behavior with the 27P(2M) SMA for the entirety of the run
* End of bull run period and start of consolidation period confirmed with price breaking below and first candle open and close below the 27P(2M) SMA at Point 2 .
The Stochastic RSI has helped to identify if price is set to put in a higher low during bull flag periods and has been a reliable indicator in confluence with the 27P(2M) SMA.
Consolidation Period (1968 to 1983) – 15 Years
Consolidation period starts at the end of the prior bull flag and confirmed at Point 2 where price has broken below and opened and closed the first candle below the 27P(2M) SMA. This has been marked with the aqua vertical line on the chart.
Price is confirmed to have left the consolidation zone once it breaks to the upside of the black trend line (in some cases with a retest).
Change in price behavior from ranging to bullish within the consolidation period has been identifiable historically with a break above the 27P(2M) SMA followed up by a retest and holding the 27P(2M) SMA as support. Price has tended to range between the consolidation period trendlines until this price behavior is achieved.
The Stochastic RSI has helped to identify if price is set to put in a low during consolidation periods and has been a reliable indicator in confluence with the lower black trend line.
It is notable the Momentum Bias Index has printed RED bars on the histogram during all historic consolidation periods reviewed (2 in total) when the bottom of the consolidation period has been set.
Similar observations have been observed in the below two future consecutive Macro Bull Flag and Consolidation periods reviewed in this analysis.
Bull Flag (1983 to 2000) – 17 years
Consolidation Period (2000 to 2013) – 13 years
CURRENT PERIOD | WHERE ARE WE NOW? BULL FLAG TO FINISH IN 2030 ESTIMATION?
If the S&P 500 is to continue historic trend and continue consecutive Bull Flag / Consolidation periods, this would suggest the current bull flag run could end in 2030 and the next consolidation period would begin. This is based on the same bull flag measured move approach and estimations of the bull flag structures discussed in the prior bull flag / consolidation periods.
It is noted that the prior consolidation period (2000 to 2013) left this zone and peaked at the RSI high relatively early compared to prior periods. According to the review of other bull flags this suggests the middle part of the bull flag run occurred in 2015. It is unclear if this would result in a reduced bull flag period run and a material lower high than the measured moved.
It is also noted at current prices a retest and hold of the 27P (2M) SMA would result in a 30% drop. A move in the market of this magnitude would result in some interesting news headlines but historically would show nothing out of the ordinary for S&P500 price behaviour.
GOLD SELL market will be reversall sellGOLD SELL market will be reversall
Gold price edges lower during the Asian session on Tuesday and erodes a part of the overnight move up to a fresh all-time peak. A further USD recovery from its lowest level since December 10 prompts profit-taking around the XAU/USD amid slightly overbought conditions.
Republican bear cycle / QELong-term sell-off in expectation of the Trump administration's projected monetary policies. In addition, on a technical aspect, the inefficiencies of the last DXY drop in Nov. 2022 are filled. The entry is given by the change in the daily structure after filling the aforementioned inefficiency. The target is looking for liquidity at the low of Jul. 23', coinciding at the 61.8 fibo of the bullish momentum of the Democratic Biden administration.

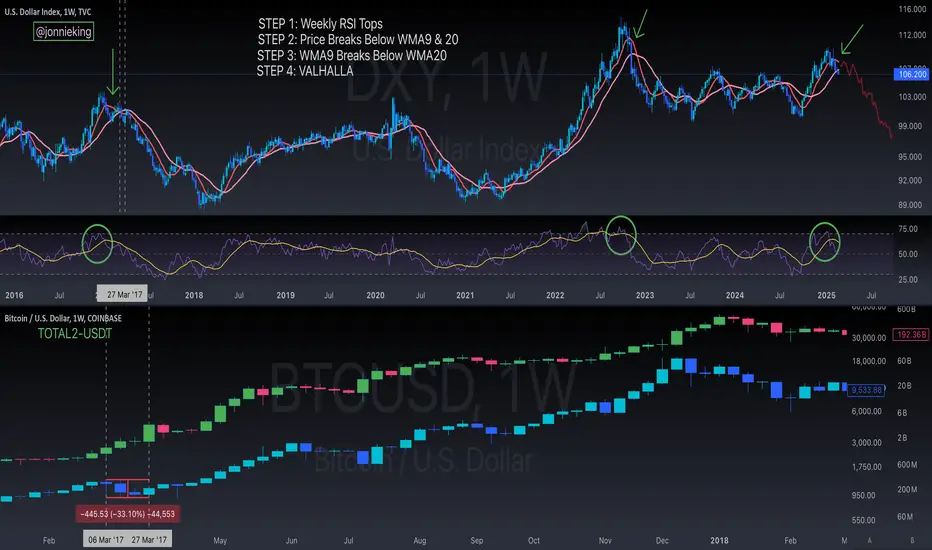
DXY Falling Below $106 - Cue AltSeason in March!The biggest shock to everyone is going to be the price of CRYPTOCAP:BTC going DOWN while ALTS skyrocket 🚀
As I have discussed in my macro thesis, the TVC:DXY is FINALLY breaking down on the Weekly along with the 10Y.
RSI has topped and Price broke below the WMA9 & 20.
Just waiting on the WMA9 to break below the WMA20 for final confirmation.
Historically when this happens...
it’s ALTSEASON BABY!!! 🥳
After this happened in March 2017,
BTC and ALTS pumped together,
then BTC went down 33% while ALTS exploded higher over a 3 week period before BTC rallied alongside again.
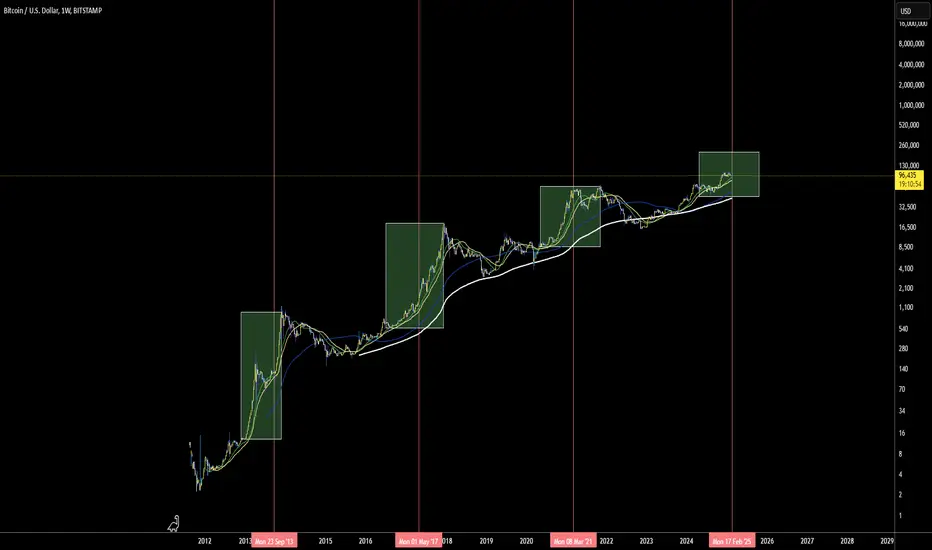
BTC Bull Run OverviewLook at where we are compared to other bull runs. Each red line shows where we are in the current bull run (301 days from BTC Halvening).
Could we see a repeat of 2013 and 2017, or will it play out more like 2021 🤔
Definitely resembles 2017 the most 👀
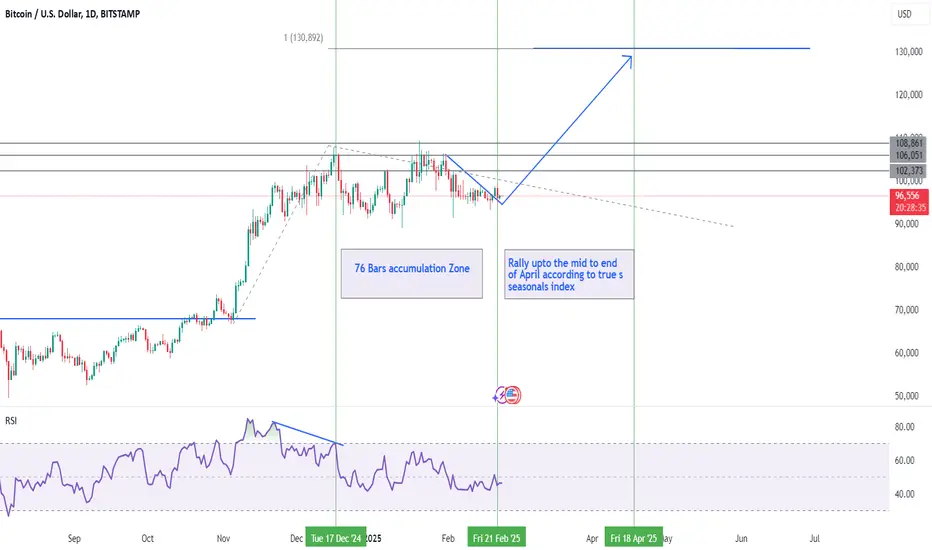
BTC Seasonal Bullish PatternAccording to seasonality BTC usually had rallies from FEB to mid or end of APRIL. So if price breaks the resistance of resistance of 103,000 then a massive rally lasting up to mid April can be expected.
Price Targets :
Key resistance Areas to Watch
103,000 and 108,000
Rally Price targets:
According to the fib extension of last rally and LH. if price goes to 1.3 fib extension then we can see the rally up to 130,000 price levels and can briefly exceed above it.
SPX: Long-Term Fibonacci ChannelsAfter encountering old chart, I though to redefine some coordinates.
It played out well, however I would like to experiment using actual chart-based extremes to predefine levels.
Measuring historic market's most significant HH & LL with fibonacci channels to project psychological levels into the future. Logarithmic scale is a must for this type of analysis.
Fibonacci Channels:
Using bottoms for direction: Oct '74 & Mar '09 (complete cycles); 3rd point mapping extreme Mar '00 Top for a range.
Direction: Mar '09 bottom & Covid bottom; relating to Jan '22 top to define more relevant range.
Using multiple Fibonacci channels enhances trend analysis by providing a broader perspective on price movements. This approach identifies key price levels, confluence zones, and trend strength more effectively. However, it’s important to avoid overcomplicating the chart by focusing on the most relevant channels that align with the overall market direction.
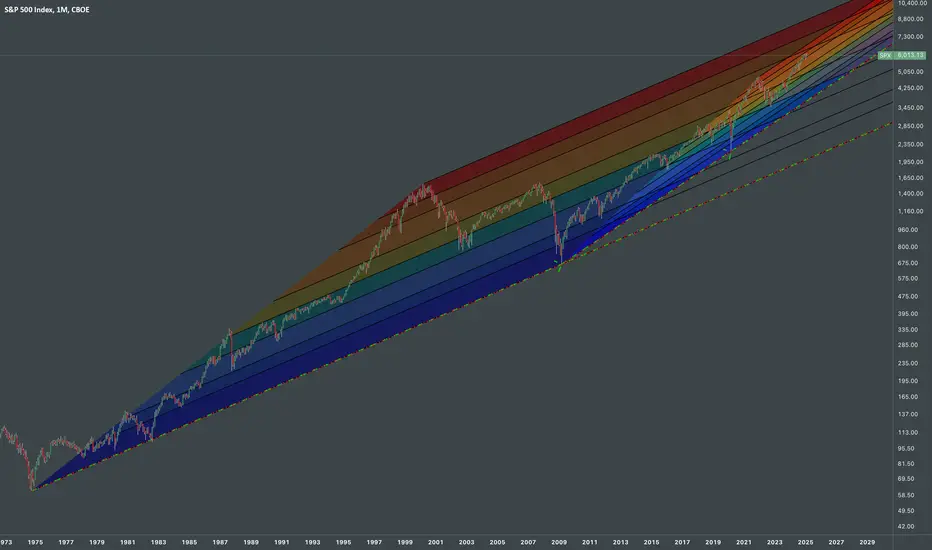
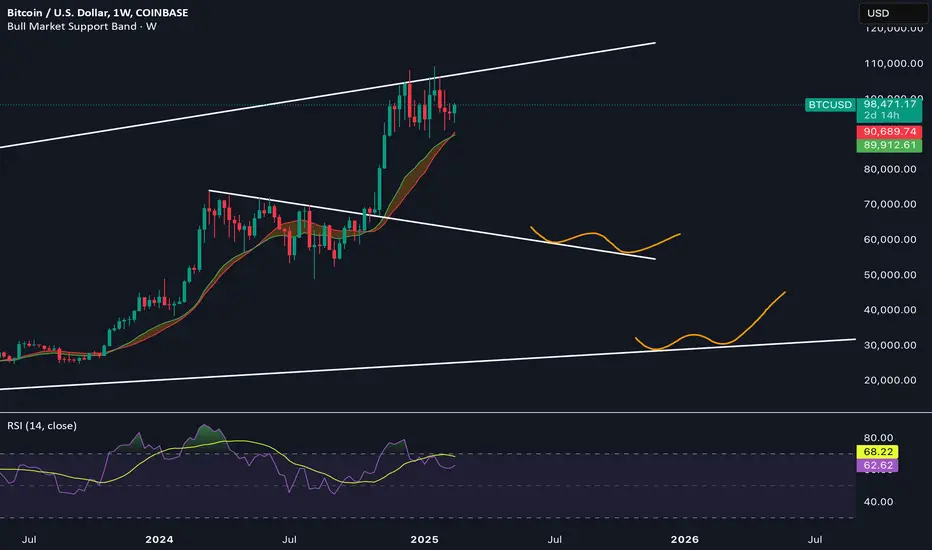
Chart looks identical to May 2021...may be in for some hurtJust a simple low IQ comparison. Looking at the weekly circa May 2021 looks identical to what we're seeing today. Drew the same pattern in red and a bull case in case we still see a new high with the 4 year cycle, but it's looking bleak. We're getting close to completing another weekly cycle and should expect the new low within the next 2 candles. Question is, are we about to retrace 55% like May 2021, or continue the bull run into a new high later this year?

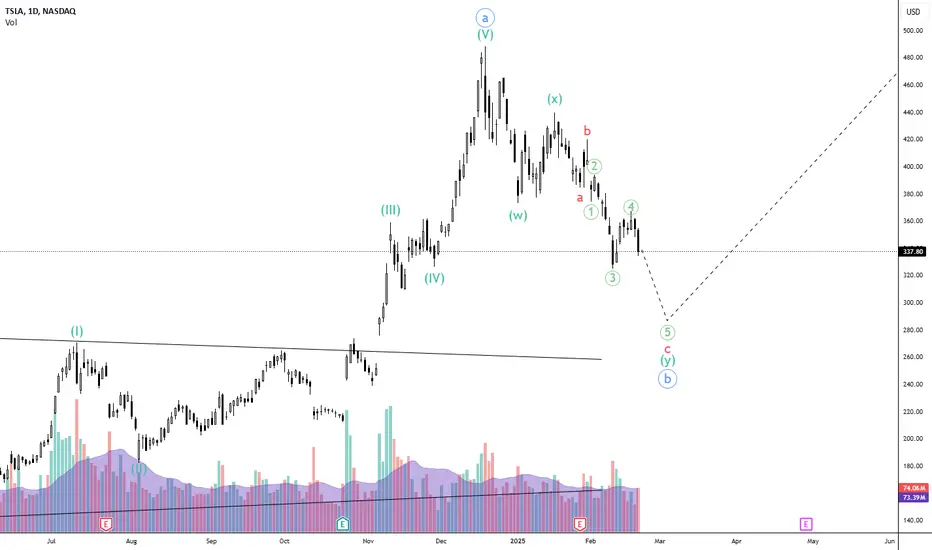
TSLA Harmonic Elliott Wave and Hurst's Cyclic AnalysisI view the move from April to December 2024 as wave A of 3. Since then, we have been in wave B of 3, forming a double zigzag correction. Currently, we are in the final stages of completing this correction and preparing for a strong bullish move as wave C of 3.
To estimate the bottom, we analyze the retracement of wave A of 3. A 0.586 retracement suggests a level of 285, while a 0.618 retracement points to 274.
From a cycle perspective, the April 2024 trough marked an 18-month cycle low. We are now nearing the completion of the first 40-week cycle within this 18-month cycle, with the trough expected in the first week of March.
Weekly Edge – End of Week 08, Prepping for Week 09 Market Overview
Quarterly Chart
- Bullish momentum continues into Q1 2025, printing new highs above Q4 2024 levels.
- Six consecutive quarters of higher highs and higher lows reflect sustained bullish momentum.
Monthly Chart
- Breakout from a short consolidation phase, with January closing above December and November highs.
- Price has broken above the recent swing high near 2780.
- An imbalance just below 2780 could serve as a point of interest (POI) for potential long continuations.
Weekly Chart
- Bullish momentum continues, with higher highs and higher lows since January 2025.
- Price has traded above the previous intermediate-term high (ITH) at 2790 and the psychological level of 2800.
- Recent weekly candles closed within the previous week’s range, signaling a potential slowdown in momentum.
Daily Chart Analysis
- Consolidation range between 2940 (high) and 2860 (low).
- Price tested highs near 2955 but stalled around the ITH at 2942.
- Strong rejection on Friday’s retest of Week 7’s Friday close suggests a valid POI for potential long continuations.
Trade Setup & Execution
Long-Term Bias
- Bullish momentum remains strong on higher timeframes, favoring long continuations
Short-Term Bias
- Shorts are valid for potential reversals from current highs, targeting the range low near 2860.
Trade Updates
- Short entry on Wednesday based on a lower-timeframe reversal signal, exited with a small loss.
- Re-entered short on Friday after observing another reversal signal.
Key Observations & Strategy for Week 09
- Stick to the plan and focus on execution without improvisation.
- No attachment to trades—exit and reassess if invalidated.
- Define a clear plan, execute it, and reassess post-trade.
- Avoid mid-trade discretionary changes to ensure consistent outcomes.
Final Thought
The market moves on its own terms. Consistent execution and learning from each trade will provide an edge over time.
#XAUUSD #Gold #TradingView #MarketAnalysis #PriceAction #WeeklyEdge #PipsnPaper

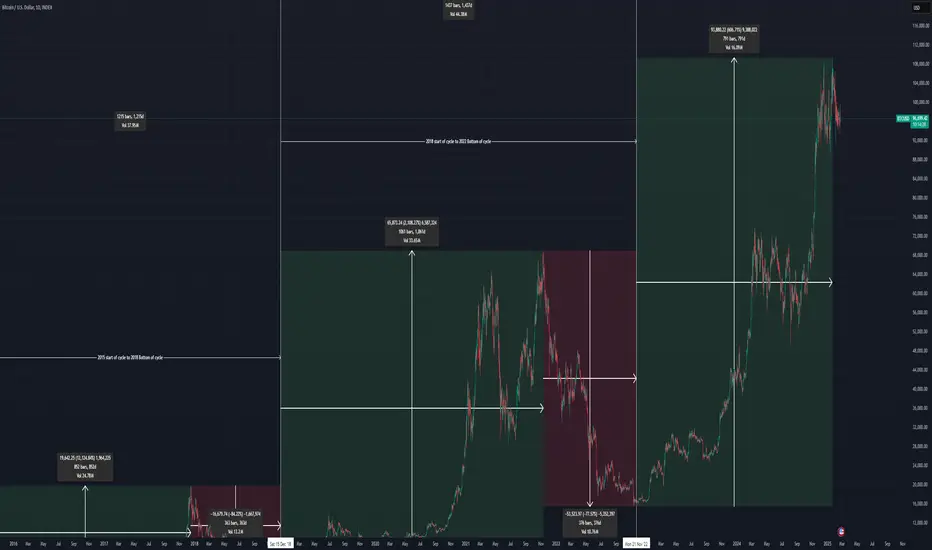
The B-History of Bitcoin (BTC)Chart Breakdown:
Bull Market Phase (Green Section)
Measures the time taken from the cycle bottom to the peak.
Displays the percentage gain from the lowest point of the cycle to the highest.
Shows the number of bars (days) it took for the market to reach its peak.
Bear Market Phase (Red Section)
Highlights the correction from the peak back down to the next cycle bottom.
Shows the percentage decline and the time taken for the market to complete its downward trend.
Includes volume metrics to provide insight into trading activity.
Full Market Cycle (Entire Duration)
Captures the entire period from the start of the previous bull market, through the peak, and back to the bear market bottom.
Displays the total number of days for a complete market cycle.
Helps to visualize how Bitcoin's market cycles repeat over time.
The chart offers a clear perspective on Bitcoin's historical price movements, emphasizing cycle duration and price trends, making it a useful tool for analyzing past patterns and potential future cycles.
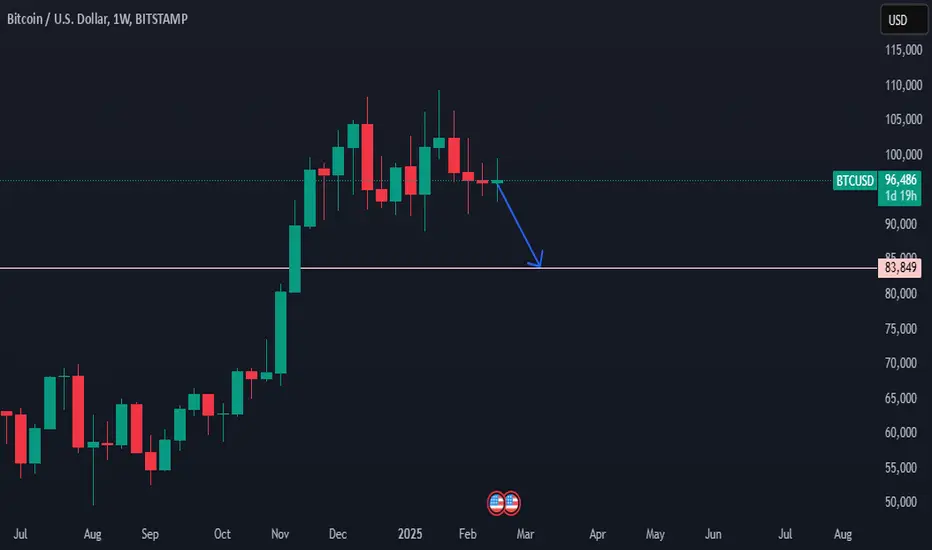
Bitcoin correctionIn the weekly and daily time frames,
From a technical analysis perspective, the previous ceiling will not be broken at all. As long as the price touches (at least) 83,800
The Daily Edge - 21st Feb 2025Bullish Momentum Stalls as Shorts Remain in Focus
Market Overview
Bullish price action continued on Thursday, with the daily candle printing a higher high and higher low range. Price closed above the previous bearish candles, maintaining the overall bullish structure.
However, price remains within the consolidation range, with highs near 2940 and lows around 2860. The short bias remains intact, and we are actively managing short trades currently in play.
Key Observations
Price reacted off the imbalance High 2920 today created by the recent push higher, moving from external to internal range liquidity.
Price is stalling around key levels despite maintaining a bullish structure.
The 50% retracement level of the latest daily swing sits below Friday’s low 2915
Shorts remain active but are at risk as bullish momentum continues within the range.
Our Next Steps
Manage existing shorts and monitor for signs of reversal or continuation.
Watch consolidation boundaries at 2940 highs and 2860 lows for breakout or reversal signals.
Observe price action leading into Monday for potential adjustments to the strategy.
Reflection Prompt
How can managing trades within a consolidation help refine entries and exits, especially when price action begins to stall?
#XAUUSD #Gold #TradingEdge #MarketAnalysis #PriceAction #Discipline #PipsnPaper

TSLA Short - IntradayWith bearish indices, and displacement in TSLA on H4 time frame the narrative was bearish sentiment from that point of interest. As soon as I saw rejection from the POI, I waited for confirmation of my setup in the 15m and entry on the 5m, with 1: 3.3 risk to reward. The RR target was based on the sell stops resting below creating liquidity with Previous Day Low and Sellside Liquidity.

LINK | Wyckoff Method | Phase 3 IMPULSE WAVELINK shows a very clear Wyckoff Method Cycle from the macro timeframe:
This is typically what a Wyckoff Method cycle looks like from a macro perspective:
When we look at Chainlink from the macro and compare it to the previous cycle, it seems likely that LINK goes up in "impulse waves". We now have Wave 3 to look forward to, which may likely play out over a few months - as did the previous cycle.
________________
COINBASE:LINKUSD

[ TimeLine ] Gold 12-13 February 2025Hello everyone,
I will be using the high and low price levels formed on the following dates as entry points for my trades:
February 12-13, 2025
and/or
February 12, 2025
We will wait for the price range from these candles to form as indicated with blue box. The trade entry will be triggered if the price breaks out of this range, with an additional buffer of 40-50 pips.
If the price moves against the initial position and hits the stop loss (SL), we will cut or switch the trade accordingly.

Bitcoin Bear Market LevelsIn the following chart you can see where I predict the Bitcoin price will fall to during our next bear market - around $60k and lower around $30K.
$60K is also about the average buying price of MicroStrategy now called Strategy.
This levels also need to go in confluence with the weekly RSI and better two week RSI. If the weekly RSI is oversold, I will start deploying my stables into BTC.
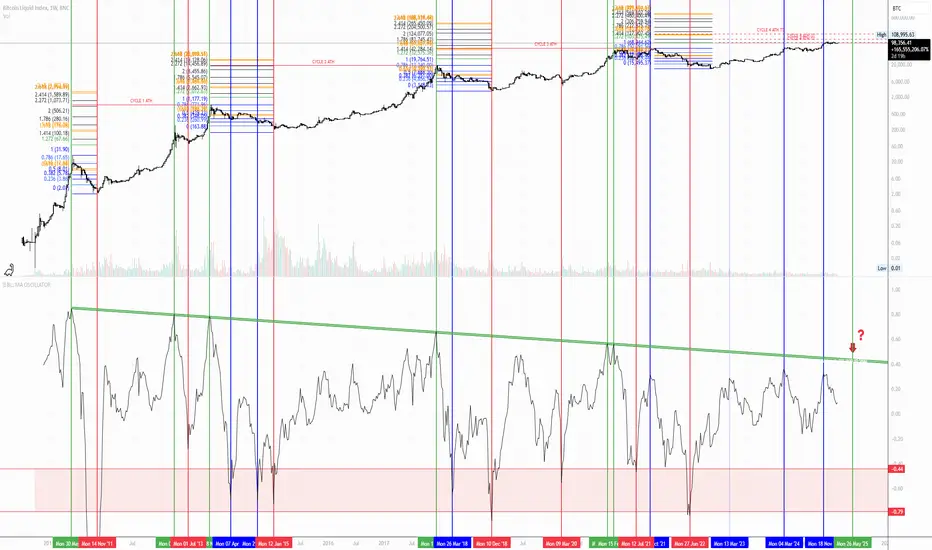
CYCLE 4 | Price %Change Extension from 20W SMABTC PRICE %Δ EXTENSION FROM 20W SMA ANALYSIS
Similar to previous Analysis looking at 'Price %Change Extensions' from moving averages (see links below), we take a look at the respective relationship BTC has held with the 20W SMA over its existence.
HISTORICAL BEHAVIOUR
Observable in Prior cycles BTC has topped and bottom out at High Points and Low Point of this relationship. We can see over cycle periods the highs are sloping downward (indicating ATH of future cycles diminishing in nature is historically in line with this relationship). This is observable via the downward sloping green zone connecting cycle peaks in the BTC Price %Δ Extension from 20W SMA.
For cycle bottoms (excluding the bloodbath of cycle 0), generally we see these occur ~around the 80% Price %Δ Extension region (see the red box below).
CYCLE 3 VARIATIONS | THIS TIME WAS DIFFERENT
It is notable that Cycle 3 was the first cycle where the high and low in this relationship occurred before the price All Time Low and High of Cycle 3, and in this instance the indicator displayed more divergent behavior (suggesting price momentum is reversing) with spikes of a lower high and higher low of this relationship indicating cycle 3 ATH and ATL.
CYCLE 4 ATH TAKEAWAYS
* A revisit of the Green Zone has historically coincided with a significant top or cycle ATH with prior price cycles.
* If Cycle 3 behavior is the new norm, then a revisit of the green area may indicate price momentum reversal. This divergent behavior indicated BTC was setting the final ATH for cycle 3.
* Either scenarios may play out again in Cycle 4 and may be a usual relationship to use with confluence of other relationships to identify Price / Market timing to take final profits.
See Relevant Previous Posts Below
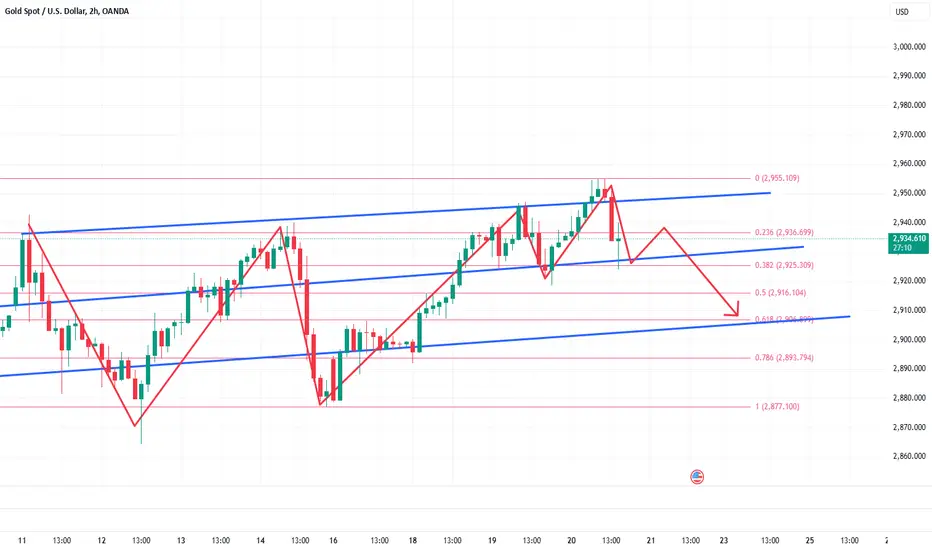
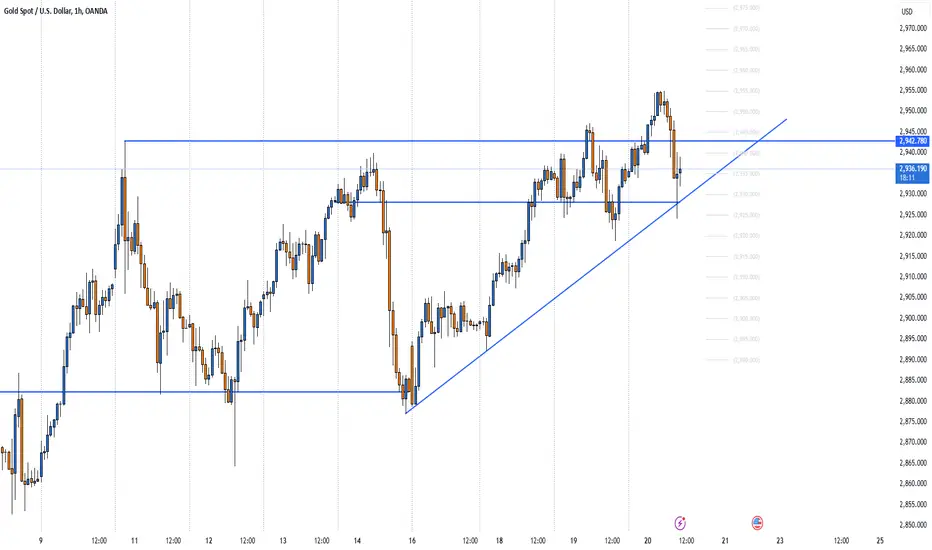
Short gold againAs I mentioned in my previous article, I anticipated that gold might pull back to the 2930-2925 region, or even extend to the 2910 region, during today or tomorrow's New York trading session. Clearly, gold has retraced as expected and hit my target zone of 2930-2925. Our short position around 2954 has once again yielded a very favorable profit, totaling 270 pips.
Currently, gold has experienced a slight rebound, but it’s evident that the bullish momentum is weakening while bearish control is strengthening. After the accelerated short squeeze phase, 2955 may become the high for this stage. Moreover, as geopolitical risks decrease, the bullish momentum for gold further weakens, making it likely that gold could further dip and test the 2920-2910 support zone.
Therefore, for current short-term trading, I believe it might be a good idea to consider shorting gold again in the 2935-2940 region.Bros, will you follow me and short gold again? If you want to learn more detailed trading ideas and get more trading signals, you can choose to join the channel at the bottom of the article to make trading no longer difficult and make making money a pleasure!
The Daily Edge - 20th Feb 2025Indecision at Previous ATH as Shorts Remain in Focus
Market Overview
Wednesday’s daily candle printed a doji, testing the previous ATH and 2940 consolidation high.
Entered shorts at these levels, took an initial loss, but considering re-engagement today.
While this goes against the Monthly and Weekly trends, the Daily timeframe shows indecision, reinforcing a short bias for now.
Key Observations
Daily doji signals indecision – price failed to break convincingly above 2940.
4H remains bullish – trend strength contradicts daily indecision.
POI for longs at 2920 – bullish close above Friday’s bearish PA suggests support below Wednesday’s low.
Shorts remain in focus – targeting 2865 but will re-evaluate if invalidated.
Our Next Steps
Manage short positions, watching for reaction toward 2865.
Remain flexible – exit shorts if structure shifts, reassess for re-entry.
Monitor 4H structure & POI at 2920 – if price finds support, consider a shift to longs.
Reflection Prompt
How do you balance short-term trade setups with higher timeframe trends while managing risk effectively?
#XAUUSD #Gold #TradingView #MarketAnalysis #PriceAction #PipsnPaper
Daily Retracement Into HL - High Risk LTF Sell SetupDaily Retracement Into HL
Sell Setup as High Risk Trade
Setup Explanation:
- HH Formation Confirmed with
- LTF Bearish BOS
- POI Above 50% Zone(Sellers Control)
- Imbalance still need to be mitigated
