Altseason 2025 - Wave 3Bitcoin is approaching its next destination between $125K and $250K, and that means its time to shift focus to altcoins. We’re not in full-blown altseason yet, but the foundations are forming. BTC dominance needs to drop fast, that’s the key trigger. Once it does, the rotation into alts could accelerate quickly.
Favorites so far this cycle:
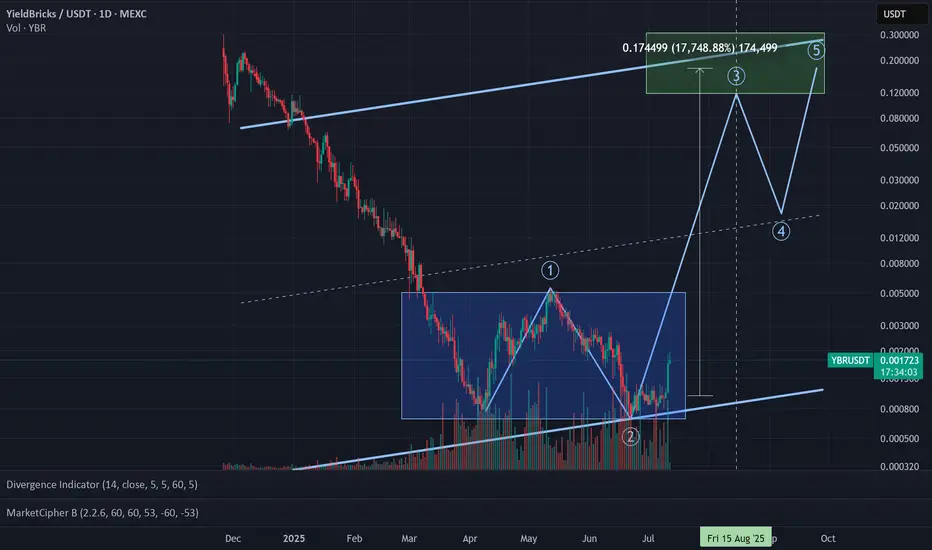
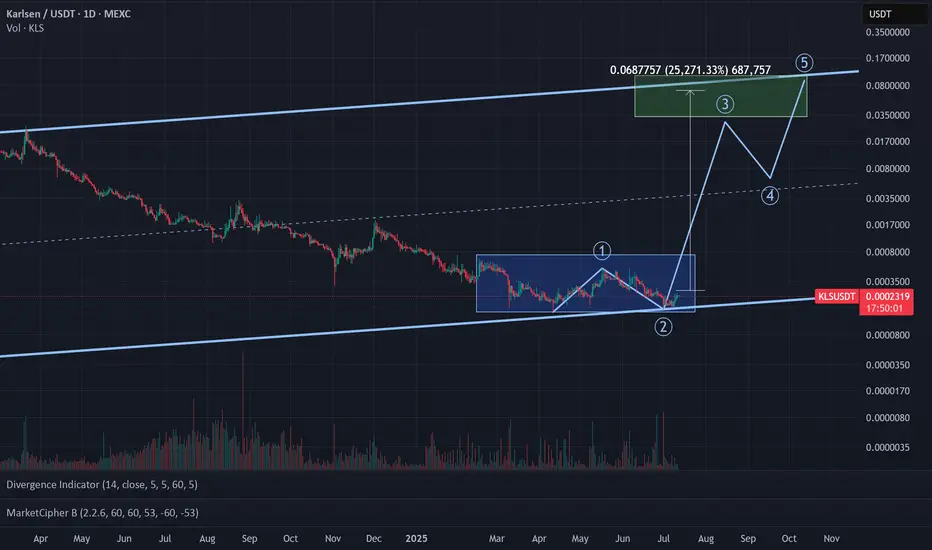
🥑 POLONIEX:GUACUSDT 🧱 MEXC:YBRUSDT ⛏️ MEXC:KLSUSDT
🌐 HTX:SYNTUSDT 🧪 MEXC:DEAIUSDT *⃣ MEXC:SAIUSDT
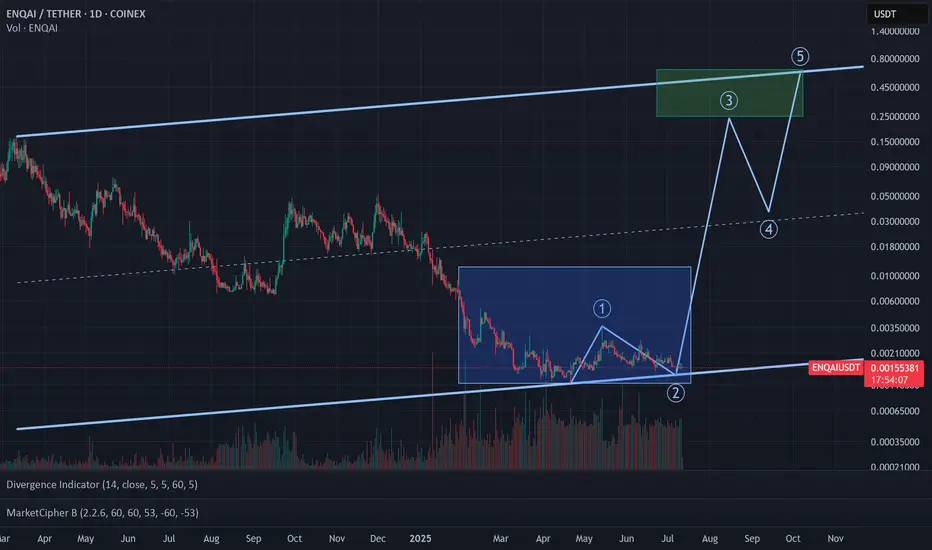
🔗 POLONIEX:LLUSDT 🎮 KUCOIN:MYRIAUSDT 🤖 COINEX:ENQAIUSDT
Economic Cycles
Altseason 2025 - Wave 3Bitcoin is approaching its next destination between $125K and $250K, and that means its time to shift focus to altcoins. We’re not in full-blown altseason yet, but the foundations are forming. BTC dominance needs to drop fast, that’s the key trigger. Once it does, the rotation into alts could accelerate quickly.
Favorites so far this cycle:
🥑 GUACUSDT 🧱 YBRUSDT ⛏️ KLSUSDT
🌐 SYNTUSDT 🧪 DEAIUSDT *⃣ SAIUSDT
🔗 LLUSDT 🎮 MYRIAUSDT 🤖 ENQAIUSDT
Altseason 2025 - Wave 3Bitcoin is approaching its next destination between $125K and $250K, and that means its time to shift focus to altcoins. We’re not in full-blown altseason yet, but the foundations are forming. BTC dominance needs to drop fast, that’s the key trigger. Once it does, the rotation into alts could accelerate quickly.
Favorites so far this cycle:
🥑 GUAC/USDT 🧱 YBR/USDT ⛏️ KLS/USDT
🌐 SYNT/USDT 🧪 DEAI/USDT *⃣ SAI/USDT
🔗 LL/USDT 🎮 MYRIA/USDT 🤖 ENQAI/USDT
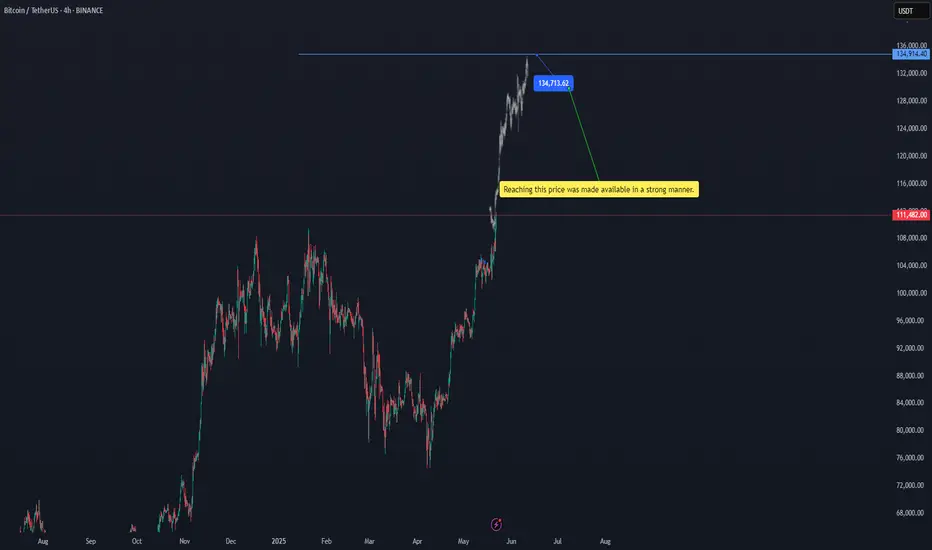
btcusdtReaching this price was made available in a strong manner. 134713.16$ BINANCE:BTCUSDT
Of course, there is a possibility of a temporary correction at the current price, but the target is $134,713.
#btc
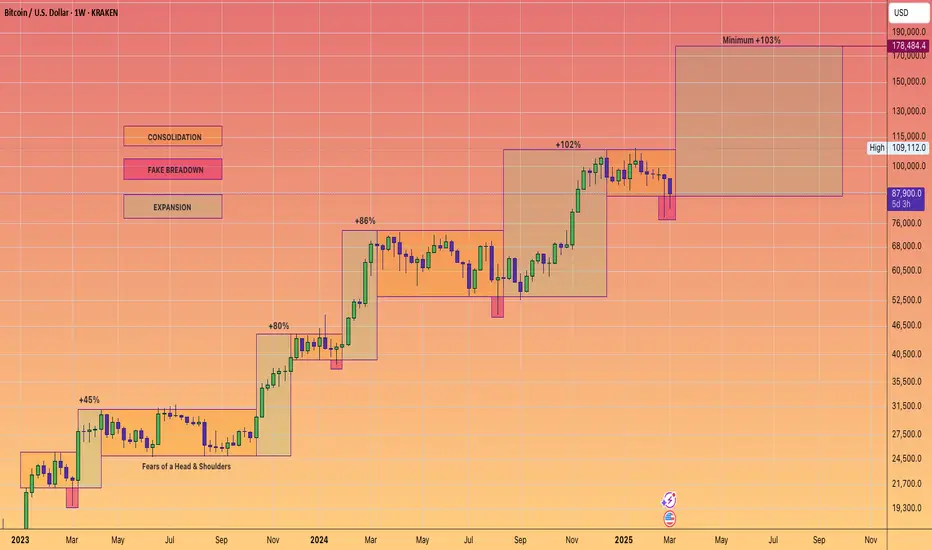
BITCOIN's PUMPs are Getting LARGER this Bull Market...However, it may take a bit longer to realize those expansionary moves.
If Bitcoin adheres to the established cycle pattern, we can anticipate a minimum surge of 103% that should carry us into the fourth quarter of this year.
Consolidation ----> Fake breakdown ----> then expansion.
Are you ready?
ETH Wyckoff Re-AccumulationETH (and many of the major altcoins) has a macro re-accumulation going on right now. The targets would be well beyond our current all-time highs. There has been a lot of bullish news recently with large investors buying heavily into ETH, which should act as a catalyst to jump-start the mark-up phase of this re-accumulation and "Jump Across the Creek" as they say.

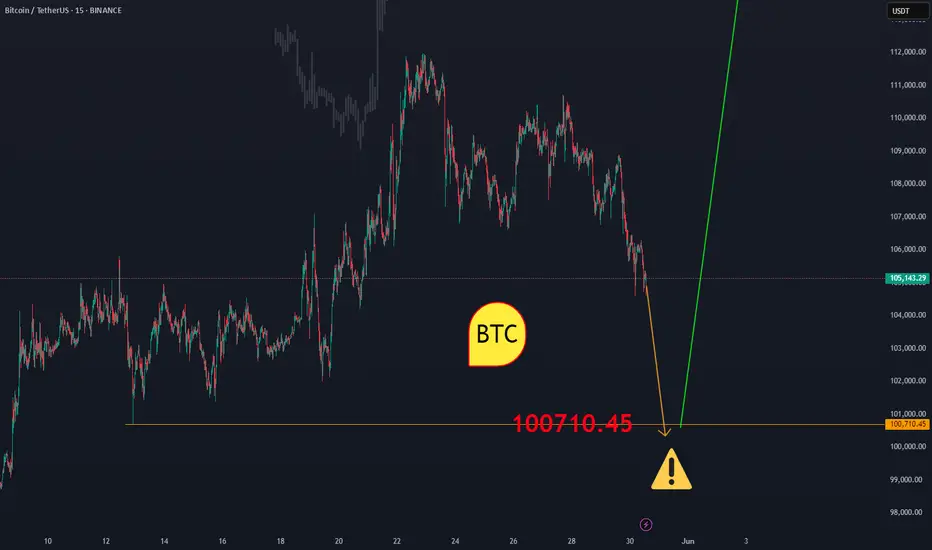
BTCUSDTBitcoin may be looking to complete the downward correction from the $101,000 price range to $99,000 and then begin a long-term upward trend. Pay close attention to the extent of the correction and don't give in to fear or greed.
In any case, it should go to $1300,000.
BINANCE:BTCUSDT
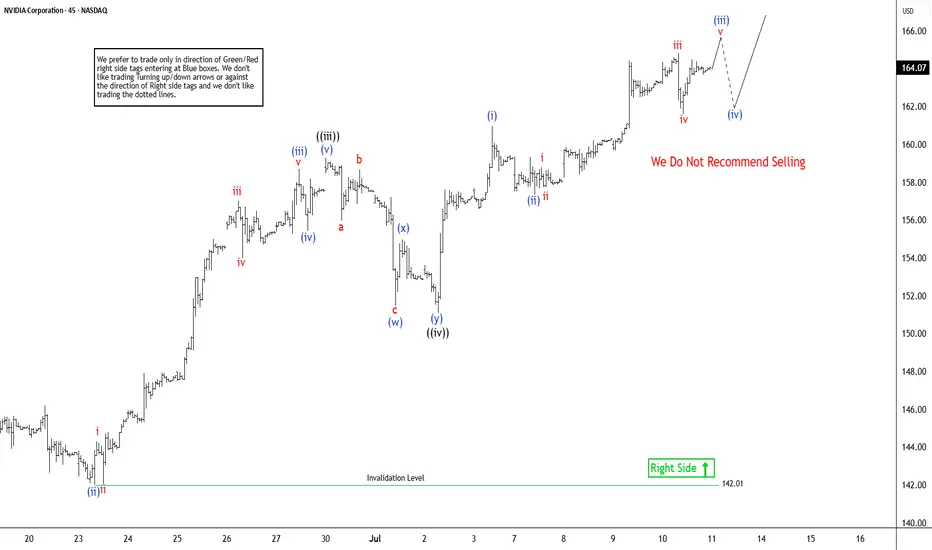
NVIDIA ($NVDA) Elliott Wave Outlook: Larger Pullback on the HoriNvidia (NVDA) continues its remarkable ascent, consistently reaching new all-time highs and reinforcing a robust bullish outlook. The ongoing rally, which began from a significant low on April 7, 2025, remains structured as an impulsive wave pattern, indicative of strong upward momentum. However, despite the potential for further short-term gains, the cycle appears mature. This suggests a larger-degree pullback could be imminent. Investors should exercise caution when considering chasing this rally in shorter time frames, as the risk of a corrective move grows.
In the short term, the cycle initiated from the June 2 low is progressing as a lower-degree impulse. From this low, wave ((i)) peaked at $144, followed by a corrective pullback in wave ((ii)) that concluded at $137.88. The stock then surged in wave ((iii)) to $159.42. The subsequent wave ((iv)) correction unfolded as a double-three structure, with wave (w) ending at $151.49, wave (x) at $154.98, and wave (y) completing at $151.10, finalizing wave ((iv)). Currently, Nvidia is advancing in wave ((v)), exhibiting a five-wave subdivision. Within this, wave (i) of ((v)) reached $160.98, with a minor pullback in wave (ii) concluding at $157.34. As long as the pivotal low at $142.01 holds, any near-term pullbacks are likely to attract buyers in a 3, 7, or 11-swing pattern, supporting further upside potential. This technical setup underscores Nvidia’s strength but highlights the need for prudent risk management.
#Bitcoin 3 Phases Theory 🚦Today I saw a headline that surprised me "The current bear market has become the longest in the history of the crypto industry"📰
And I had a question about whether they were living in the past, or where they saw the bear market.🤔
💡I want to remind you that it ended with a duration of exactly one year, just like the last cycle. And it was much shorter than in 2014.
Now CRYPTOCAP:BTC is +70% from the bottom, this is a classic phase of accumulation.

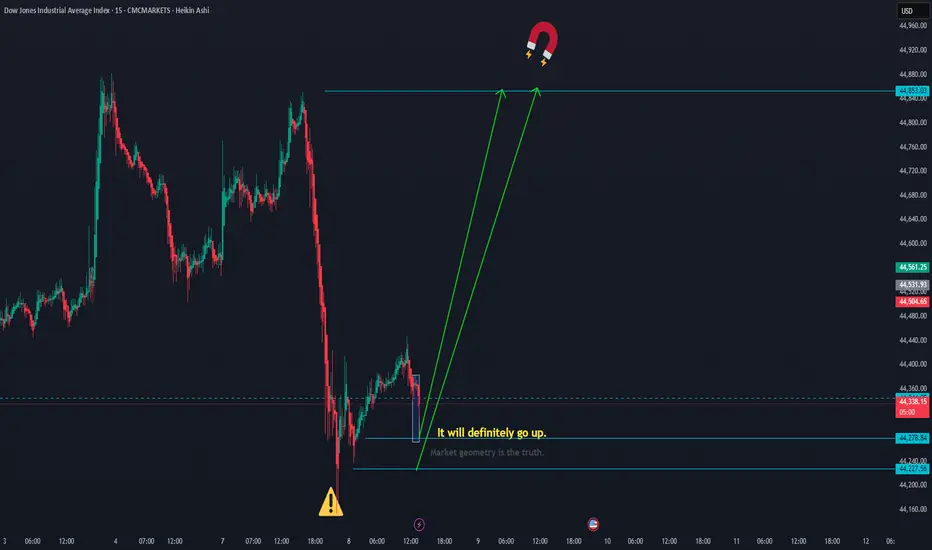
The dowjones should move upThe Dow Jones should move up to 44,853.
The levels 44,278.84 and 44,227.56 are good potential points for a bullish reversal. CMCMARKETS:US30
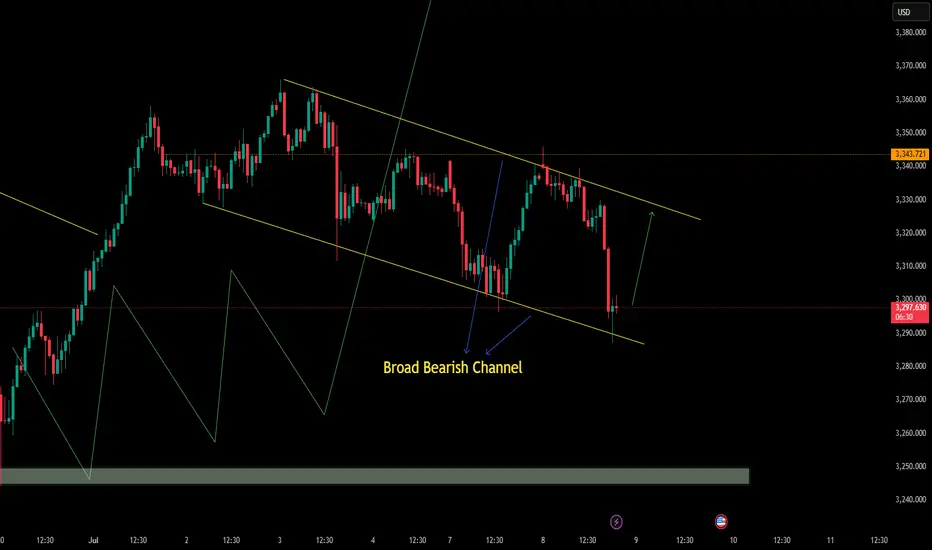
The price is climbing toward the top of the channel.OANDA:XAUUSD
We are currently in a wide descending channel on the 1-hour timeframe, and a potential move upward toward the top of the channel is expected.
Note: Our previous analysis on gold (XAUUSD) remains valid and intact.
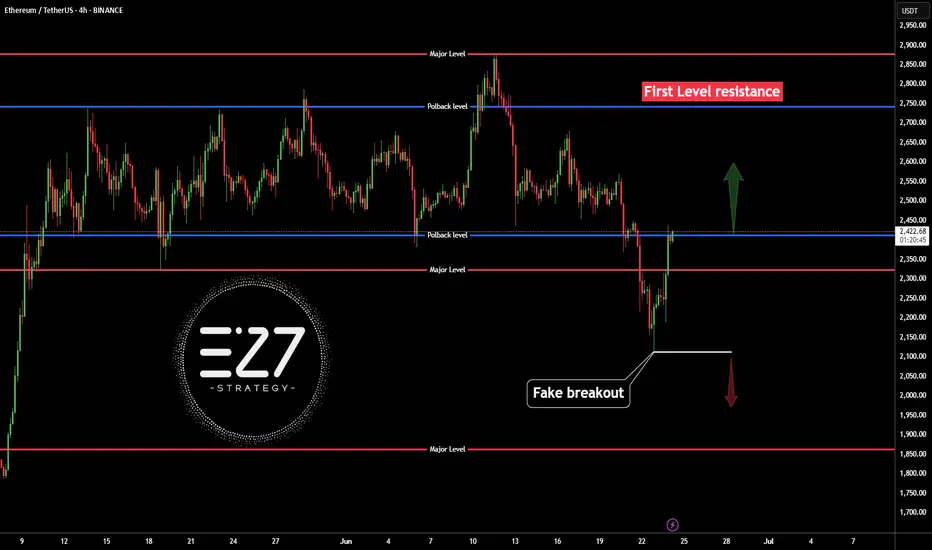
ETHUSDTThis is very easy...
best support level 2300 to 2500 for jump price. but was needed for jump price for get enrgy for movement to high levels by fake breakout.
First level of resistance 2800 to 3000.
⚠️Control Money Management in your capital.
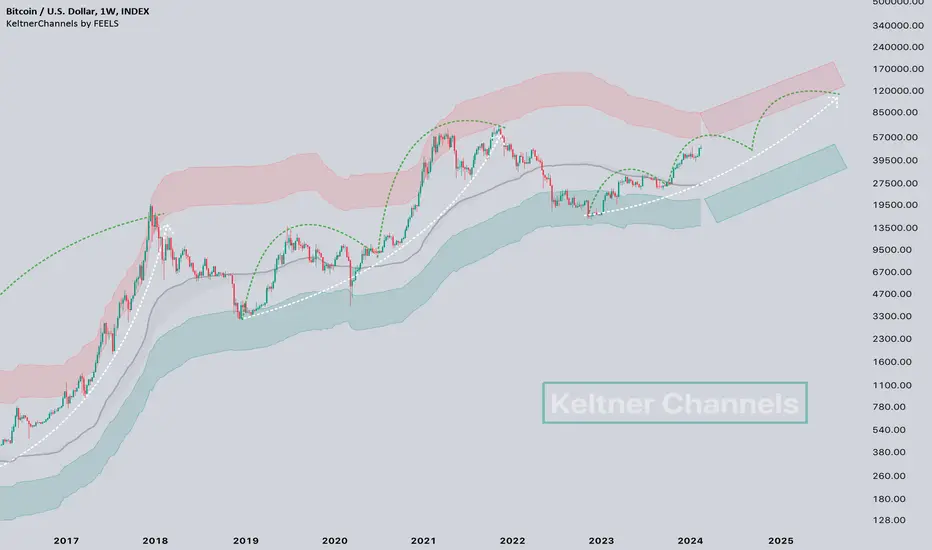
Are we in for a 3-wave cycle in BTC? 👀#Bitcoin Keltner Channels 📈
The current BTC cycle is often compared to the cycle of 2020 or 2016. Well, let's consider what if this cycle is different.
In the first cycle, we did not have substantive and protracted corrections. The second cycle had a more pronounced mid-cycle peak, and a longer consolidation after it, and even then the 2nd wave of movement.
The current cycle can have a 3-wave movement. What does this indicate?
💡For example, if now the ETF inflow continues to be positive, and in a month everyone will understand that the halving is very soon, this may lead to the fact that there will be no substantial corrections for another 2-3 months.
📝The third wave will begin already after a decrease in sales from miners and an increase in liquidity from lowering interest rates and infusions into the economy.
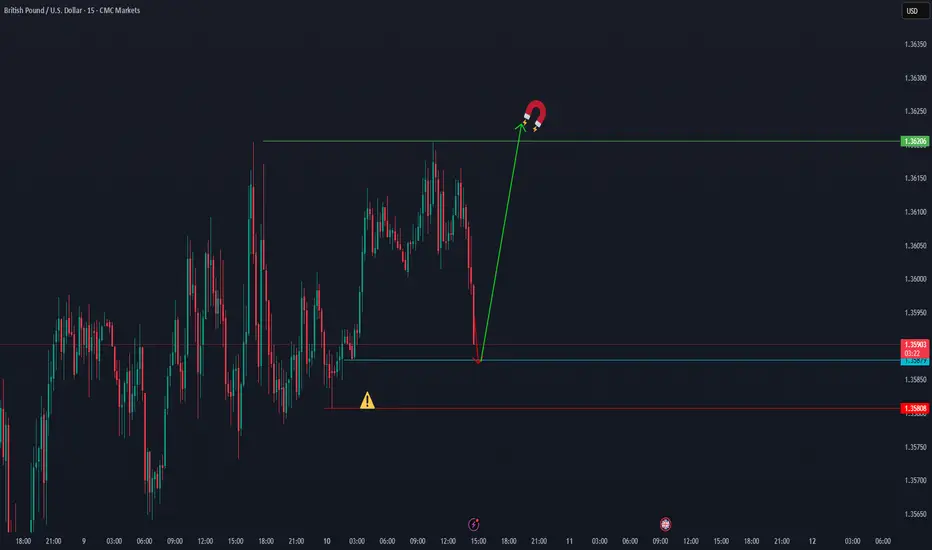
Lower time frameI've shared an analysis from a lower time frame, that could indicate the start of a big move.

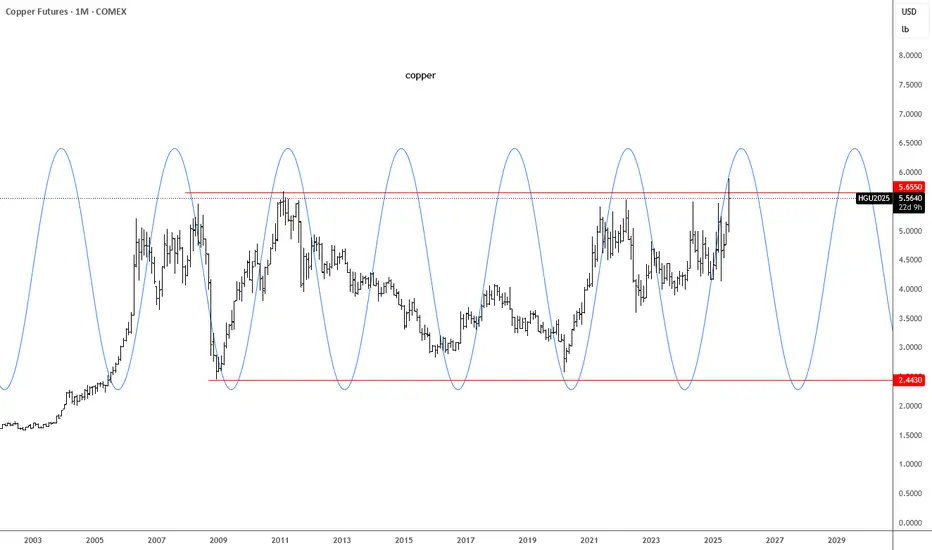
Copper: Cycle TopLooking at Copper, is back near the highs due to tariffs. Miners are probably producing more, but industrial buyers won’t keep paying these high prices forever. That’s usually when investors get hurt.
Current phase its a cycle top IMO.
GH
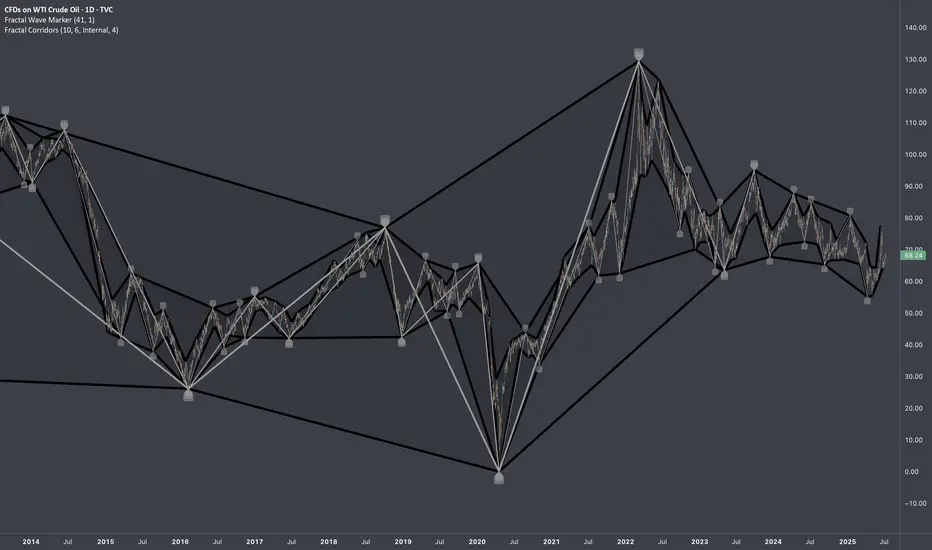
USOIL: Historic Full CyclesResearch Notes
Documenting historic examples of fractal loops for future references and research.
Fractal full cycles
70's; 80's; 90's
Late 90's & Early 00's
00's
10's
10's & 20's
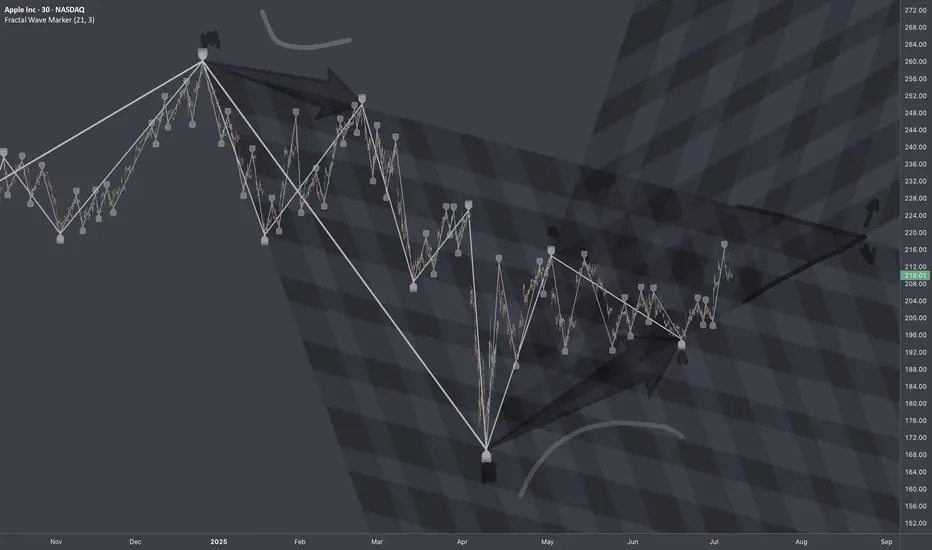
$AAPL: Multi-Cycles At PlayResearch Notes
Documenting New Interconnections
Wave properties:
3rd frame of reference
Multi-Cycles
Fibs of broader cycle
Using coordinates of the recent established cycles for predictive/guiding properties:
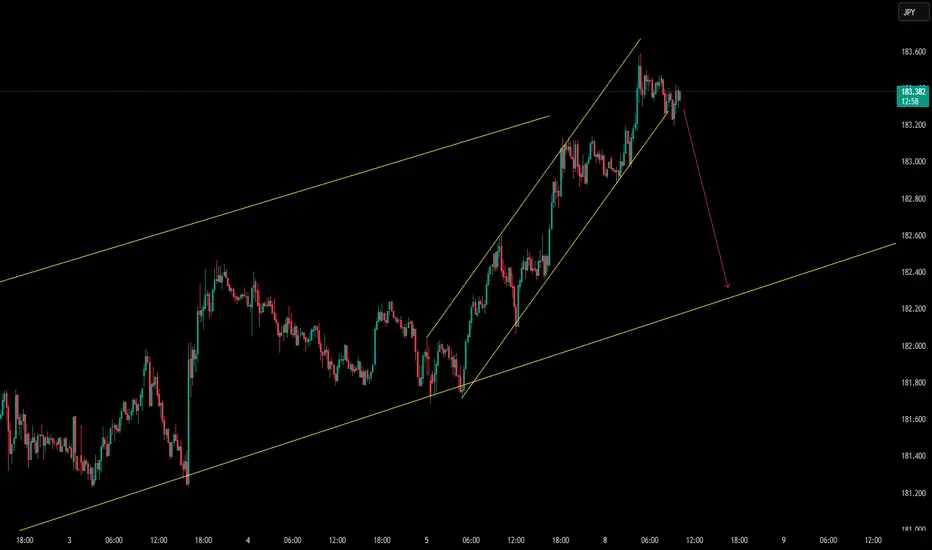
This pullback is necessary to maintain the channel structure.OANDA:CHFJPY
We're in an ascending channel on the higher time frame, and based on candlestick patterns, I expect a minor crash as the market tests the bottom of the channel.
Stay with me so we don't miss the move. ✅
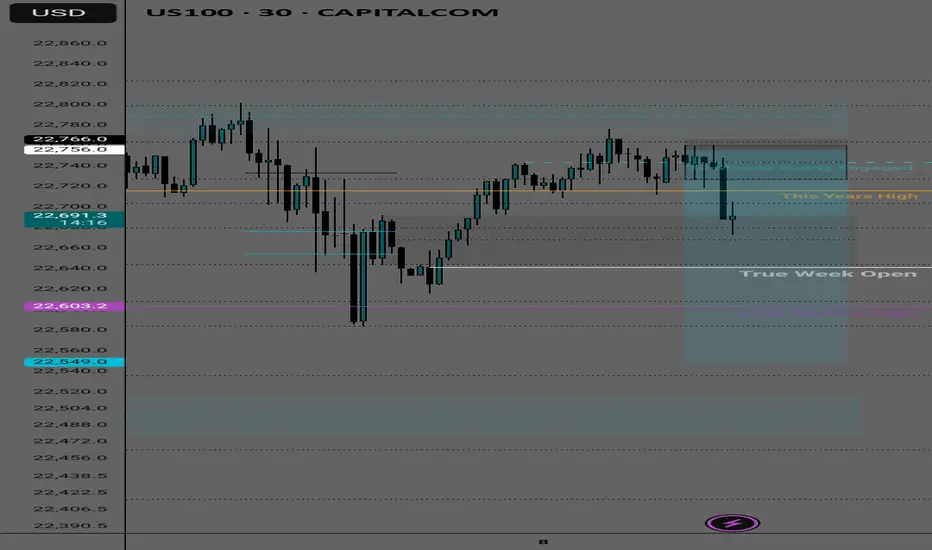
Bear signalsLooking for 22500 Im thinking. Banks trade the round numbers and the round numbers for nas are 125 point increments
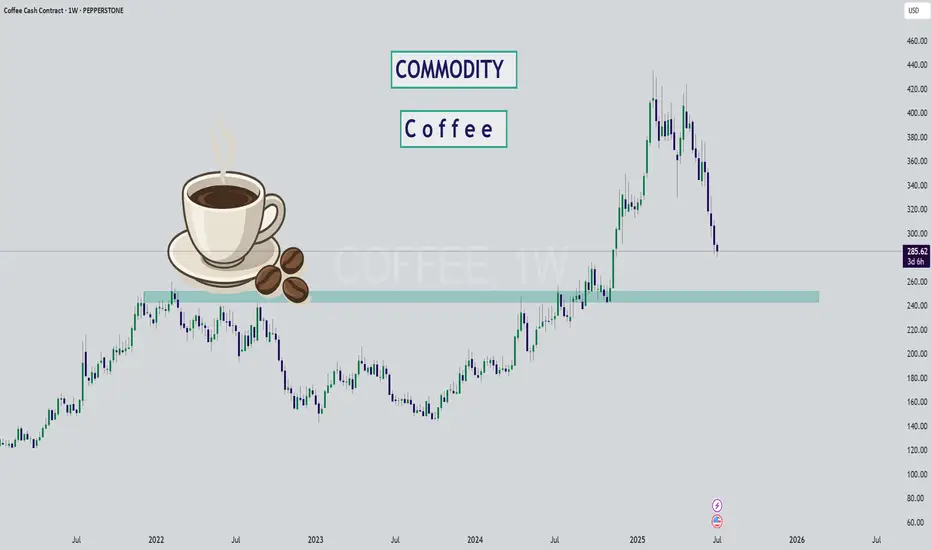
COFFEE - My Commodity of ChoiceI've laid out a plan I'm looking at on one of my favorite commodities - COFFEE ☕😍
What makes it so hard is the predictability of the weather - nearly impossible for the future. However, it is odd to see that the price still bonces at key support and resistance zones, almost like any "stock". Which tells me regular market trading still applies despite the odd weather event.
The reason Coffee has fallen so hard over the past few months is supply - due to extremely favorable weather conditions, coffee supply is more than demand. Resulting, as market dynamics goes, in a drop of price.
It's unfortunate though that my favorite pack of beans at the supermarket has not gone down - weird how that works 🙄 I like a medium roast, Columbia single origin.
It's dropped -33% already, but I can clearly see the market structure entering bearish phase after the bullish phase, peak (the new high) and now likely a multi-month bearish season. The question is just where the price can bottom for such a well loved commodity.
I looked at past cycles, not too long ago we dropped roughly 44% during the bearish cycle, taking 2-3 years to move into accumulation before another impulse wave up. That places a target for entry exactly in the highlighted zone around $250ish.
But I wouldn't get too greedy on my favorite commodity, buying orders can't be too low either. This would likely have to be a multiyear hold. Pepperstone sells coffee on cash contract but I usually do futures. Pity that I didn't get in sooner, bullish cycles is also at least a 2 year journey. I'll sell when the weather is bad 😅
Next up? Chocolate for sure...
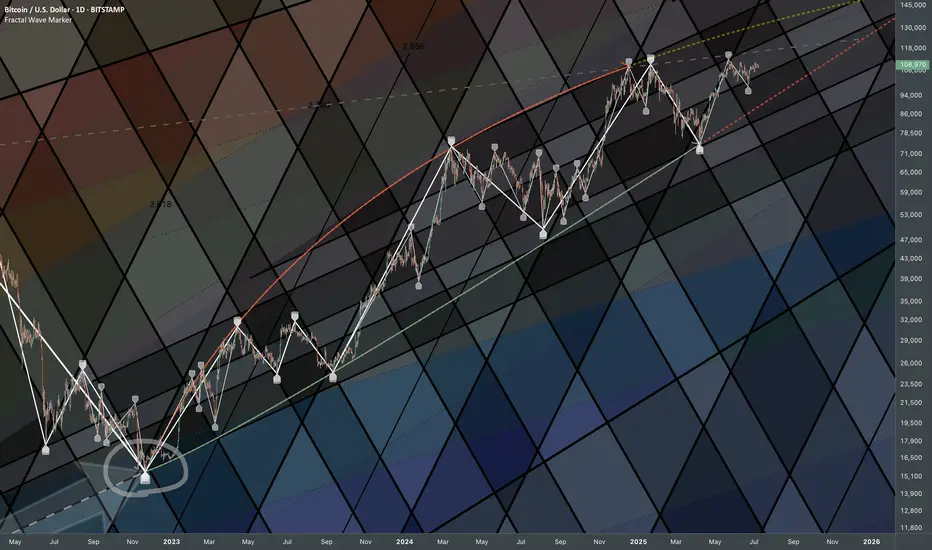
Bitcoin: Integration of Major BottomsUpdating former discovered connection from closeup.
Covid Low - 2022 Bottom
Using direction for fib channels
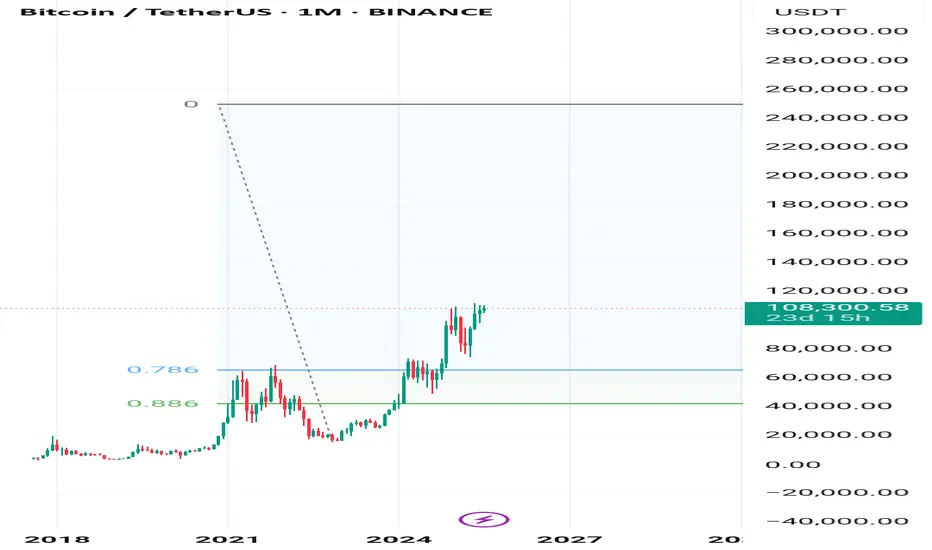
Like the previous cycles!Our basis is the Fibonacci retracement with 78%. The 78% level should be aligned with the previous peak.