Economic Cycles
SP500 - Cycle Analysis; New V-Bottom24 Dec 2018 - V-Bottom Trough:
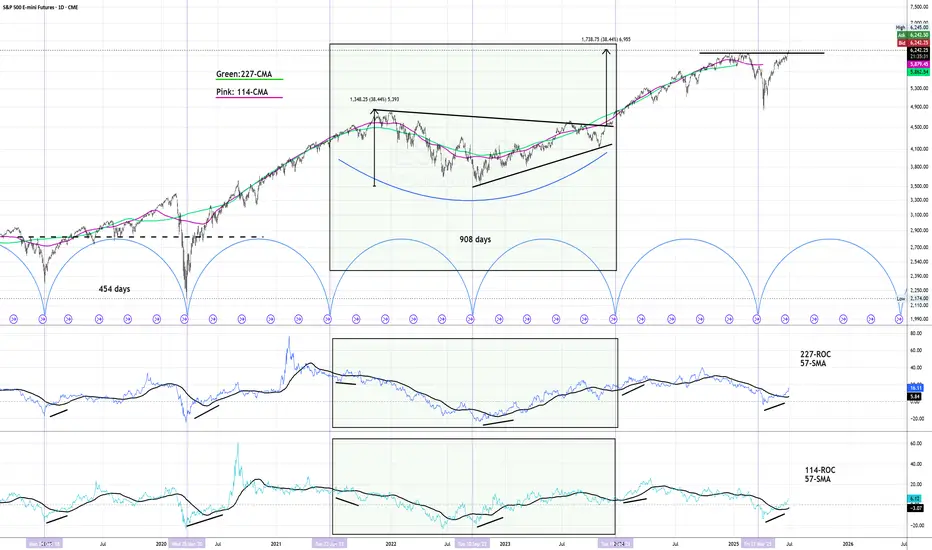
This marks a clean V-bottom. Both the 227-ROC and 114-ROC showed simultaneous positive acceleration after price reacing its low. Shortly after, both crossed their 57-SMA almost in sync — increasing the probability of a sustained bullish move. Price confirmed this by breaking resistance and forming a V pattern. This was further validated by the centered moving average crossover (114-CMA crossing above 227-CMA).
25 Mar 2020 - Deep COVID Crash Trough:
During this phase the priced broke below the support, creating a deep trough. Altough both ROC lines initially showed strong negative acceleration due to the COVID-19 crash, they soon reversed above their 57-SMAs, signaling a major shift in momentum. This coincided with the price breaking above the key resistance which was also crossed in 2019 when confirming the old V-pattern. After this breakout, a brief pullback followed before the uptrend resumed with increasing strength.
22 Jun 2021 to 19 Dec 2023 - Pattern
During the initial period a bearish divergence was visible in the ROC, nevertheless price and rate of change both declined making a low in early October 2022. A technical pattern began to form, which appears to align more closely with a symmetrical triangle; So when measuring its height and projecting it from the breakout point aligns with the new all-time highs that were reached on 27 June 2025.
21 Mar 2025 - New Cycle Trough
A new V-bottom formed shortly after the current cycle began. Both ROC indicators had already crossed their SMAs to the upside, showing early signs of positive acceleration, days before of price broke through the resistance and reached the new record high.
The 227-SMA is likely to cross from below the fast SMA while a possibility of a pullback increase.
Following that, the 114-CMA will probably has the chance to cross back the 227-CMA, with the price potentially confirming a new support level and resuming its uptrend - in line with the broader cycle timeline.
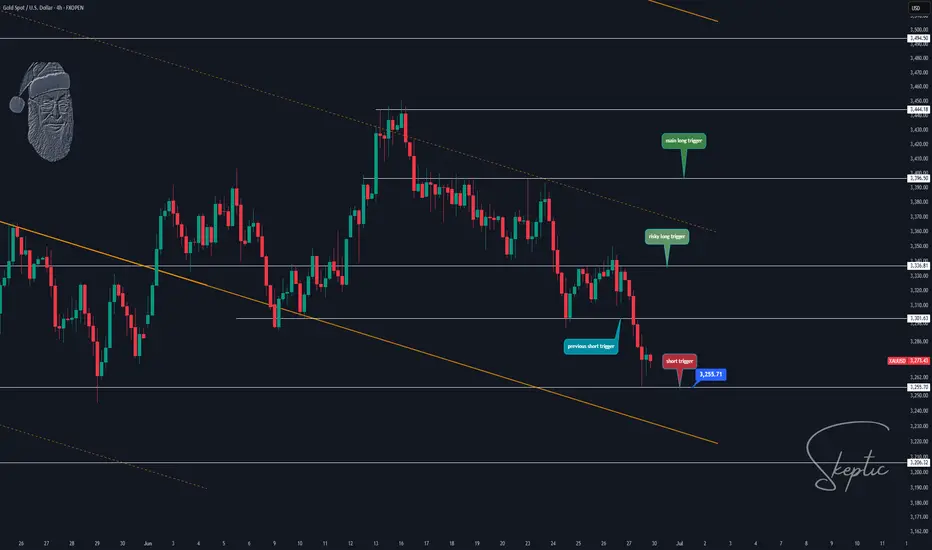
Skeptic | Gold (XAU/USD) Watchlist: Key Triggers for the WeekLast week, our XAU/USD short trigger from the previous watchlist activated cleanly, driving a strong downward move. Now, let’s unpack the Daily and 4-Hour timeframes to pinpoint the Low Wave Cycle (LWC) and lock in new long and short triggers for the week ahead. Here’s the no-nonsense breakdown to keep you ahead of the game. 📊
Daily Timeframe: The Big Picture
On the Daily chart, Gold pulled off an intriguing move last week. After breaking the ceiling of a previous downward channel, I cloned that channel and placed it above the prior one. Price reacted perfectly to the channel’s midline and is now heading toward the channel floor. Overall, the Daily trend is range-bound, likely ranging between 3125 and 3445. However, the Higher Wave Cycle (HWC) on the Weekly timeframe remains uptrend, so we focus on the Low Wave Cycle (LWC) for our setups.
Key Insight: The range-bound Daily suggests consolidation, but the Weekly uptrend keeps the bigger picture bullish. Prioritize LWC for precise entries.
4-Hour Timeframe: Long & Short Triggers
Zooming into the 4-Hour chart, let’s identify the LWC and set our long and short triggers:
Short Trigger: A break below the 4-hour support at 3255.71 could drive price back to the channel floor, potentially re-entering the previous downward channel. This is the safer play, aligning with recent momentum.
Long Trigger: A break above resistance at 3336.81 is the initial trigger, but the primary long trigger is a break of 3396.50 . This is riskier due to the range-bound Daily , so use a tighter stop-loss and take profits quickly to avoid choppy reversals.
Pro Tip: Shorts are stronger given the recent downward momentum. For longs, expect volatility—set conservative stops to dodge stop-loss hunts in the range.
Final Vibe Check
This Gold Watchlist equips you to trade smarter, not harder. With XAU/USD in a Daily range but a Weekly uptrend, patience for clear triggers at 3255.71 (short) and 3396.50 (long) will maximize your edge. I’ll keep you updated daily as the market evolves. Protect your capital—stick to 1%–2% risk per trade, no exceptions. Want more on HWC/LWC strategies or another pair? Drop it in the comments! If this analysis sharpened your game, hit that boost—it fuels my mission! 😊 Stay disciplined, fam! ✌️
💬 Let’s Talk!
Which Gold trigger are you eyeing? Share your thoughts in the comments, and let’s crush it together!
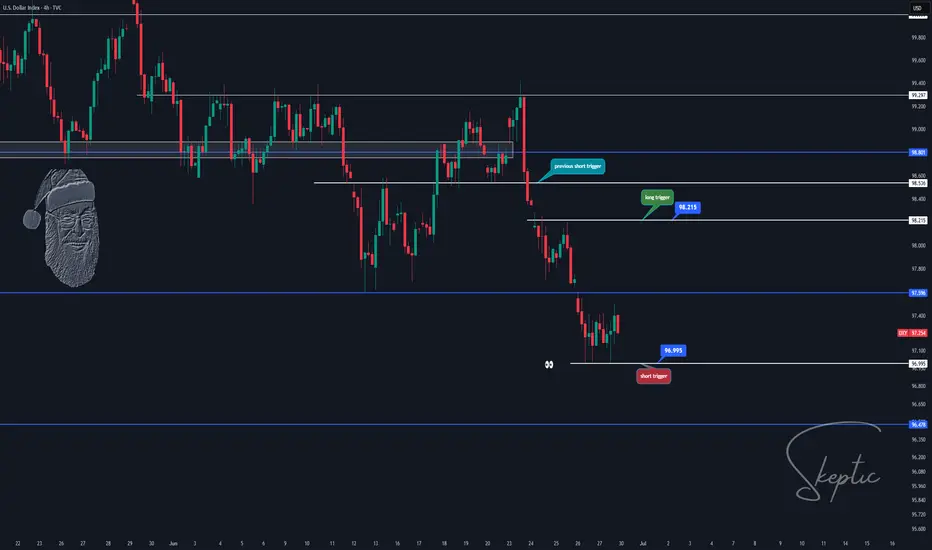
Skeptic | Weekly Watchlist : DXY Triggers & Pro SetupsLast week, DXY played out our bearish scenario perfectly, breaking the short trigger at 98.530 and delivering a strong downward move . With Higher Wave Cycle (HWC) and Minor Wave Cycle (MWC) now bearish, I’m leaning heavier on short positions with tighter risk management. Let’s break it down with no FOMO, no hype, just reason. 📊
Daily Timeframe: The Big Picture
The key support at 98.801 was decisively broken, and we’ve confirmed below it—the major trend is now fully bearish. The next daily support lies at 96.478 , but I expect range-bound action early this week, especially after last week’s big move. Patience is key—let the market form a clear structure before jumping back in.
Key Insight: The bearish trend is locked in, but early-week consolidation is likely. Wait for the market to signal its next move.
4-Hour Timeframe: Long & Short Triggers
Zooming into the 4-hour chart, let’s pinpoint Low Wave Cycle (LWC) and triggers for long and short setups:
Short Trigger: Break below 4-hour support at 96.995 , confirmed by RSI re-entering oversold. Want to wield RSI like a pro? Check out my RSI Masterclass —it’s a game-changer! 😏
Long Trigger: Break above resistance at 98.215 . This is riskier since it’s against the bearish trend—set a wider stop-loss and take profits quickly. Why? HWC and MWC are bearish, so the first uptrend wave risks stop-loss hunts or fakeouts. I’ll drop an HWC/MWC/LWC guide soon to optimize entries, stops, and more—stay tuned!
Pro Tip: For longs, expect volatility in the first wave. Shorts align with the trend, so they’re the safer play—focus on 96.995.
Final Vibe Check
This Weekly Watchlist sets you up to trade smarter, not harder. DXY’s bearish momentum is our focus, but patience will unlock the best setups. I’ll keep you updated daily as markets evolve. Protect your capital—max 1%–2% risk per trade, no exceptions. Want the HWC/MWC/LWC guide or another pair? Drop it in the comments! If this watchlist sharpened your edge, hit that boost—it fuels my mission! 😊 Stay disciplined, fam! ✌️
💬 Let’s Talk!
Which setup are you eyeing this week? Share in the comments, and let’s crush it together!
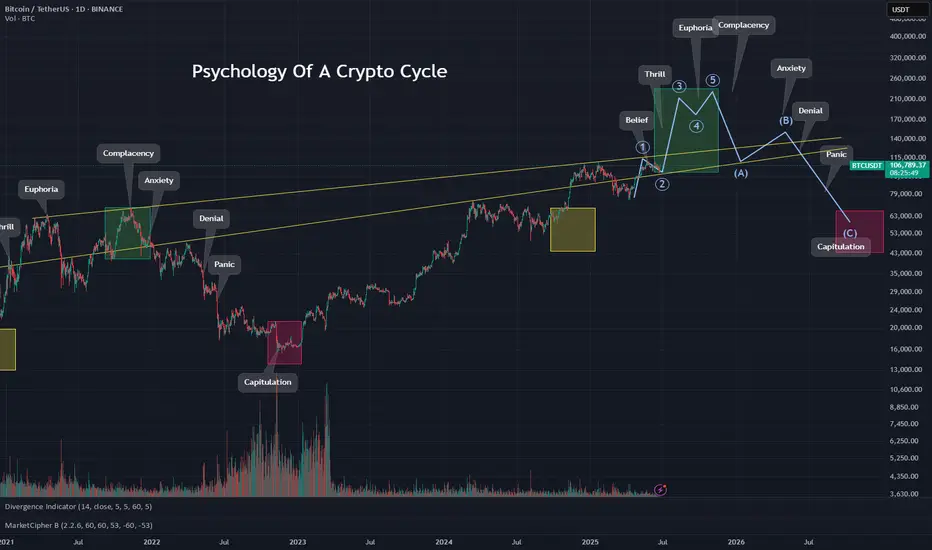
PSYCHOLOGY OF A CRYPTO CYCLEWe expected a pullback, and now thats behind us!😅
The market is back on track, and we are firmly in the #Belief phase of the bull cycle.
With heavy short liquidity stacked around $110K, a push into that zone could trigger a short squeeze, launching us into the #Thrill phase.
And if momentum holds, all signs point to #Euphoria by late 2025.
Favorites so far this cycle:
🥑 POLONIEX:GUACUSDT 🔗 POLONIEX:LLUSDT 🎮 KUCOIN:MYRIAUSDT
🌐 HTX:SYNTUSDT 🧪 MEXC:DEAIUSDT 🏠 OKX:PRCLUSDT
🧱 MEXC:YBRUSDT ⛏️ MEXC:KLSUSDT 🧩 $RUJIUSDT
Comment below your favorite coins!
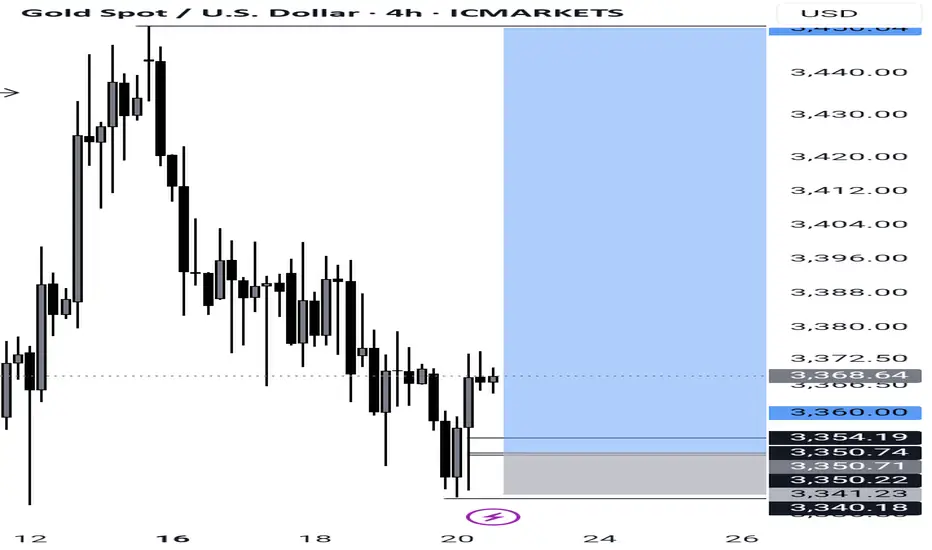
[ TimeLine ] Gold 25-26 June 2025📆 Today is Friday, June 20, 2025
📌 Upcoming Gold Signal Dates:
• June 25, 2025 (Wednesday) — Single-candle setup
• June 25–26, 2025 (Wednesday–Thursday) — Two-candle combined range
🧠 Trading Plan & Notes
✅ Gold recently experienced a sharp bearish reversal of approximately 1100 pips, after touching the key psychological resistance at 3451.
🔁 Several re-entry opportunities have emerged, especially around Fibonacci retracement levels, which have acted as reliable reaction zones.
✅ I will personally trade both signals (June 25 and June 25–26) as part of my ongoing live research and strategy development.
⚠️ If you're feeling cautious, it’s completely valid to skip the June 25 signal and prioritize the 2-day range (June 25–26) instead for added confirmation.
📋 Execution Plan
🔹 Wait for the Hi-Lo range to fully form from the selected candle(s):
▫ Ranges will be initially marked with purple lines on the chart.
▫ After market close, I’ll update with buffer zones, Fibonacci levels, and other supporting indicators.
🔹 Entry Trigger:
• Executed only when price breaks out beyond the range, including a 60-pip buffer.
🔹 Risk Management – Recovery Rule:
• If the trade hits Stop Loss (SL), we will cut/switch direction and double the position size on the next valid breakout setup for potential recovery.
📉📈 Chart Reference
🔗 Copy & paste this into your TradingView URL: TV/x/fzDQQ7oo/

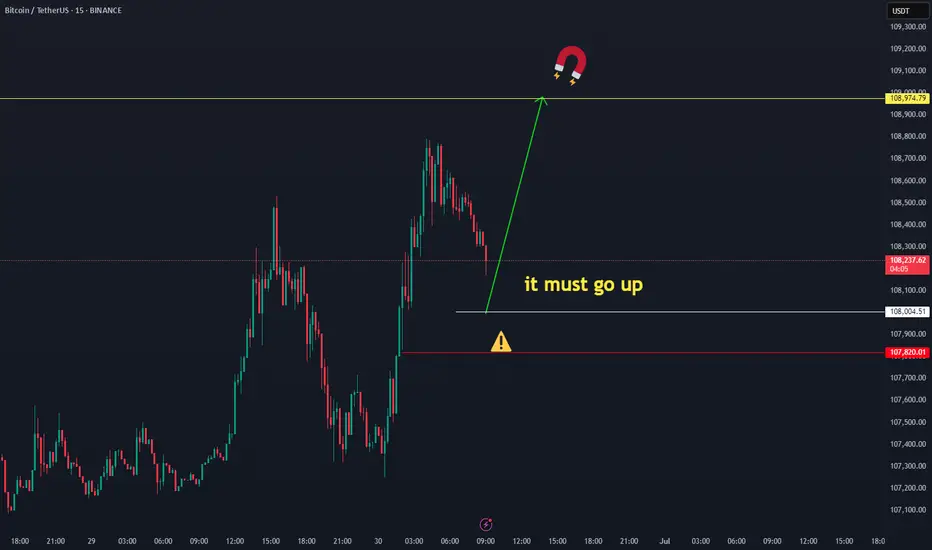
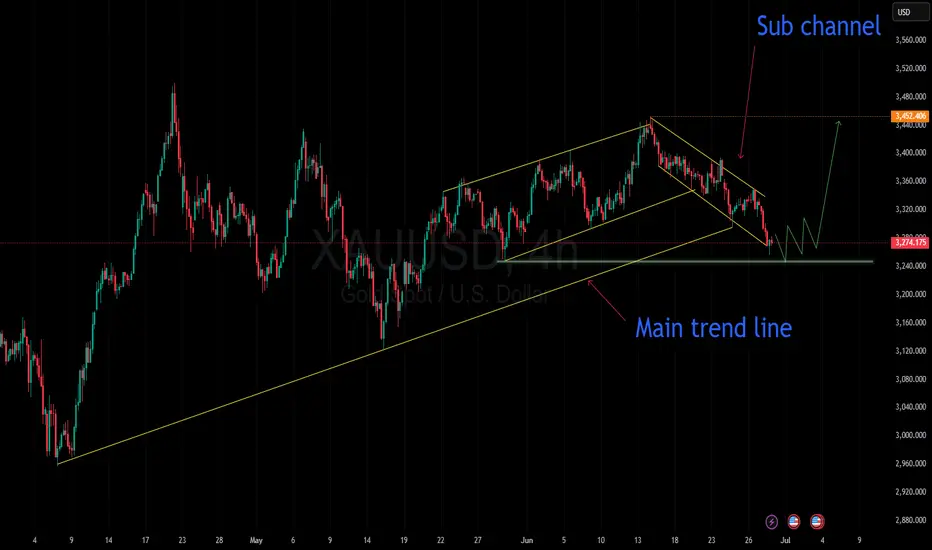
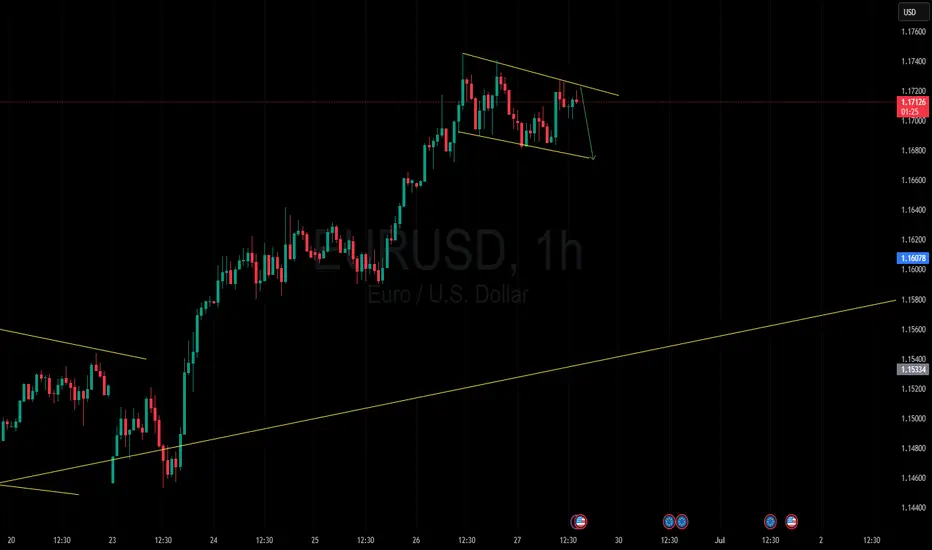
Gold is coiling for a breakout... All eyes on the next move!📉 Gold is currently moving within a minor descending channel.
In yesterday’s analysis, I pointed out the potential for a drop. Now, after a period of range-bound movement, I expect a breakout from this channel and a return to the main trend.
🎯 The first target on a reversal would be the top of the minor channel.
Keep a close eye on price action here — this zone could be key for the next move
OANDA:XAUUSD
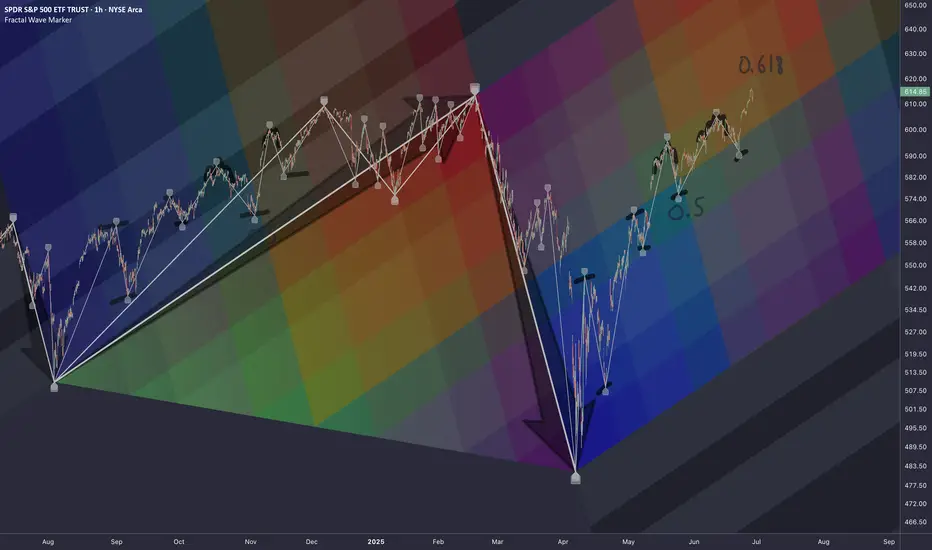
SP500: Wave Estimation via FibsRegularities
Common angle
To estimate where it's heading to we use those recursive patterns and map them through fib scaling. Overall systematic wave expands in similar geometric narrative but with a compressed cycle.
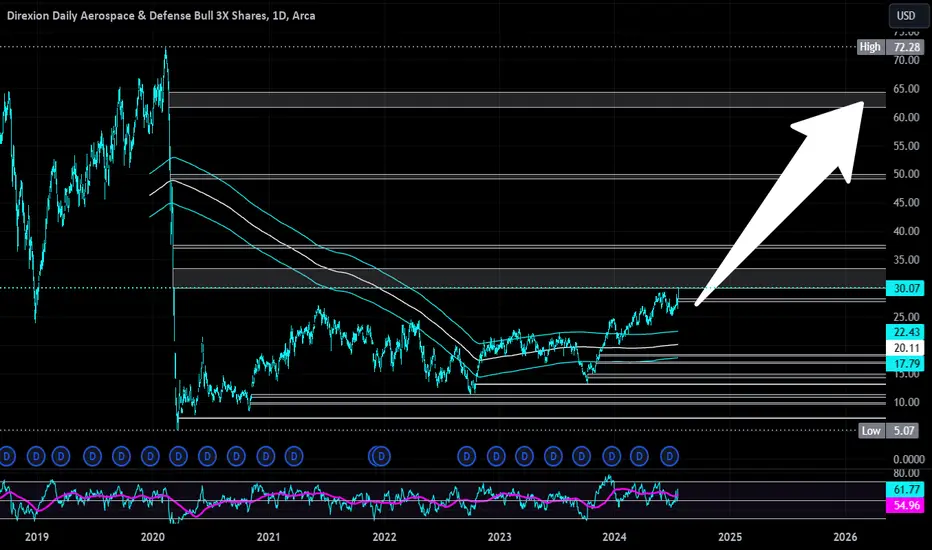
War is a Racket | DFEN | Long at $28.00The war machine keeps turning. Profits will reign. Direxion Aerospace and Defense 3x AMEX:DFEN never fully recovered from pandemic lows, but world peace is (unfortunately) far from reach. The uptrend in the chart has commenced. Personal entry point at $28.00.
Target #1 = $37.00
Target #2 = $50.00
Target #3 = $64.00
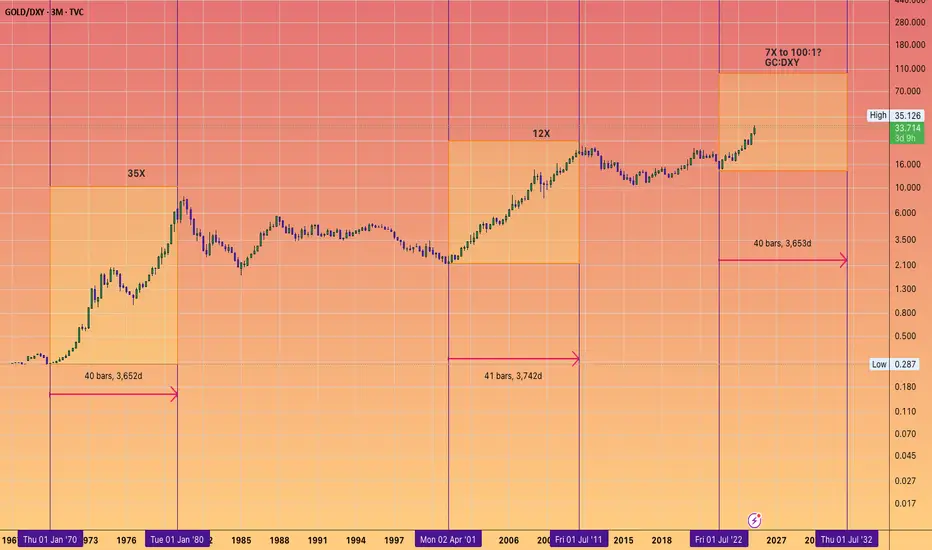
WHAT IS THE EXPECTED RETURN and DURATION of this GOLD Bull Run?Well, when measured against the DXY index, a clear trend becomes apparent.
A Golden Bull typically lasts about 40 quarters, which is essentially 1 decade (give or take a quarter).
Similar to #Bitcoin and its cyclical bull markets within a larger secular bull, the returns tend to decrease over time.
However, it seems that a triple-digit Gold price relative to the DXY is on the horizon at the very least.
What would that look like if the DXY were to hit a new low around 69? This would suggest a Gold price of $6900 at a ratio of 100:1.
A Gold price of $12K with a DXY of 80 only requires a ratio of 150...
Thus, a five-digit Gold price is certainly within the realm of possibility.
I have forecasts that extend as high as $12K.
Descending channel and second-step trapn the descending channel that has formed, the candles indicate a downward move
OANDA:GBPNZD
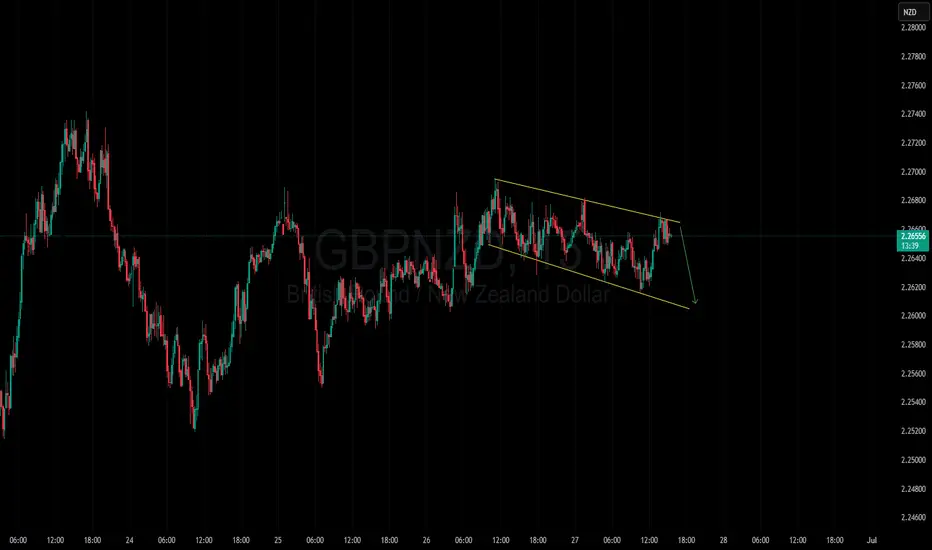
Expecting a pullback to test the channel’s floorA strong candle without follow-through is a sign of trend weakness, and from where the channel has formed, a pullback to the channel’s floor is logical
OANDA:EURUSD
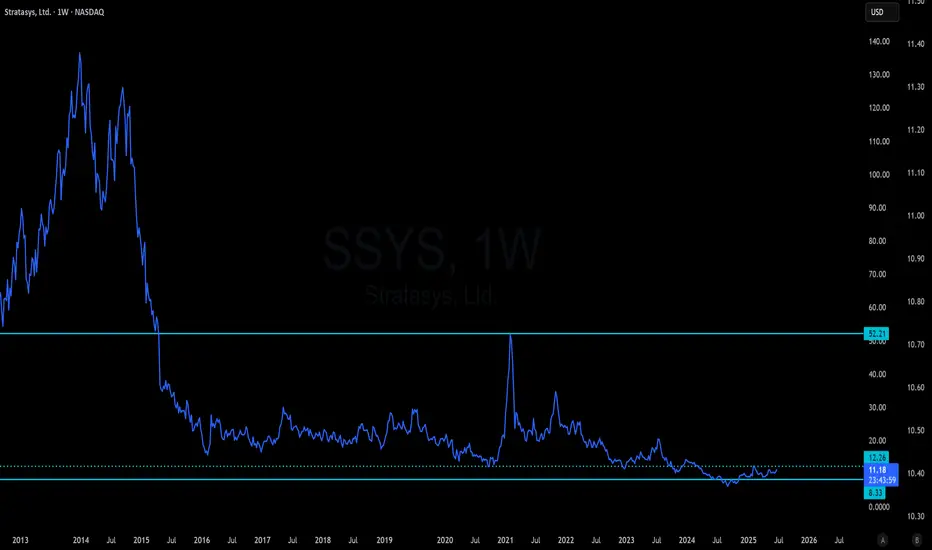
SSYS to 50A victim of the 2013 bubble has finally bottomed out and remains a leader in the 3D printing industry. As robotics and advanced materials advance, 3D printing will become the standard in manufacturing.
A very beaten down stock for almost 10 years can go back to 50 and possibly higher. Has government and corporate contracts in: Medicine, aerospace, defense, and cars.
- Break over 12.50 makes 50 inevitable given overall markets continue to perform well
- If earnings were to see a large jump through sudden increased demand, new ATHs are absolutely in play
Agree to disagree... Gold is topping right now.My price path seen above is a complete guess but it stems from long term trend lines and more importantly order flow from last week.
On Thursday there was a #1 trade on AMEX:PHYS for $200+ Million at the green levels in my chart above (Equivalent levels). PRICE WILL 100% go to my green lines by end of this week 04/25.
We are over shooting the dark pool sale but a lot, however, this is always to trap retail and create fomo/peak fear.
In the correction/recession cycles, gold ALWAYS TOPS LAST before the crash...

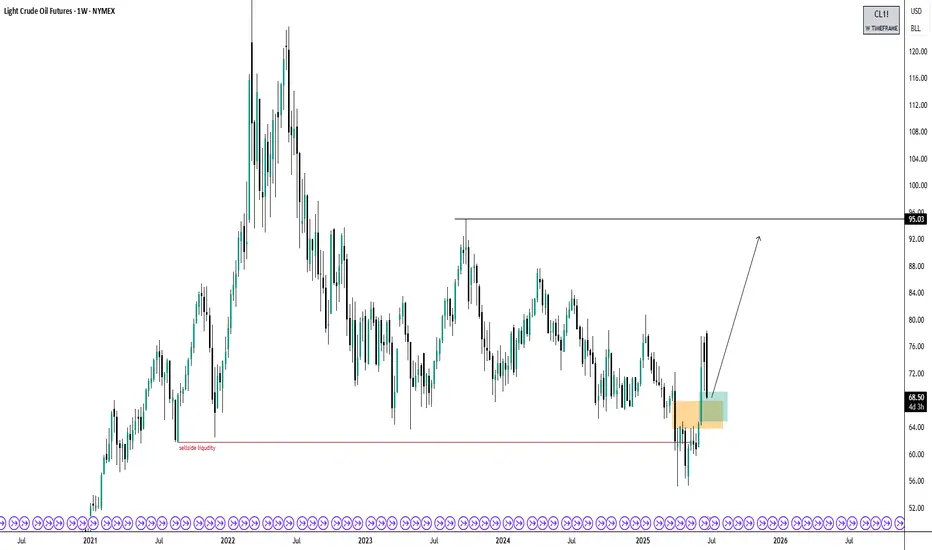
Crude Oil Bullish BiasThree years ago, I predicted that oil would trade below $61 when the price was around $118. Price traded to $55 and is now up to $68. I now believe price has exhausted sell-side liquidity and will trade higher, possibly seeing $95 and beyond.
*Not financial advice
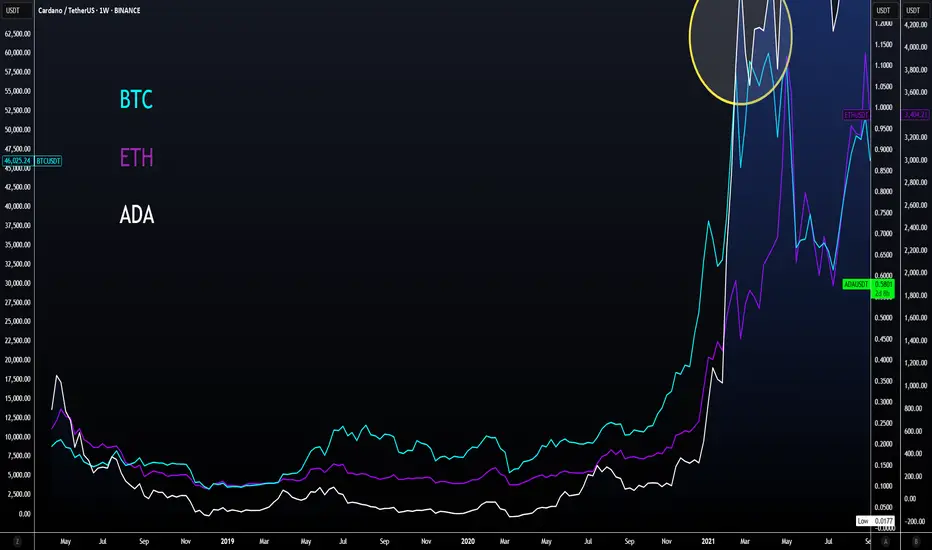
ADA | BTC | ET | Why ALTSEASON is COMING SOONAfter a -34% retracement, ADA is ready to go higher alongside with the rest of the alt market.
We see a very interesting phenomena here, were ADA also represents a large part of the larger alts: BTC pulls back, ETH is starting to increase or trades sideways (before the increase) whilst the alts dip.
This is actually BULLISH for alts, showing the very clear rotation between BTC, ETH and top 15 alts.
If we look at the macro of ANY of the alts I've been working through recently, a similar pattern appears - a clear bottom, followed by a sideways trade. This is usually the point just before the big ALTS season.
We actually see this pattern at the end of the 2018 rally, as well as after the 202- Covid dip:
The bottom line -
ADA and other alts are gearing up for their ALTSEASON. With patience, we will soon see some great gains across the markets.
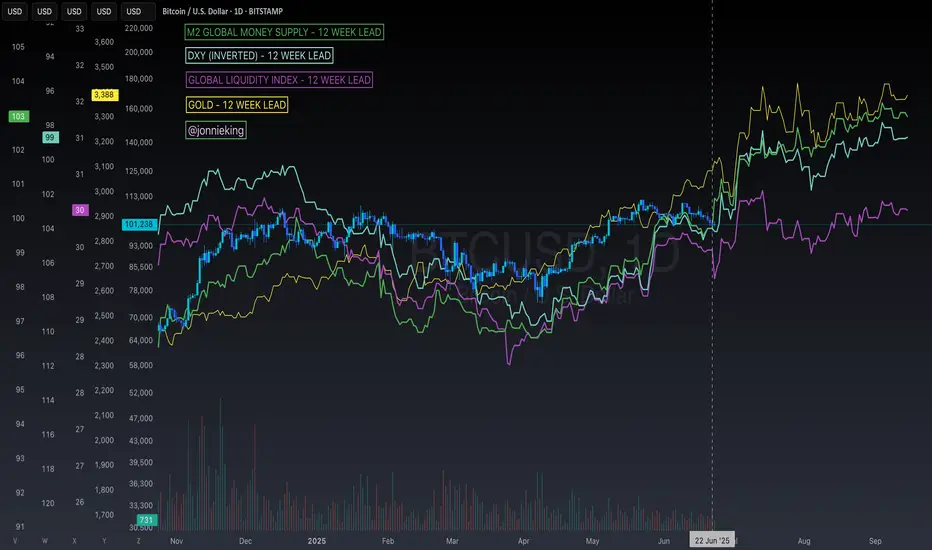
$BTC Leading Macro Indicator Chart Predicted the Nuke to The DayYet again this chart predicted the nuke to the day 💣
I know I shouldn't be surprised at this point, but I'm still fascinated by how accurate technical analysis can be 🤓
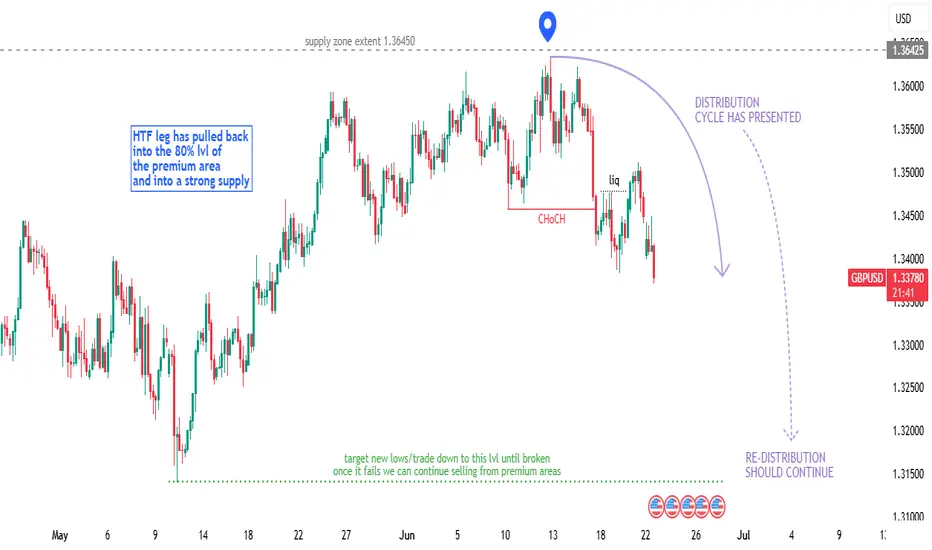
GBPUSD - Technical Outlook (Long + Short Term)In this article, I’ll share my current outlook on GBPUSD, highlighting both higher time frame (HTF) and intraday considerations.
Higher Time Frame Analysis
The overall trend remains bearish. Price is still trading within the previous structural leg, with the key level at 1.42500. Unless we see a decisive break above this level, my bias will remain bearish for this pair.
Recently, we’ve witnessed what looks like institutional manipulation to the upside, followed by a sharp bearish reaction from the weekly supply zone. This price action aligns with a classic Wyckoff distribution cycle, which often signals that the prevailing trend is likely to continue.
Intraday Advice
For short-term traders, it’s best to wait for lower time frame (LTF) pullbacks and signs of manipulation before considering short positions. If price continues to push lower, there should be opportunities to ride the trend down over the coming weeks, with multiple entry points along the way.
Trading Considerations
If this analysis plays out, there’s potential to maximize gains through both swing and intraday trades. However, patience and risk management are key. Losses are inevitable - what matters is managing risk and staying disciplined.
Key Points to Remember:
Wait for clear pullbacks before entering trades.
Stick to your risk management plan.
Stay patient and let the market come to you.
This is an exciting time to trade FX:GBPUSD , but always assess if the risk is worth the reward before entering any position.
Happy hunting predators...
Apex out!
XAUUSDExpecting price to open and decline a bit to then buy possibly for the rest of the week. Looking for Bulls to take over for as long as price respects the lows below after Monday headings candle formation the direction might be validated. If not right after Mondays open and low. If not then we might expect the opposite direction.
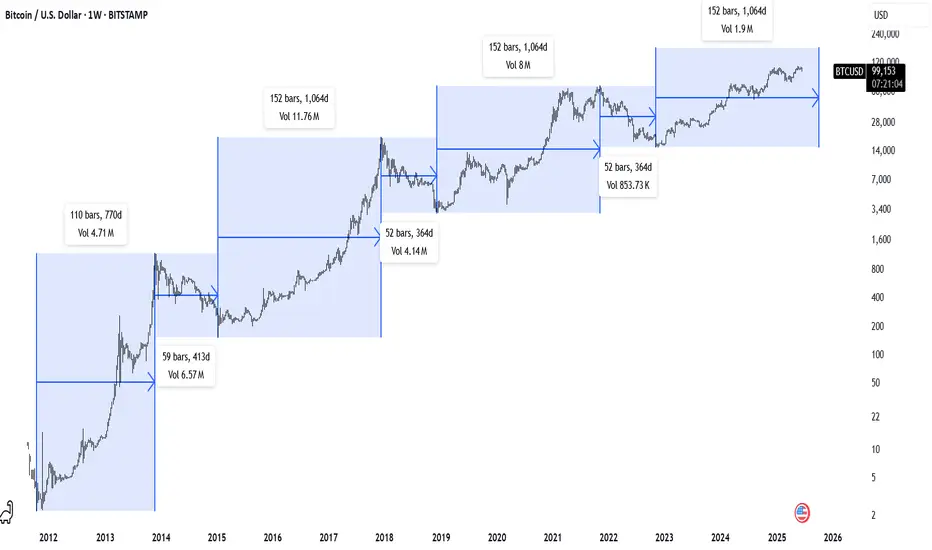
BTC Weekly - Time PatternsBitcoin Weekly Chart
52 Wk & 152 Wk Patterns // Diminishing returns
For my own personal logs.
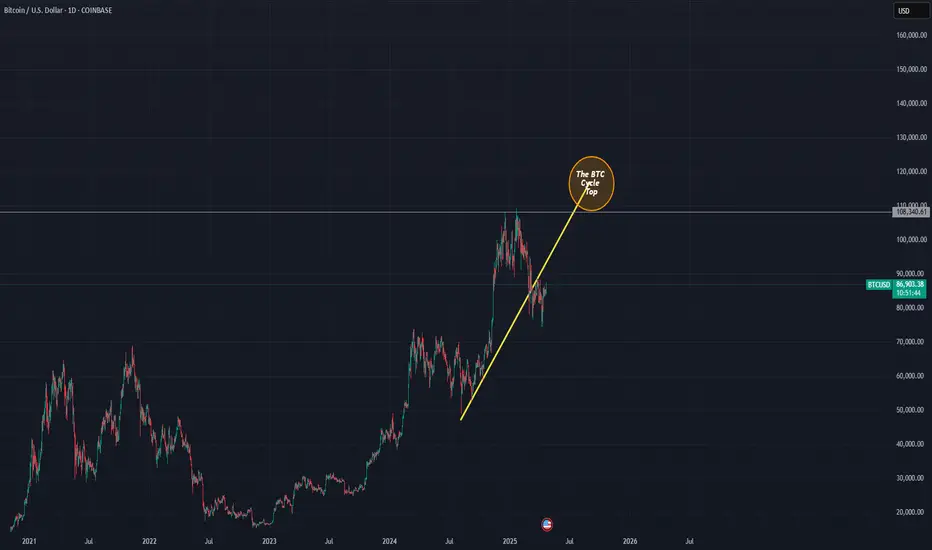
BTC/USD - The Bitcoin Cycle TopBTC has recently broken below a key uptrend line that had been guiding price for some time. I’m watching for a potential backtest of that broken trendline, a rather classic move that could set the stage for a final upwards squeeze, possibly printing a quick higher high to trap late longs.
I’m watching the circled area closely as a potential exhaustion zone. Key levels and price action around the trendline will be critical, breaking of upwards trendlines after backtesting may mark the beginning of the larger unwind.
We could see multiple backtests of the broken trendline over time, with the trendline now likely acting as resistance.
Note: I’m publishing this idea simply to have a timestamped record. This post is my way of putting a clear marker in the sand. I’m not looking to debate or go deeper into the reasoning, and I generally won’t be responding to comments.
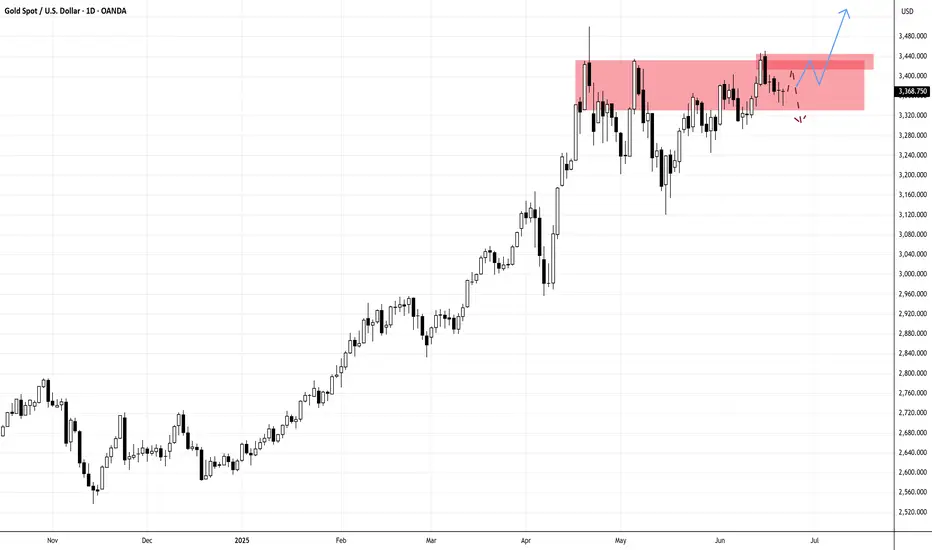
Geopolitical Tension May affect Gold's Outlook!Gold is traditionally considered a safe haven, with prices often rising during geopolitical tensions as investors seek safe security.
Will this scenario play out with the U.S. involvement in the Israel-Iran conflict? Gold is currently trading at a high of 3,368.75 and remains in a range. However, in times like this, technical analysis might take a back seat, as geopolitical developments could overshadow any technical setup.
N.B!
- XAUUSD price might not follow the drawn lines . Actual price movements may likely differ from the forecast.
- Let emotions and sentiments work for you
- ALWAYS Use Proper Risk Management In Your Trades
#gold
#xauusd
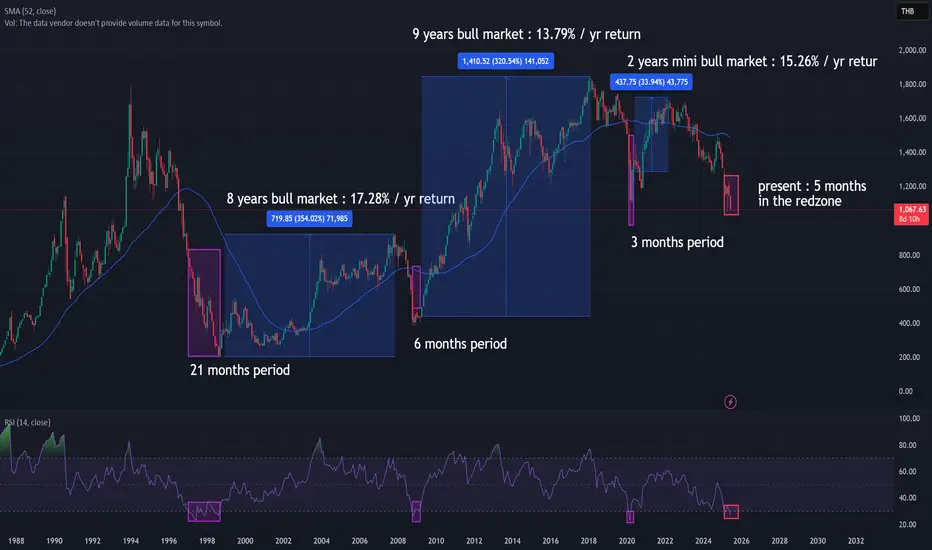
SET's 4th time RSI(50m)< 30 since it's inceptionEvery time the SET Index enters the RSI "red zone" (oversold territory), the long-term outcome has consistently been positive. Historically, the following 8–10 years have delivered strong returns, with some bull markets reaching over 15% annually.
The duration of time spent in this red zone has also been decreasing—21 months during the 1997 crisis, 6 months in 2008, and just 3 months in 2020. Currently, we are 5 months into this oversold zone.
But unlike developed markets, Thailand’s stock market is largely liquidity-driven rather than purely fundamentals-driven. That means prices can often disconnect from actual economic conditions due to capital flows and investor sentiment.
When liquidity dries up, prices fall sharply—but that also creates mispricing and higher information asymmetry, which can lead to alpha opportunities. This is exactly why we need to pay even closer attention now.