BITCOIN TO 193000!!!!EVERYONE IS WRONG!it has been 5 years that i have been studying the btc and linkusdt cycles, and what i know is that a bull market is coming this summer, starting in july—maybe on the 4th or 7th.
Economic Cycles

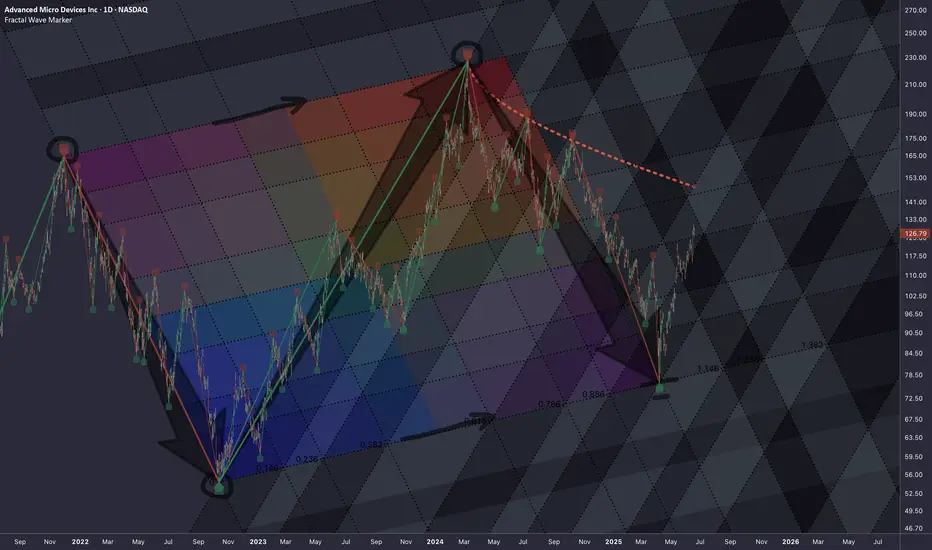
AMD: Mapping Cycle via 3 FibsWaveform
High To High cycle Fib interconnection
Extension to the right matches recent bottom.
Expanding and anchoring the structure on L2L cycle
Levels around 3 intersections expose highest probability density.
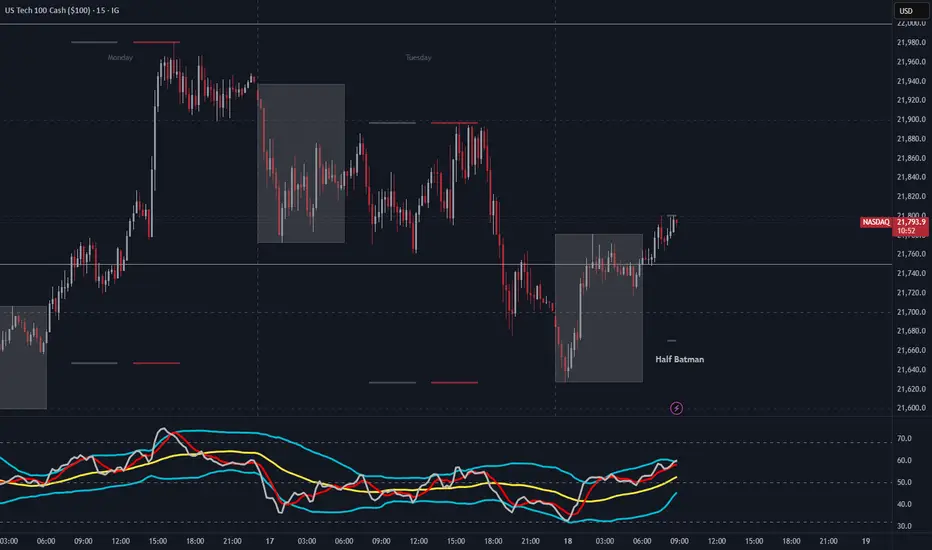
NAS100 (US100) Mid Week Reversal - Bullish Order FlowA Half Batman presents itself during the Asian session and seems to be ready for LDN opening. This Peak Formation could be seen as the reset, to turn NAS100 bullish and ready to break the structure high.
TOTALCAP — The Next Trillion Crypto Move: Are You Ready?When people analyse the crypto market, they often default to Bitcoin and for good reason. It’s the one and only, the king. But sometimes, to see the forest instead of just the tree, you need to zoom out and study the broader picture.
That’s where the Crypto Total Market Cap (TOTALCAP) chart comes in. It’s essentially the mirror of Bitcoin, but it offers powerful macro insight — not just price, but scale. Looking at trillions instead of dollars changes how you frame support, resistance, and overall sentiment. Let’s dive in.
🧠 Why TOTALCAP Matters
TOTALCAP aggregates the value of every coin and token — the complete valuation of the entire crypto industry.
And while it often moves in sync with Bitcoin, it carries a different weight.
Shows the “big picture” of institutional and retail money flow
Offers clearly defined round-number zones (Trillions) as psychological S/R
Removes coin-specific anomalies and focuses on collective momentum
In bull and bear markets, these trillion-dollar thresholds act like major checkpoints. Watching how TOTALCAP interacts with these levels can give early signals that BTC or alts alone can’t.
Historical Key Levels & Structure
Let’s break it down by macro phases:
✅ November 2021 — Peak of Last Bull Market:
TOTALCAP peaked exactly at $3 Trillion.
This level acted as a ceiling — once hit, the market reversed sharply.
This marked the top of the 5-wave impulsive move (Elliott Wave theory).
📉 November 2022 — Bear Market Bottom:
TOTALCAP dropped below $1 Trillion, bottoming at $727 Billion.
This was almost a 0.786 fib retracement from peak — similar to BTC’s historical retracements.
The $1T mark was retested as resistance before being reclaimed as support.
📈 2023–2025 — The Bull Awakens:
$1 Trillion flipped into solid support throughout 2023.
A clear sign the macro market structure had shifted bullish.
Once $2T was breached, things moved fast.
🚀 Current State:
The market surged above the previous $3T ceiling.
TOTALCAP has hit a new ATH: $3.73 Trillion
Now, the question is: Is this the start of a new leg higher, or a bull trap before a correction?
🔍 Fibonacci Confluences — Why $3.7T Was Key
The sharp rejection at $3.7T wasn’t random. It aligns with:
1.0 Trend-Based Fib Extension: From 91.24B → 3T high → 727B low = 1.0 = 3.65T ✅ precise hit
1.272 Fib Extension of the macro move
Upper Pitchfork Resistance
Channel Top Rejection
→ All signals converged to mark that level as major resistance
🌀 Elliott Wave Macro Count
Looking at the weekly timeframe, we can see a clear impulsive 5-wave movement from the 2022 lows:
Wave 1: $727B → $1.26T
Wave 2: Correction to $975B ($1T) (support confirmed)
Wave 3: Massive rally toward $2.72T
Wave 4: Pullback toward $1.69T (VWAP retest)
Wave 5: $3.73T ATH
What does this imply?
According to classical Elliott Wave theory, after a full 5-wave move, the market tends to enter an corrective phase.
🔍 Some key levels to watch:
$3T: Historical S/R (was the 2021 top, now acting as a key level)
$2.31T: Recent swing low
$2T: Psychological and structural support
📌 Zone of Interest for Longs: $2.31T–$2T
This zone holds:
Previous consolidation zone from mid-2024
Fib retracement confluence
Likely forming Wave C bottom if this is a full ABC
🎯 Upside Targets — What If We Continue Higher?
Looking ahead:
🔸 1.618–1.666 Fib Extension = $4.42T–$4.53T
🔸 1.618 TBFE from previous cycle = ~$5.45T
📌 Rounded Targets: $4.5T, $5T and $5.5T
These are the next likely macro cycle targets — but only after a healthy correction and consolidation.
☀️ Macro Context & Summer Seasonality
Historically, summer tends to be a weaker period:
Lower volume
Institutional rebalancing
Geopolitical and macroeconomic uncertainty
📚 Educational Insight: TOTALCAP as a Tool
Treat TOTALCAP like the S&P500 of crypto.
Use round trillions as psychological levels: 1T, 2T, 3T, etc.
Always check if BTC’s price is aligned with where TOTALCAP is on the macro structure
Helps judge market strength even when BTC dominance is shifting
It’s especially useful when altcoins pump or dump out of sync with BTC — you can use TOTALCAP to track the real flow of money.
💡 Final Thoughts
We are likely in a corrective phase after a complete 5-wave cycle.
The area between $2.31T and $2T offers high-probability long entries
Watching how TOTALCAP reacts to these levels will help us anticipate the broader market’s next move
Summer slowdown could mean chop — but this also creates opportunities
💬 Let me know your thoughts: Are we entering a deeper correction? Or will TOTALCAP surprise us with a new leg higher?
Don’t forget to zoom out. The charts always tell the story.
_________________________________
💬 If you found this helpful, drop a like and comment!
Want breakdowns of other charts? Leave your requests below.

[ TimeLine ] Gold 9 & 11 June 2025📆 Market Update: Signal Timeline – Gold (June 9 & 11, 2025)
📌 Delayed Journal Entry — Trade Review & Breakdown
📍 Hi-Lo Ranges (with 60-pip buffer)
• June 9, 2025: 3287 – 3344 (Single-candle setup)
• June 9-10, 2025: 3287 – 3355 (Two-candle range)
• June 11, 2025: 3294 – 3366 (Single-candle confirmation setup)
💡 Interestingly, these price patterns showed consistency, and I executed trades based on all three signals.
✅ June 9 – Buy Signal(s)
🔹 Trigger Points:
• 3344 (Single-candle setup)
• 3355 (Two-candle range)
🔹 Price Action:
Strong bullish breakout toward 3451, but experienced significant retracement depending on entry point.
• Drawdown: Up to 50–70% of the range based on entry.
• Gain Potential: Approx. +960 to +1070 pips
⚠️ Fibonacci Note:
Retracement to around 3310 aligned well with the 60% Fibonacci zone, providing a textbook re-entry opportunity.
✅ June 11 – Buy Signal
🔹 Trigger Point: 3366
🔹 Price Action: Continued bullish move to 3451, this time with less volatility and smaller pullback.
• Gain Potential: Approx. +850 pips
📈🧠 Key Takeaway
The June 9 signals required more patience and better handling of retracement, while June 11 offered smoother momentum with cleaner execution. Those following the Fibonacci strategy were well-positioned to catch the continuation.
📉📈 Chart Reference
🔗 Copy & paste into TradingView: TV/x/MyAsl0Gx/

[ TimeLine ] Gold 2-3 June 2025Hello everyone,
📆 Today is Friday, May 30, 2025
📌 Upcoming Gold Signal Dates:
• June 2, 2025 (Monday) — Single candle setup
• June 2–3, 2025 (Monday–Tuesday) — Two-candle range
🧠 Trading Plan & Notes
✅ Gold recently made a bearish move of ~780 pips, breaking below the prior key support at 3323, down to 3245
🔁 Multiple re-entry opportunities were identified using Fibonacci retracement levels, which provided solid price reaction points.
⚠️ If the June 2 Hi-Lo range appears wide and sideways, we may consider holding off until June 4 for confirmation of clearer directional bias.
✅ I will be trading both signals (June 2 and June 2–3) as part of my ongoing research and strategy
⚠️ If the range is narrow or shows false breakout risk, it's okay to skip the June 2 signal and focus instead on the June 2–3 combined range.
📋 Execution Plan
🔹 Wait for the Hi-Lo range from the selected candle(s) to fully form.
▫ These will be marked initially with purple lines on the chart.
▫ After market close, I’ll update the chart with additional indicator levels.
🔹 Entry triggers will be based on breakouts beyond the range, with a 60-pip buffer.
🔹 If the trade hits SL, the plan is to cut/switch direction and double position size on the next valid signal as part of the recovery strategy.
📉📈 Chart Reference
Copy & paste this code into your browser and add TradingView URL:
🔗 TV/x/iQrX0gJW/
✅ Stay alert and follow the signal flow — upcoming entries could offer solid reward potential if executed with discipline.
📌 I'll post the final Hi-Lo levels and updated chart after the June 2 and June 3 candles close.

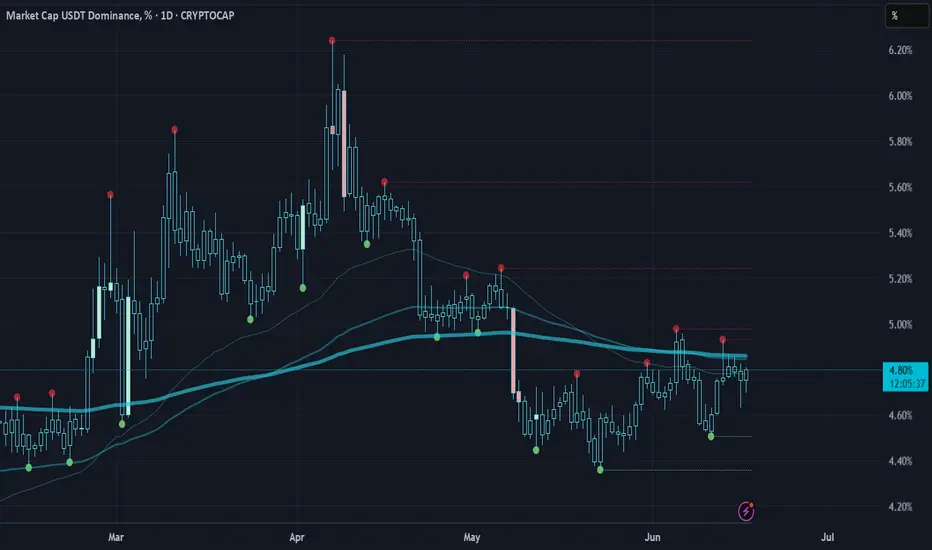
USDT Dominance SHOWDOWN INCOMINGAfter a full liquidity sweep at 4.50%, USDT.D is now pressing into the EMA cluster from below…
📊 What does that mean?
➡️ Stablecoin dominance is rising = risk-off behavior creeping in
➡️ But we’re STILL under trend — and that green dot sweep could mean a fakeout bottom
🧠 If USDT.D breaks above EMAs → altcoins bleed
🔥 If USDT.D gets rejected here → altcoins pump hard
This is the pivot. Watch closely.
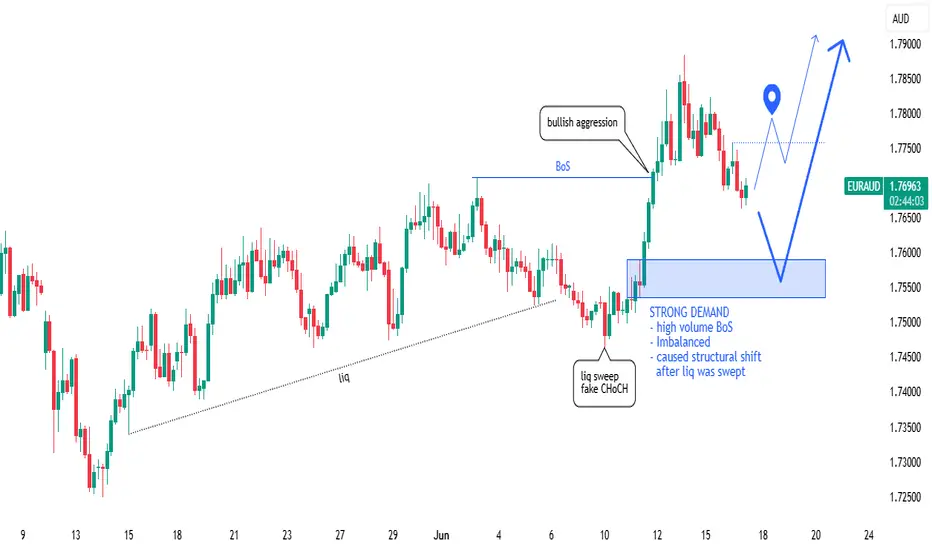
EURAUD Potential Longs - Technical Outlook 17.06.2025Overall Trend & Context:
FX:EURAUD has been in an overall uptrend since mid May when price reacted off a daily demand level.
Technical Findings:
Price is currently trading just above the discount (equilibrium).
Would prefer to see it drop into the discount area - There are areas of demand on the 1h chart which we could possibly consider however the 4h demand shown on the chart above qualifies as a STRONG zone to trade from.
Notes:
If we see a 15m shift in structure it may be worth getting involved.
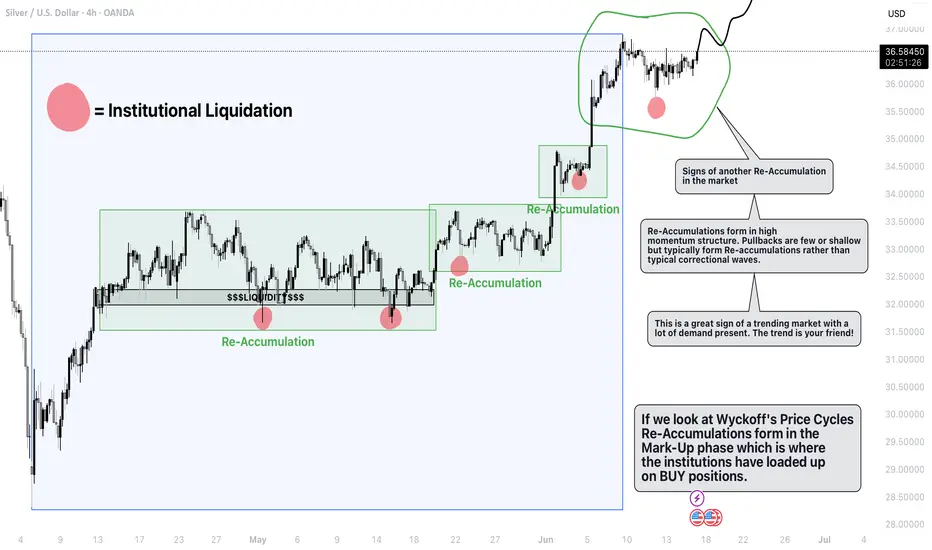
Silver (XAGUSD) Analysis - Market looking strong!Why?
I have been pro-actively trading this market over the last few weeks and months due to its strong bullish nature that it is showcasing. This market is trending very nicely and has delivered the perfect market conditions for me to go LONG. I know this because the impulsive waves are strong and are created with high volume. Rather than seeing typical corrections, we are seeing the formation of Re-Accumulations (stepping stones) to take price higher.
My Predictions
Price is showing no signs of wanting to slow down or stop. Therefore my bias remains Bullish. As of currently, we can see price has began to consolidate and enter the creation of another Re-Accumulation. Clearly with the red highlight, we can see price has liquidated the recent lows which is a sign that the institutions are getting involved. I am expecting price to continue bullish from here, to break the current market high and continue its next leg higher.
I will be looking to get involved once price reaches and breaks the 36.900 level
CONFLUENCES
- Sentiment is above 80% Bullish ( MentFX Sentiment Source )
- Swing lows are being protected
- The effect being created by the cause is strong (Wyckoff Theory)
- Demand is clearly in control
- We are in a mark-up phase of the Wyckoff price cycles (The best phase to go long)
- Given the political uncertainty around the dollar right now, more investors are looking to pump money into alternative assets e.g Gold and Silver.
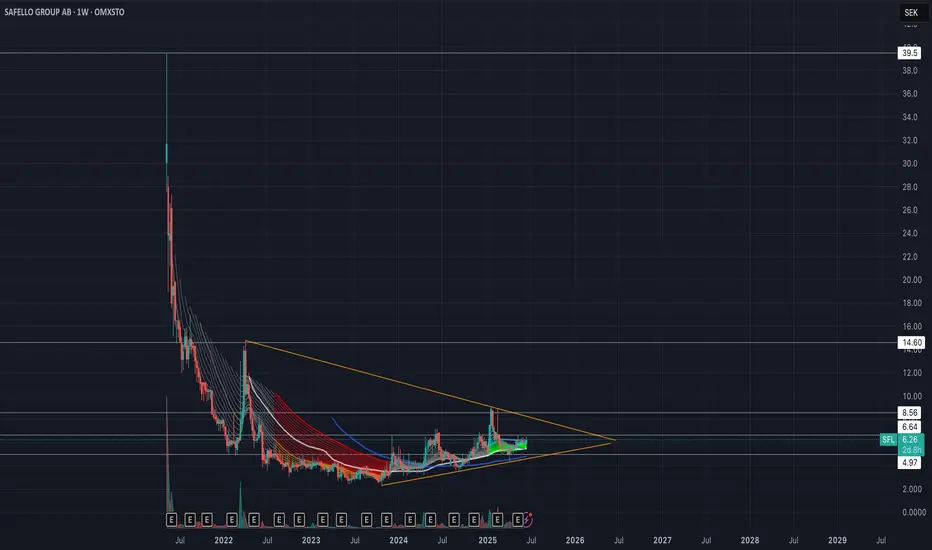
Safello Group AB - Bullish Outlook - Small Cap Crypto Firm Safello is starting to show signs of a breakout from its weekly triangle. If Bitcoin or altcoins start to show life, I believe this stock could outperform most crypto stocks. The company is constantly innovating its offerings and is regulated under Swedish law.
I have been DCA’ing into this stock for quite a while now and will continue to do so until the consolidation is over.
Current market cap is about 10 Million USD.
Nothing here should be considered financial advice. Always do your own research and make your own decisions.
OMXSTO:SFL
CRYPTOCAP:OTHERS
CRYPTOCAP:TOTAL
COINBASE:BTCUSD
NASDAQ:COIN
COINBASE:ETHUSD
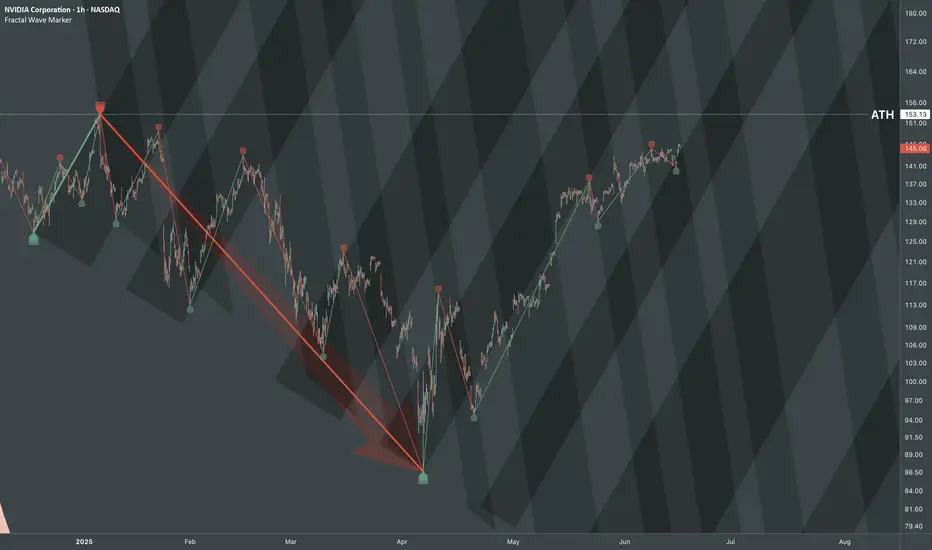
NVDA: Fractal Wave BreakdownBreaking above Rounding Top Pattern after rejections.
Wave transformed from pullback to impulsive one, which implies that the emerging structure needs to be routed to relative cycle.
Waveform
Referral structure looks like compressed version of decline after ATH.
As if the movement of big magnitude that pierces through SL levels, causes "shockwaves" that resets frequency of reversals of forthcoming waves.
Fibonacci interconnection of ATH and Bottom
Macromics Group: Market Trends Overview (June 2025)Global Economic Landscape: What Has Changed?
June 2025 marks significant shifts in the global economy. After several years of instability caused by the pandemic, inflation, and geopolitical tensions, markets are gradually stabilizing. However, new challenges are emerging: rising risks in Asia, digital transformation in Europe, and strategy shifts in the U.S.
China and India continue to show strong growth rates—5.8% and 6.5% respectively. Europe, by contrast, is lagging behind due to slow recovery and persistent inflation. The U.S. maintains a steady course driven by consumer spending and innovation, reporting 2.1% GDP growth.
Macromics Group continues to deliver in-depth analytics and strategies for clients seeking to understand and capitalize on these changes. We analyze trends across more than 120 industries, helping companies adapt and thrive.
Macroeconomics and Monetary Policy: A Shift Toward Stabilization
Financial regulators have begun cautiously lowering interest rates after the peaks of 2024. The U.S. Federal Reserve has dropped its rate to 4.5%, while the ECB has reduced its rate to 3.75%. This is made possible by a decline in inflation: 2.7% in the U.S. and 3.1% in the EU.
Meanwhile, developing nations like Turkey and Argentina are still grappling with high inflation. These countries risk falling behind the global recovery unless decisive steps are taken.
Overall, the global course is toward soft stabilization: interest rates remain high but steady. This creates favorable conditions for investment and long-term planning.
Financial Markets: From Caution to Moderate Optimism
Stock markets in June 2025 show mixed performance. U.S. indexes such as the S&P 500 and Nasdaq hit new highs, thanks to the booming tech sector. Stocks of companies involved in AI, quantum computing, and cybersecurity are particularly strong.
European markets are less active but relatively stable. Growth is limited by high costs, demographic issues, and the transition to ESG standards. In Russia and CIS countries, markets are under pressure due to sanctions, currency restrictions, and reduced investment.
On the currency front, the U.S. dollar and Chinese yuan dominate. The ruble is volatile, the euro is stable, and the yen is strengthening as a safe haven asset.
Technology: The Engine of New Markets
The main trend in 2025 is AI and automation. Companies are deploying neural networks in logistics, marketing, finance, and HR to cut costs and boost efficiency. Demand for AI professionals and developers is surging.
5G infrastructure has matured in most developed countries, unlocking new potential in IoT, telemedicine, and remote work. At the same time, quantum computing is advancing rapidly, with commercial solutions expected by 2026.
Macromics Group invests in next-generation analytical platforms, enabling clients to access real-time insights and forecast trends before they go mainstream.
Energy and Sustainability: ESG and the “Green” Shift
Energy markets have stabilized after the turbulence of 2024. Oil prices remain between $70–$85 per barrel—comfortable for both producers and consumers. Meanwhile, renewable energy—solar, wind, and hydrogen—is seeing record investment.
Corporations are increasingly reporting according to ESG standards. It’s not just a trend, but a new business reality. Investors demand transparency, consumers prefer socially responsible brands, and regulators impose mandatory reporting.
Macromics Group supports clients in transitioning to sustainable models by developing ESG strategies, assessing risks, and offering financial solutions.
Conclusion: Outlook for the Second Half of 2025
The first half of 2025 showed that markets are learning to operate in a new reality. The global economy is no longer chasing rapid growth, but adapting to volatility. Key focus areas are technology, sustainability, and smart resource management.
For businesses, this means quick adaptation, innovative thinking, and reliance on data-driven decisions. In this context, Macromics Group serves not just as an analyst but as a strategic partner.
Our recommendation: act proactively. In times of uncertainty, those who plan years ahead and use quality data will win.
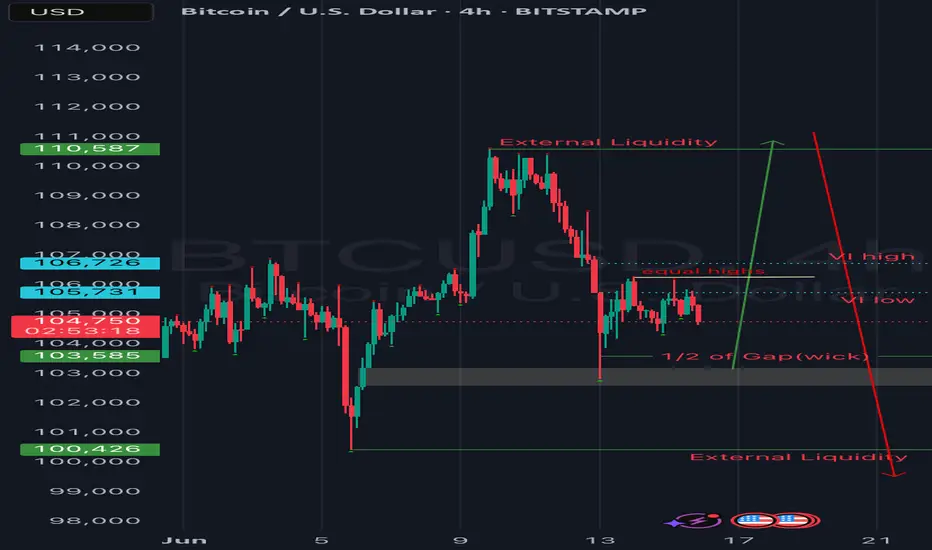
BTC update!!Good day traders, here is another update on BTC and I have adjusted my narrative but my overall bias is still remaining bearish…
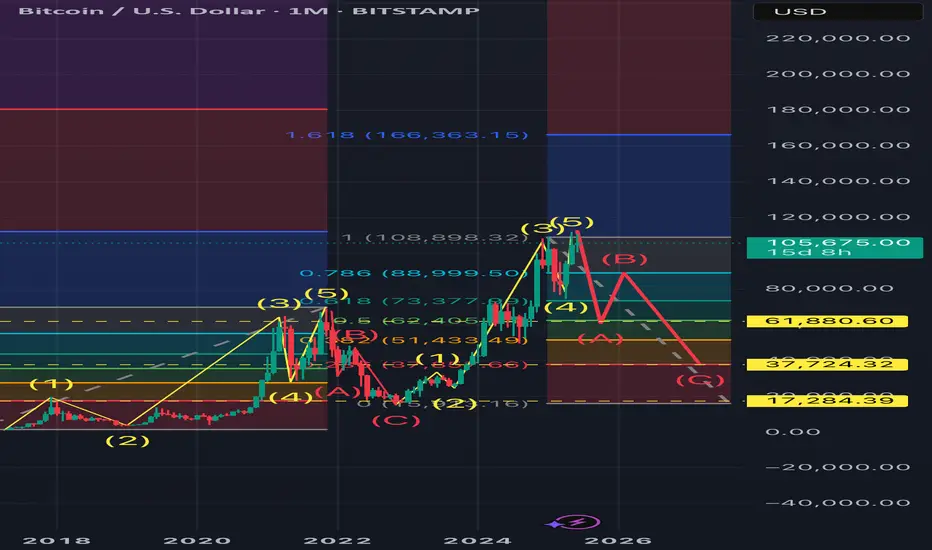
BITCOIN TOPPED. ELLIOT WAVE LONG Long term outlook of Bitcoin using EWT. I personally think Bitcoin has topped and the btc.d charts support it as well as the actual chart shown here. We’re beggining the massive correction as it did way back and I kept the ratios the same so after wave C next year or whenever, we can all buy btc at around 30k and ride the next waves up.
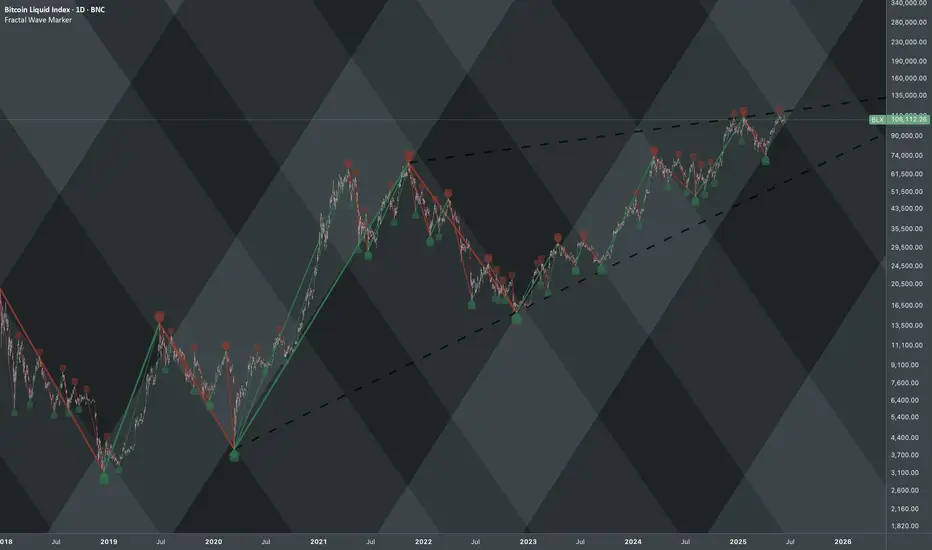
Bitcoin: Higher Degree Wave DimensionsA new long-term pattern has been identified. Essentially a stretched version of the chart shown here:
This resemblance holds to some extent, as the coordinates are anchored to relatively longer cycles:https://tradingview.sweetlogin.com/x/PUxSDlLx/
Publishing this one in raw form (intentionally minimal) just to document a recurring structure across extended timeframes.
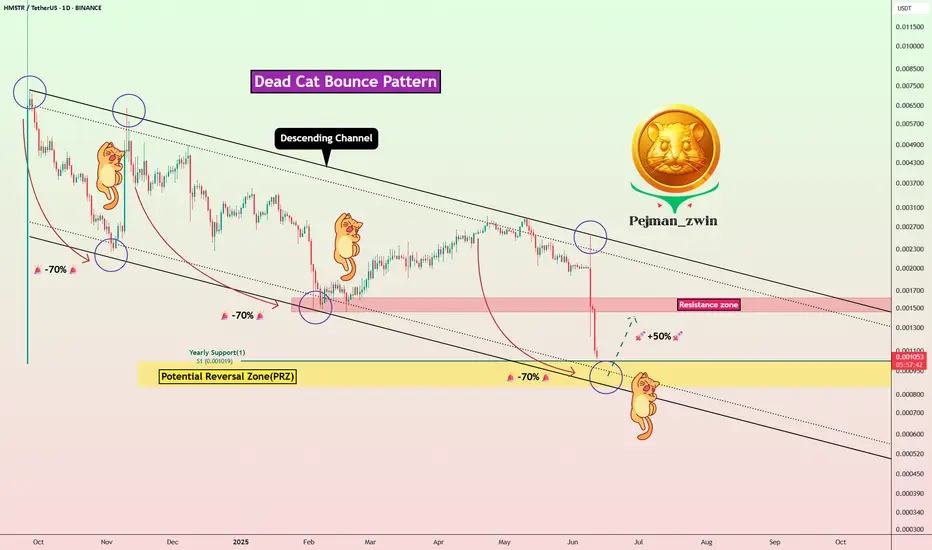
Dead Cat Incoming? HMSTR Eyes +50% Rebound Before Full MeltdownToday, let’s take a look back at HMSTR( BINANCE:HMSTRUSDT ), the token from the Telegram game Hamster Kombat .
While the game quickly gained global popularity and attracted massive user attention, it unfortunately seems to be failing — and may already be on the path to collapse .
Let’s break down some of the key reasons behind Hamster Kombat’s apparent failure :
Widespread Fake Airdrops & Scams:
In 2024–2025, Hamster Kombat became a major target for fake airdrop scams. These schemes tricked users into sharing private keys or signing malicious contracts, resulting in millions in losses. This shows the project lacked proper infrastructure to protect its community.
Unsustainable Tokenomics:
Despite publishing a whitepaper, the core economic model remains unclear. Relying only on a tap-to-earn mechanic without real utility or deflationary systems is not a viable long-term strategy.
Artificial Hype & Fake Engagement:
The project heavily depended on viral marketing and was flooded with bot-generated comments and fake testimonials, creating unrealistic expectations.
Lack of Transparency:
To this day, there is no clearly identified team or registered company behind the project, which is unusual for any serious crypto initiative.
Multiple Phishing Attacks & Fake Pages:
Many scam websites impersonated the project to steal user assets. The lack of strong, coordinated efforts from the team to prevent or warn users raises major concerns about security and credibility.
---------------------------------------------------------------------
Let's take a look at the HMSTR chart on the daily timeframe and see if this token can still be profited from !?
HMSTR token is trading near the lower line of the descending channel , Potential Reversal Zone(PRZ) , and Yearly Support(1) .
From a Classic Technical perspective and considering the fundamental conditions of the Hamster Kombat project , it seems that this project has succeeded in forming an Dead Cat Bounce Pattern .
In addition, in previous months , the cat of this Dead Cat Bounce Pattern would wake up and make a leap after every -70% decline .
I expect the HMSTR token to start rising again ( of course, a temporary increase ) and can increase its price by +50% .
Do you think the HMSTR chart cat will act again this time?
Note: If the HMSTR token goes to PRZ, we should expect more declines
Note: Please pay more attention to capital management in this analysis.
Please respect each other's ideas and express them politely if you agree or disagree.
Hamster Kombat Analyze (HMSTRUSDT), Daily time frame.
Be sure to follow the updated ideas.
Do not forget to put a Stop loss for your positions (For every position you want to open).
Please follow your strategy and updates; this is just my Idea, and I will gladly see your ideas in this post.
Please do not forget the ✅' like '✅ button 🙏😊 & Share it with your friends; thanks, and Trade safe.
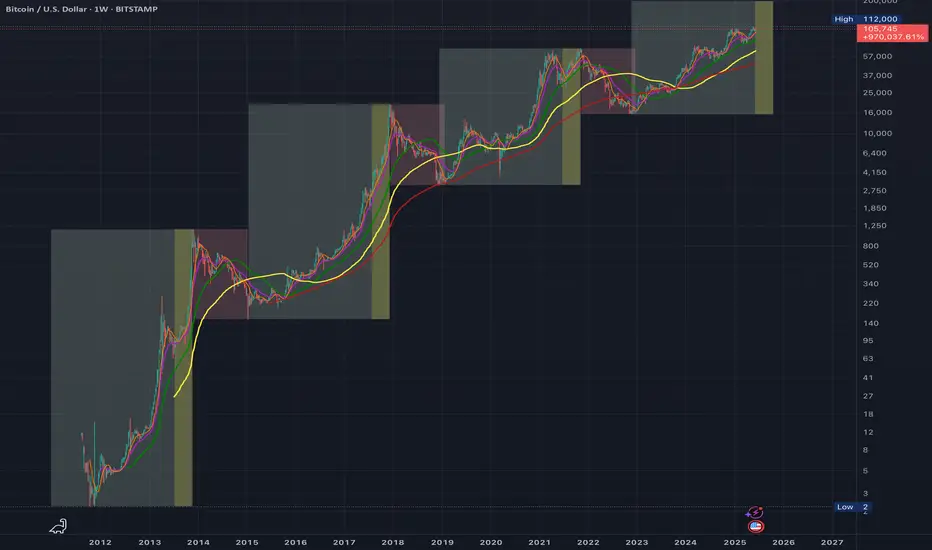
Bitcoin top on October 2025?To estimate the potential top date of the current Bitcoin bull market, we can analyze the timeframes of the previous two bull markets.
Simpel illustration of altcoin potential (30x)Connected some dots and we don't have to make it harder, the altcoin markets is picking up use cases and wit mature faster then we think, next FOMO will not only pull in corporate but the amount of people in crypto increases daily. I don't think anybody is ready for the next explosion.

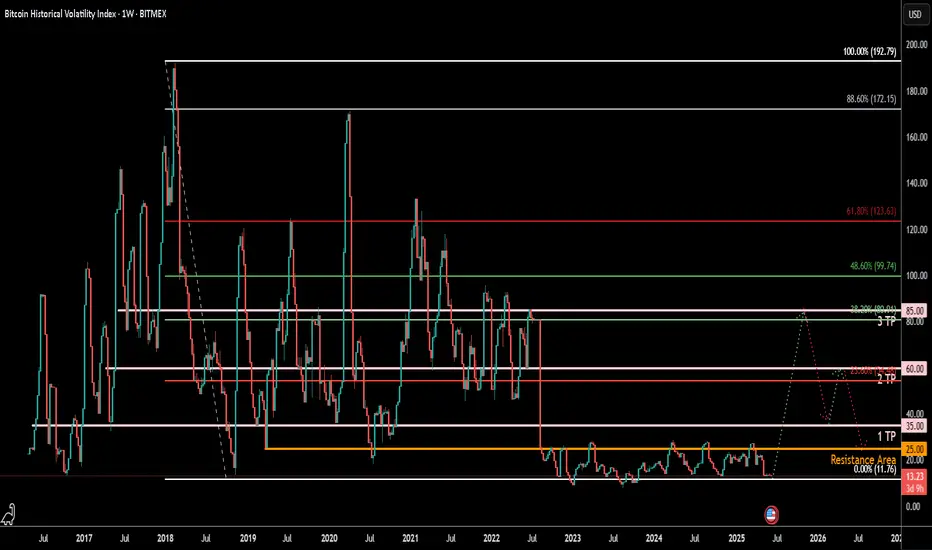
BVOL (Bitcoin Historical Volatility Index) Weekly TF 2025 Summary:
BVOL (Bitcoin Historical Volatility Index) remains compressed near historic lows. This analysis explores the potential for a volatility expansion cycle, key Fibonacci retracement levels, and how shifts in volatility may precede directional moves in BTC and the broader crypto market.
Chart Context:
Timeframe: Weekly (1W)
Current BVOL: ~13.23
Historical Support Zone: ~11.76–15 (consolidation base since 2022)
Resistance Area: ~25–35 (marked breakout threshold)
Fibonacci Retracement (from peak ~192.79):
23.6% = 56.17 → 2nd TP
38.2% = 89.01 → 3rd TP
48.6% = 99.74 → Intermediate fib zone
61.8% = 123.63 → Cycle expansion cap (potential BTC top region)
100% = 192.79 → All-time spike (rare volatility events)
Key Technical Observations:
Consolidation Floor: Since mid-2022, BVOL has hovered near extreme lows often a prelude to sharp directional moves.
Support-turned-Resistance: Past volatility surges often topped near fib clusters (23.6%, 38.2%, 61.8%). These will likely act as TP zones during volatility spikes.
Expected Path:
Base breakout above 25 → TP1 = 35
Acceleration phase → TP2 = 56–60
High volatility climax → TP3 = 85–89
Volatility Trend Commentary:
Current Phase: Low volatility compression, common in accumulation phases.
Volatility Expansion Signal: A break above the 25–35 band may signal the start of a high-volatility impulse (typically aligned with large BTC directional moves).
Dotted Paths on the chart reflect the two key expansion possibilities:
Straight rally up to TP3 (85)
Mid-stage pullback post-TP2 (bear trap scenario)
Macro Correlation:
BVOL vs BTCUSD: Historically, BVOL lows precede strong BTC trends — both bull and bear cycles.
BVOL vs BTC.D: BVOL surges often shift dominance; either BTC leads during volatility or altcoins rotate post-BTC move.
BVOL vs TOTAL / TOTAL2 / TOTAL3:
Volatility compression in BVOL is directly tied to range-bound TOTAL3.
Total:
Total2:
Total3:
BVOL expansion is often mirrored by strong TOTAL2 & TOTAL rallies.
Confluence seen between BVOL TP zones and critical fib levels in TOTAL charts.
Bias & Strategy Implication:
Volatility Expansion Expected: Current structure is unsustainable; expansion is highly probable in coming weeks/months.
Watch BTC Price Action: If BTC breaks key levels while BVOL rises → Confirmed trend.
Portfolio Strategy: Prepare for volatility-driven liquidation zones. Use BVOL to gauge position sizing and risk.
Notes & Disclaimers:
This analysis is part of the BitonGroup Macro Series.
BVOL is not a directional indicator but a volatility proxy. use in combination with price and dominance metrics.
Always combine volatility forecasts with proper stop-loss and leverage management.
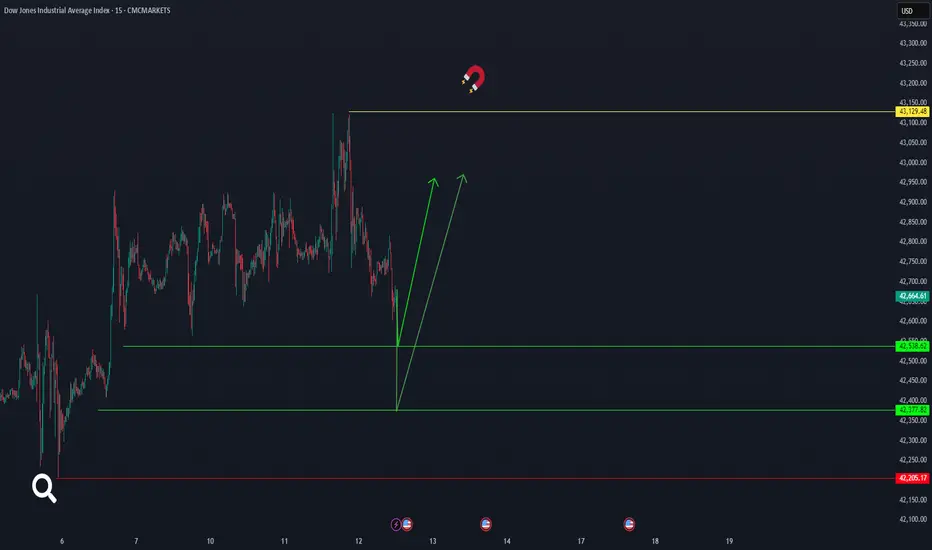
us30It seems that the Dow Jones will start moving again from the areas of 42377 or 42538 and the price will definitely reach 43129.48. Of course, the critical point is 42205. CMCMARKETS:US30
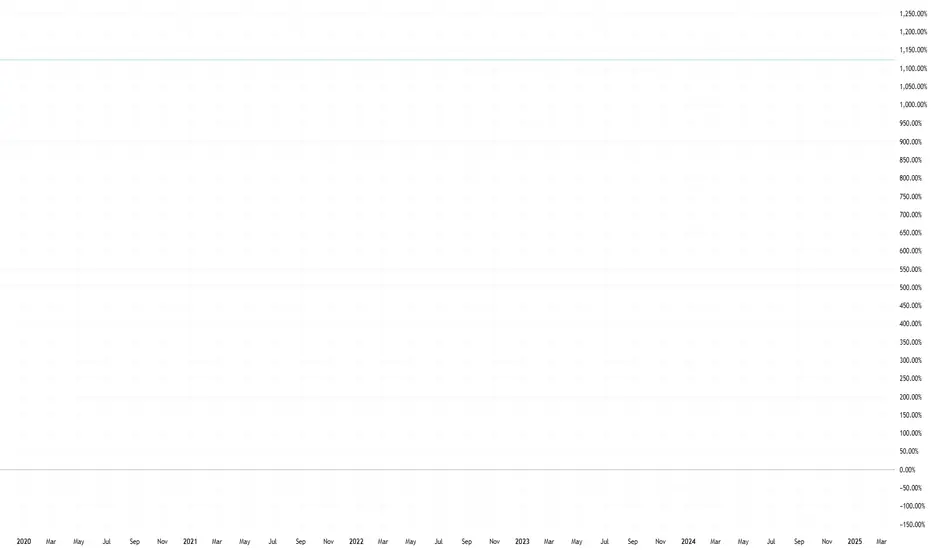
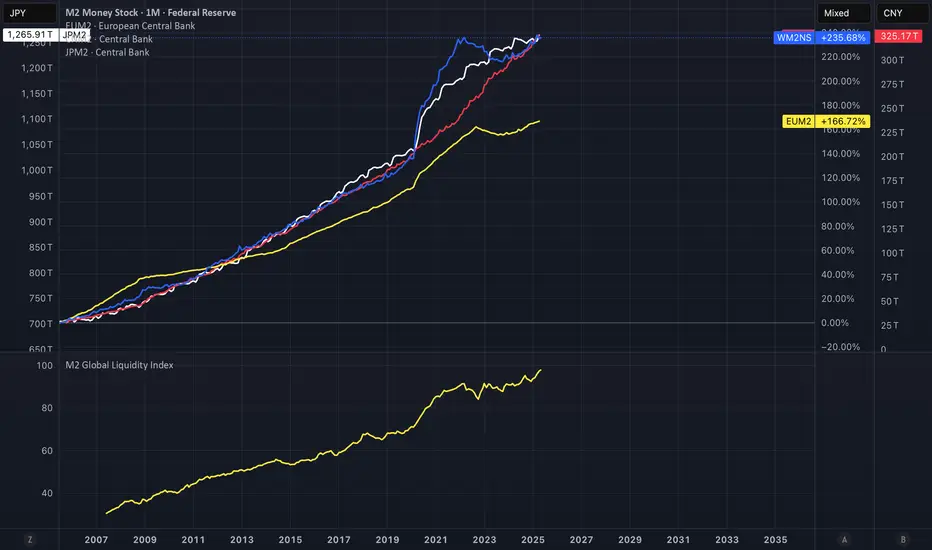
Global M2 Money SupplyWith more money than ever before in circulation available. Asset prices should go up..
Do you agree or disagree?
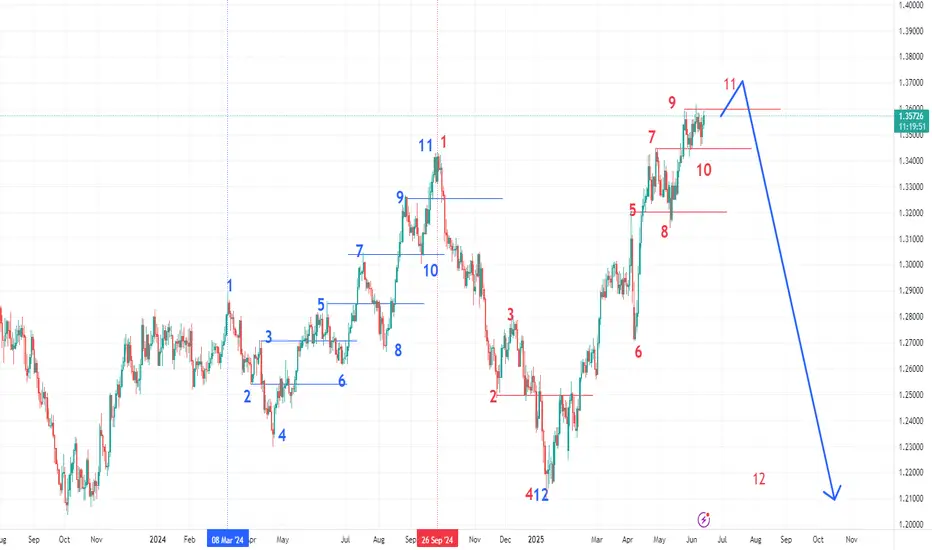
GBPUSD Daily Sequence Start march 2024 prince movement repeat in Sep 2024 on similar way
highs and lows are the same so we expect up to 11 point then drop to near point 4 (last TP) as what happened before.
IF crossed level of point 7 this conformation for dropdown start
what do you think ?
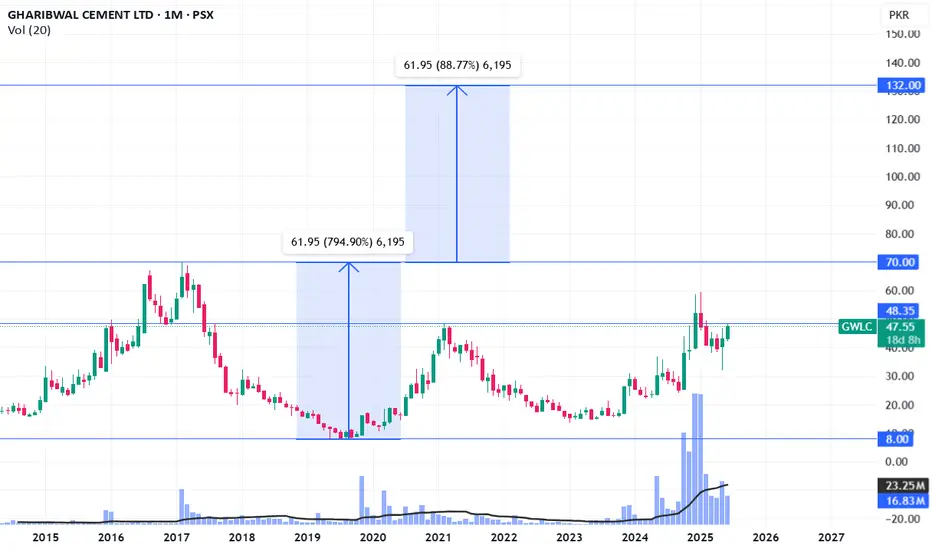
GWLC - About to have a breakoutGWLC tried to break its previous high but failed last time. Its again retesting it and hopefully will give breakout this time (48.35).
Then it may go to retest its all-time high (70). Ultimate target can be 132.
This is not a buy/sell call, just my own opinion.