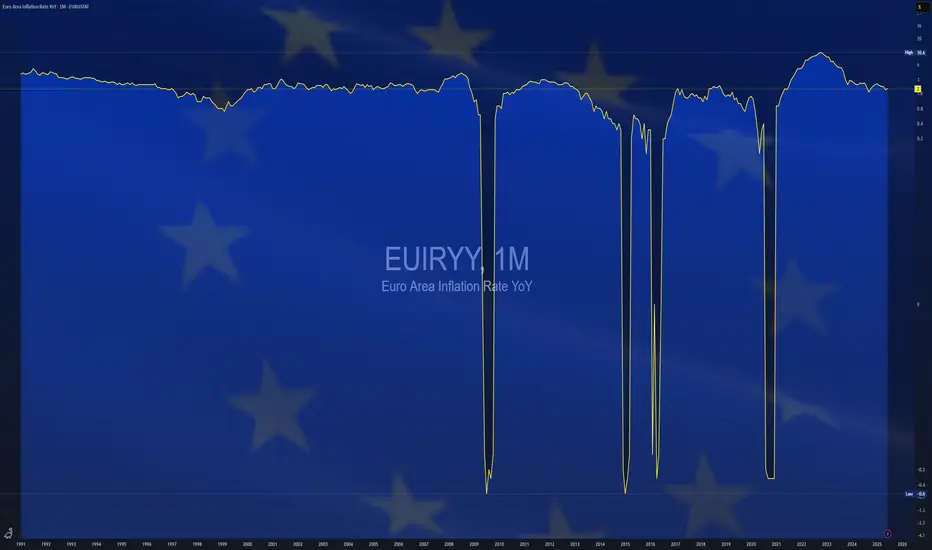
$EUIRYY -Europe CPI (July/2025)ECONOMICS:EUIRYY
July/2025
source: EUROSTAT
- Eurozone consumer price inflation held steady at 2.0% year-on-year in July 2025, unchanged from June but slightly above market expectations of 1.9%, according to preliminary estimates.
This marks the second consecutive month that inflation has aligned with the European Central Bank’s official target.
A slowdown in services inflation (3.1% vs 3.3% in June) helped offset faster price increases in food, alcohol & tobacco (3.3% vs 3.1%) and non-energy industrial goods (0.8% vs 0.5%).
Energy prices continued to decline, falling by 2.5% following a 2.6% drop in June.
Meanwhile, core inflation—which excludes energy, food, alcohol, and tobacco—remained unchanged at 2.3%, its lowest level since January 2022.
Economy
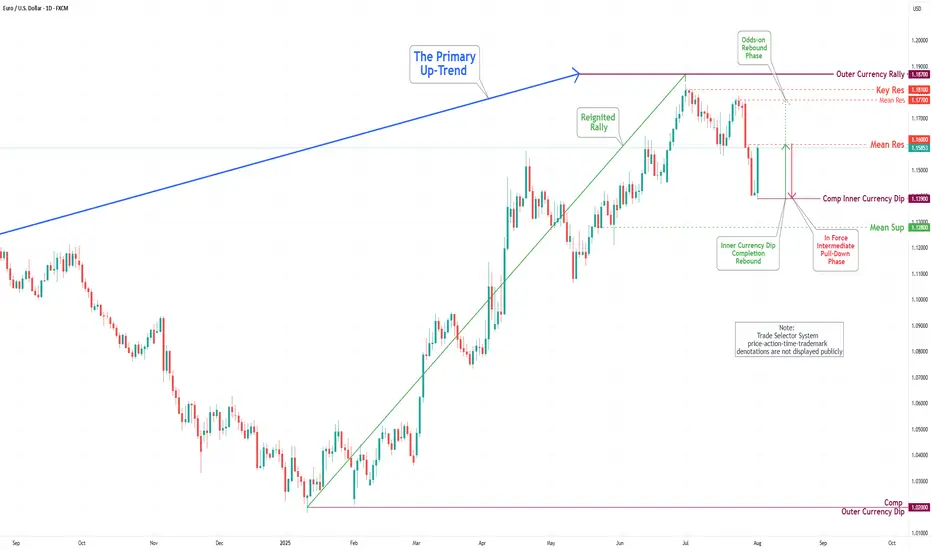
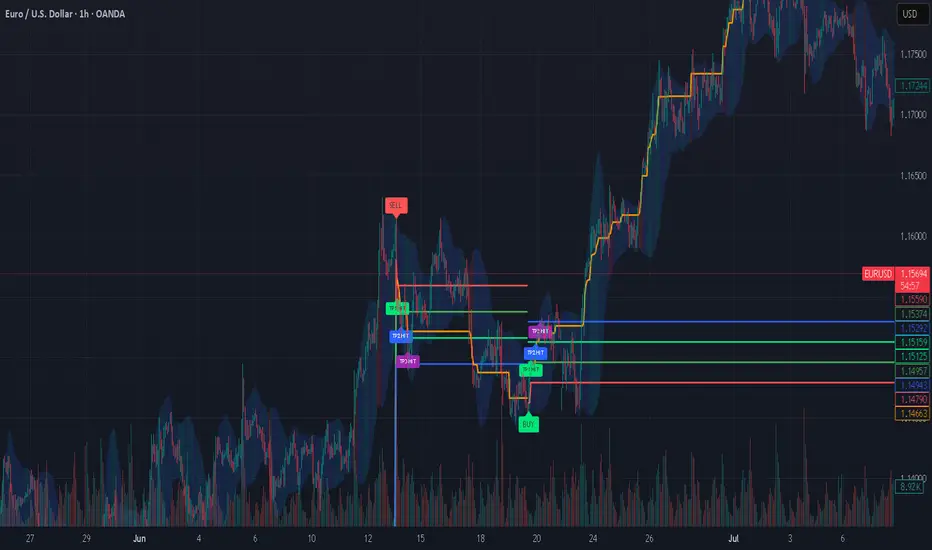
EUR/USD Daily Chart Analysis For Week of August 1, 2025Technical Analysis and Outlook:
In this week's trading session, the Euro experienced a significant drop, reaching the 1.139 level, and completing what is referred to as the Inner Currency Dip. As a result of the completion, the currency reversed direction and made a strong rebound, hitting the Mean Resistance level at 1.160. Recent analyses suggest that the Euro is likely to enter a sustained downward move after retesting the Mean Resistance at 1.160, with the target set to revisit the completed Inner Currency Dip at 1.139. However, it is essential to consider the possibility of continued upward momentum towards the Mean Resistance level of 1.177. Such a movement could trigger a significant rebound and lead to the completion of the Outer Currency Rally at 1.187.
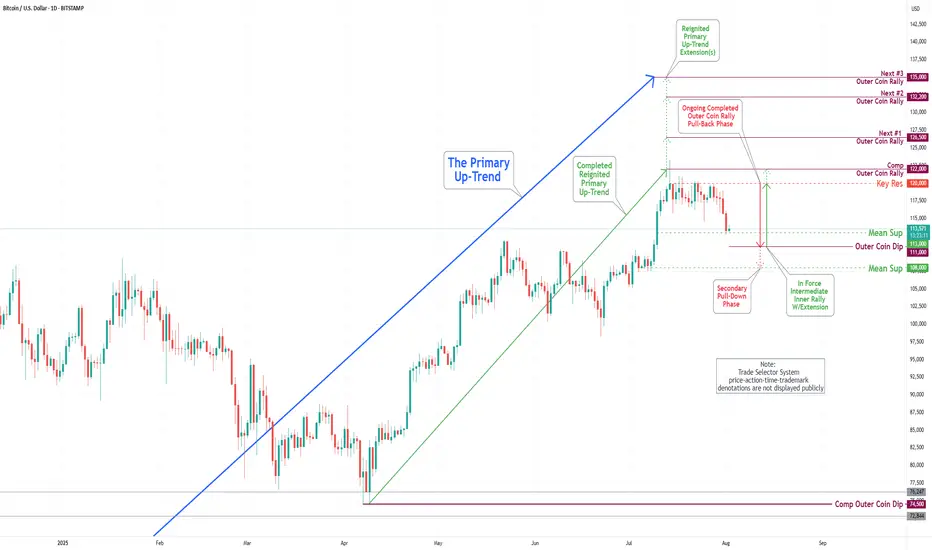
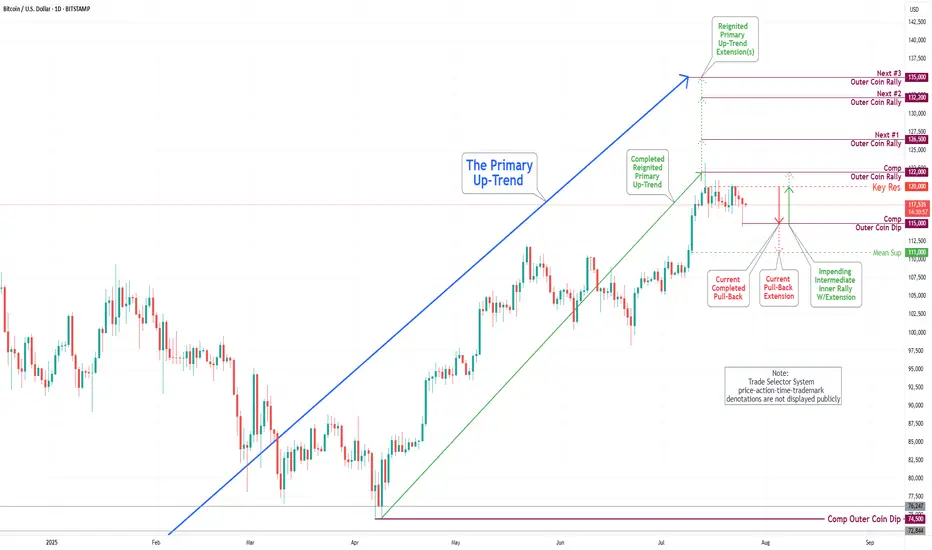
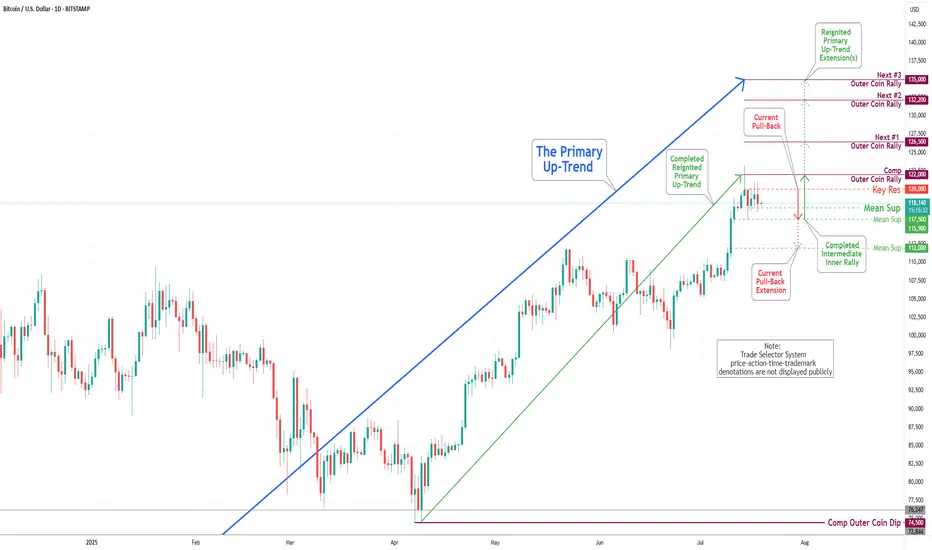
Bitcoin(BTC/USD) Daily Chart Analysis For Week of August 1, 2025Technical Analysis and Outlook:
In this week's trading session, the Bitcoin market experienced a notable pullback. The primary reason for this movement was the Key Resistance level, which led to a decline that reached our Mean Support level of 113000. This anticipated pullback is prompting the completion of the Outer Coin Dip target of 111000, with a strong likelihood of moving towards the Mean Support level of 108000.
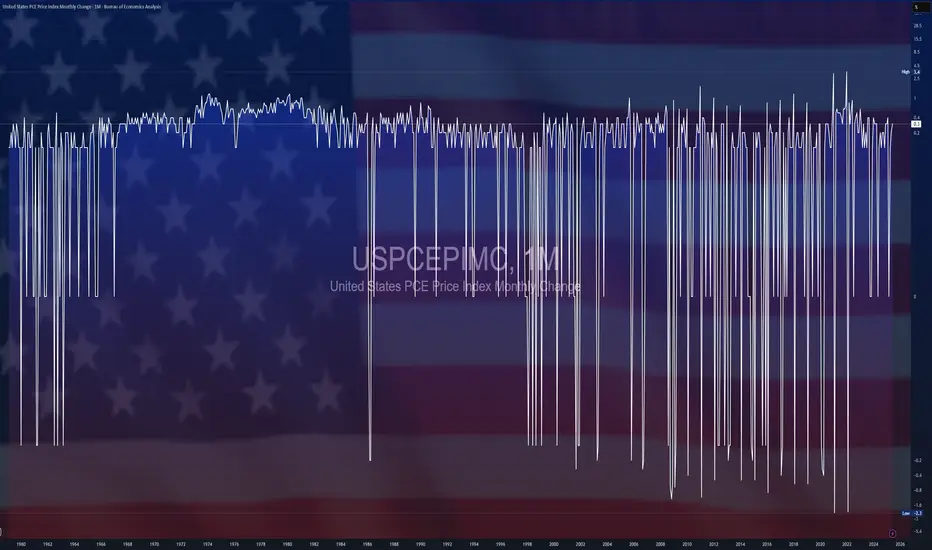
$USPCEPIMC -U.S PCE Prices Rise (June/2025)ECONOMICS:USPCEPIMC
June/2025
source: U.S. Bureau of Economic Analysis
- The US PCE price index rose by 0.3% mom in June, the largest increase in four months, and in line with expectations, led by prices for goods.
The core PCE index also went up 0.3%, aligning with forecasts.
However, both the headline and core annual inflation rates topped forecasts, reaching 2.6% and 2.8%, respectively.
Meanwhile, both personal income and spending edged up 0.3%.
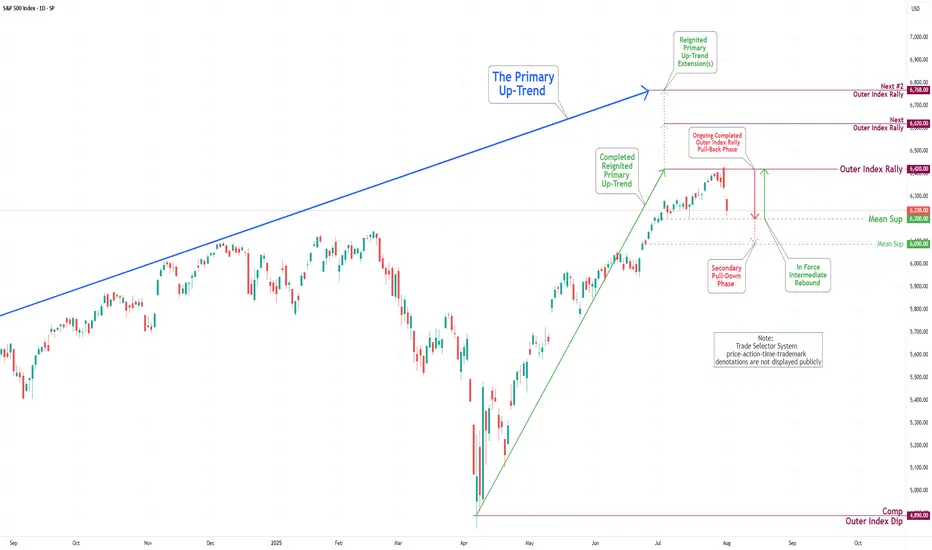
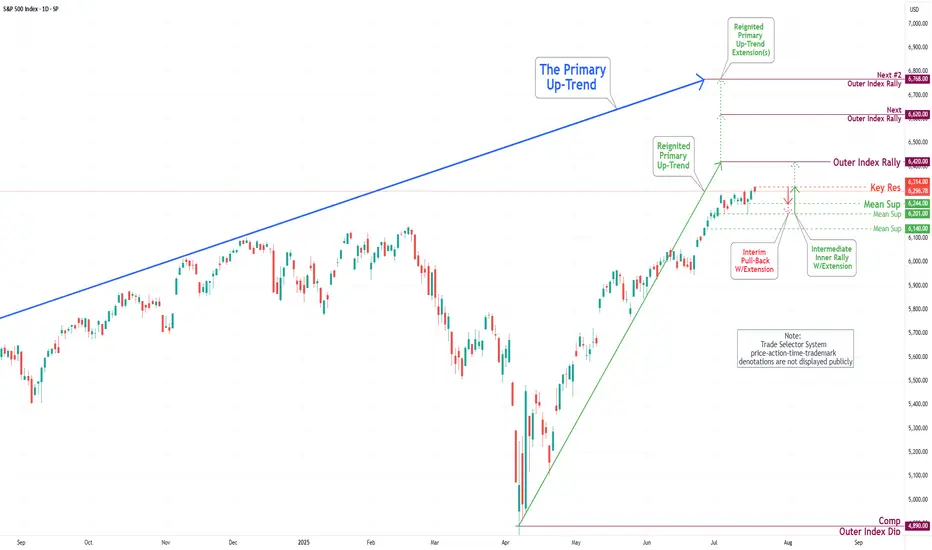
S&P 500 Daily Chart Analysis For Week of August 1, 2025Technical Analysis and Outlook:
During the trading activity of the previous week, the S&P 500 Index displayed a predominantly bearish movement after completing our Outer Index Rally target of 6420, as highlighted in the prior week’s Daily Chart Analysis, with the primary objective now being to plug our Mean Support at 6200.
It is essential to recognize that the current price movement may trigger a significant further pullback to the Mean Support level of 6090. Following this downturn, it is expected that the index will resume its upward momentum, aiming for a retest of the Outer Index Rally peak at 6420.
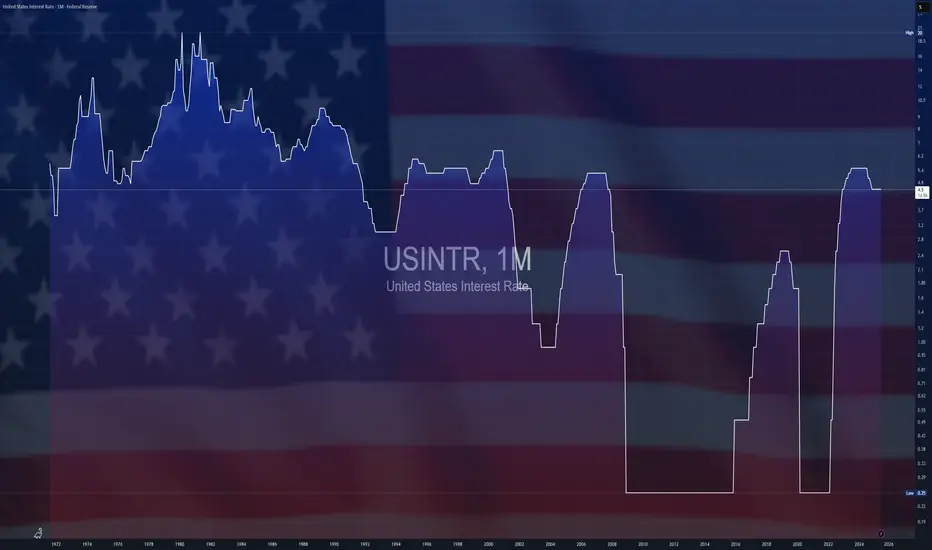
$USINTR -Feds Leaves Rates Steady (July/2025)ECONOMICS:USINTR
July/2025
source: Federal Reserve
- The Federal Reserve held rates steady at 4.25%–4.50% for a fifth straight meeting, defying President Trump’s demands for cuts even after positive GDP growth .
Still, two governors dissented in favor of a cut—the first such dual dissent since 1993.
Policymakers observed that, fluctuations in net exports continue to influence the data, and recent indicators point to a moderation in economic activity during the first half of the year.
The unemployment rate remains low, while Inflation somewhat elevated.
$EUGDPQQ -Europe GDP (Q2/2025)ECONOMICS:EUGDPQQ
Q2/2025
source : EUROSTAT
- The Gross Domestic Product (GDP) In the Euro-Area expanded 0.10 percent in the second quarter of 2025 over the previous quarter.
GDP Growth Rate in the Euro Area averaged 0.37 percent from 1995 until 2025, reaching an all time high of 11.60 percent in the third quarter of 2020 and a record low of -11.10 percent in the second quarter of 2020.

Gold - Powerful RunAfter its powerful run, gold has shown signs of fatigue, stalling near technical resistance between $3,330–$3,350 per ounce in late July. Analysts warn that while the bullish trend remains intact on a structural level, daily volatility is high and some profit-taking or consolidation could continue unless new destabilizing events emerge.
Will the Rally Continue?
The Bull Case
Structural Demand: Multiple sources, including J.P. Morgan and other major forecast groups, predict gold’s structural bull case remains strong with average prices of $3,220–$3,675 per ounce likely through the end of 2025, and even $4,000 possible by 2026.
Ongoing Uncertainty: Persistent geopolitical risks, trade disputes, and fiscal pressures are expected to maintain robust safe haven flows into gold.
Central Bank and Asian Demand: Sustained buying by central banks and consumers in Asia could provide a solid floor below current levels.
The Bear Case
Interest Rate Dynamics: If central banks, especially the US Federal Reserve, hold or increase interest rates, gold could lose momentum, higher rates increase the opportunity cost of holding non yielding bullion.
Diminishing New Risks: Unless fresh economic or geopolitical shocks appear, further upside may be capped in the near term. Several experts predict gold may consolidate or trade sideways pending new catalysts.
Speculator Flows: Rapid speculative bets could lead to sharp corrections, particularly on technical breakdowns after such a strong rally.
Conclusion
The gold rally of 2025 has been driven by an unusual mix of global volatility, central bank behavior, and shifting investor psychology. While prices could pause or pull back in the coming months, the fundamental supports structural demand, central bank buying, and persistent global risks, suggest that the broader gold bull cycle is not yet over, with $3,000+ likely forming the new base for gold as we look toward 2026.
*NOT INVESTMENT ADVICE*
#gold #safehaven #uncertainty #economy #finance #trading #indicator

Should You Still Sell Your USD for EUR? A 2025 PerspectiveWith currency markets in constant flux, the decision to hold USD or convert to EUR carries major financial implications for investors, expatriates, businesses, and frequent travelers. As of July 29, 2025, the USD/EUR exchange rate is around 0.86–0.87, with $1 buying roughly €0.86. Is now the right time to sell your US dollars for euros? Here’s a balanced look at the latest data and forecasts.
Current Market Context: Dollar Weakness and Euro Stabilization
USD Slide in 2025: The US dollar has experienced its steepest decline in over three years, falling nearly 10% year-to-date. This sustained weakness is attributed to policy volatility, capital flowing out of the US, and narrowing interest rate differentials.
Key Exchange Rate: Recent rates hover between 0.85 and 0.87, representing moderate stability following a period of volatility.
Euro’s Resilience: While the euro has had its own struggles, from slower economic growth to political uncertainty in Germany and France, analysts forecast no major sustained fall for the euro through 2025.
2025 Forecasts: USD/EUR Direction—What Do the Experts Say?
Year-End 2025 Outlook: Major banks and forecasting firms expect the EUR/USD rate could climb even higher by year-end, meaning the euro could gain modestly versus the dollar if current trends continue.
Factors to Watch:
Fed Rate Cuts: Potential US rate cuts in Q3–Q4 remain a key driver for further USD weakness.
Trade & Tariff Uncertainty: Ongoing US tariff announcements and global trade tensions add volatility but also support safe haven flows to the dollar.
Eurozone Politics: Any resolution of political uncertainty in Europe could buoy the euro.
Most Important One: Fed's Money Printer...
Strategic Considerations: Should You Sell Now?
Locking in Current Rates: If you need euros to make payments, pay salaries, or make investments in the short term, converting a portion now could reduce your exposure to further USD downside.
If You Can Wait: Analysts see some chance for USD recovery in late Q3 or early 2026, but this is contingent on US policy stability and Fed decisions.
Averaging In: For larger transfers, consider splitting your transaction over time (also called dollar-cost averaging), which can help mitigate volatility.
Bottom Line
If you have an immediate need for euros, current rates present a reasonable opportunity. The dollar’s weakness throughout 2025 is well documented, but much of the pessimism may already be priced in. If you’re flexible with timing, monitor central bank policy signals throughout Q3/Q4, a more dovish Fed or unexpected eurozone stability could push rates further in your favor, but event risks remain elevated. Ultimately, a phased or hedged approach may offer both protection and potential upside
*not investment advice*
#forex #fx #dollar #usd #euro #eur #economy #trade #tariff #trading #indicator
S&P 500 Daily Chart Analysis For Week of July 25, 2025Technical Analysis and Outlook:
In the trading activity observed last week, the S&P 500 Index exhibited a predominantly upward trajectory. It traded around the Key Resistance level of 6314. It successfully broke through this level, with the primary objective being to complete the Outer Index Rally at 6420, as outlined in the previous week's Daily Chart Analysis.
It is crucial to acknowledge that the current price movement may prompt a substantial pullback following the completion of the Outer Index Rally, with the main target identified as the Mean Support level of 6309. Following this potential downward adjustment, it is anticipated that the index will resume its upward trend, targeting a retest of the forthcoming completion of the Outer Index Rally at 6420.

Bitcoin(BTC/USD) Daily Chart Analysis For Week of July 25, 2025Technical Analysis and Outlook:
In the trading session of the previous week, the Bitcoin market exhibited considerable volatility as it retested the Key Resistance level at 120000. On the lower end of the spectrum, the market engaged with the Mean Support levels at 117500 and 115900, culminating in the completion of the Outer Coin Dip at 115000. Currently, the coin is poised to retest the Key Resistance at 120000 once again. This anticipated rebound will necessitate a retest of the completed Outer Coin Rally at 122000. The additional target levels for the renewed Primary Up-Trend are 126500, 132200, and 135000.
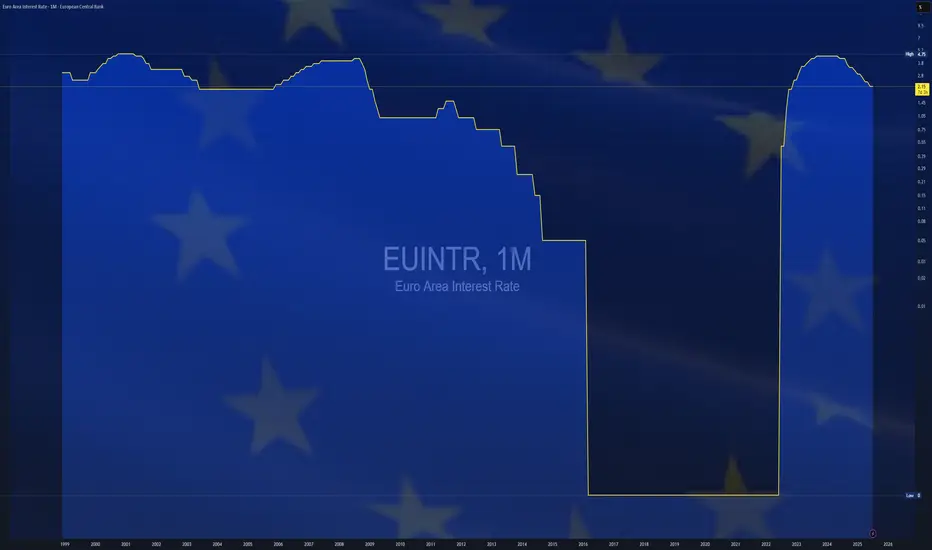
$EUINTR - Europe Interest Rates (July/2025)ECONOMICS:EUINTR
July/2025
source: European Central Bank
- The ECB kept interest rates unchanged in July, effectively marking the end of its current easing cycle after eight cuts over the past year that brought borrowing costs to their lowest levels since November 2022.
The main refinancing rate remains at 2.15%, while the deposit facility rate holds at 2.0%. Policymakers struck a wait-and-see stance, as they evaluate the impact of lingering trade uncertainty and the potential fallout from proposed US tariffs on economic growth and inflation.
Inflation hit the ECB’s 2% target in June, adding to the case for a pause in policy adjustments. Speaking at the ECB press conference, President Lagarde said the central bank is “in a good place” but acknowledged the difficulty in assessing how tariffs will affect price outlooks, given the mix of both inflationary and disinflationary pressures.
On the recent euro appreciation, Lagarde reiterated that the ECB does not target exchange rates directly but considers them when forecasting inflation.
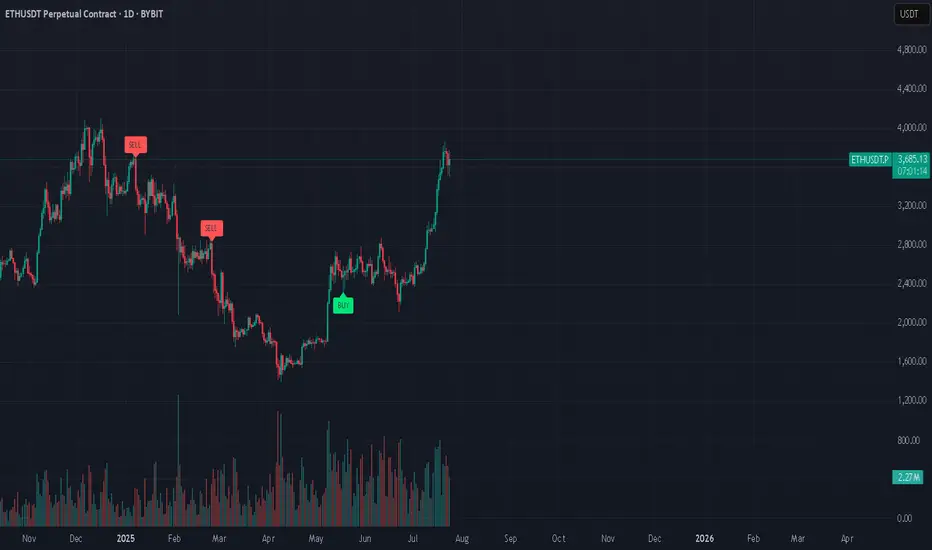
Huge Bear Trap next in line??Ethereum Exit Queue: 518,180 ETH
Half a million ETH is currently queued for unstaking on Ethereum...
Keep in mind, August 1st, Trump's Reciprocal Tariffs get in effect
Everyone's talking about BTC's new ATH, ETH's rally, XRP new ATH, but no one is talking about August 1st...
Manipulation is taking place. Stay safe, because a huge bear trap might be next in line (BTC back to 90K)
*NOT INVESTMENT ADVICE*
#crypto #ethereum #eth #btc #bitcoin #trading #xrp #trump #tariff #finance #economy
Tariffs incoming...July 23: Markets are booming.
August 1st: Tariffs.
I'm just saying, it might be a nice discount...
#market #finance #tariff #trump #crypto #forex #stocks #economy #trading
$AMTX spill the teaThis is a circular biofuel company has an excellent executive team that has delivered on what's promised quarter after quarter. The stock hasn't mooned, but the regulatory environment has shifted more in their favor and not less these past turbulent months.

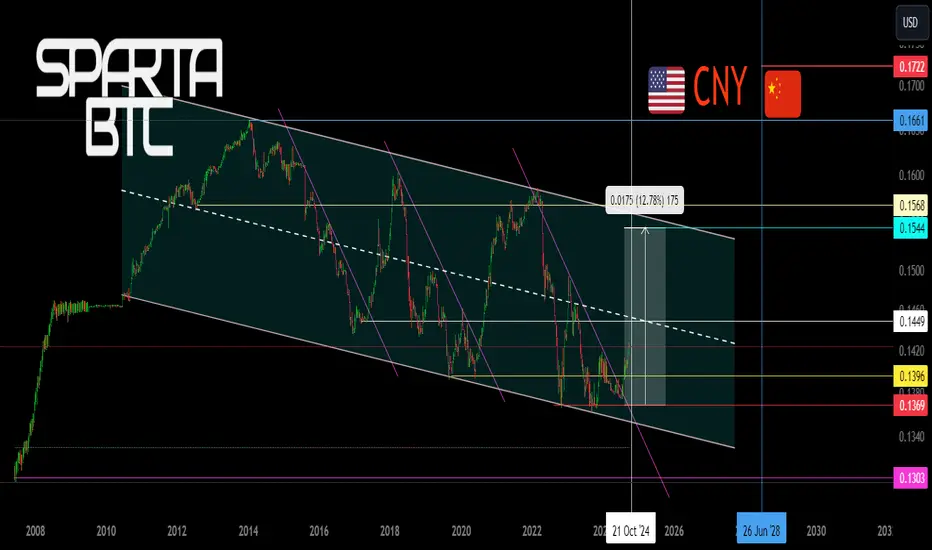
CNY/USD Trend since 06 2007. Channel. Reversal zone.Logarithm. Time frame 1 week. At the moment, the currency is stronger than the dollar.
The main trend is a descending channel. The price is in it now.
Secondary trend — breakout of the descending trend line. Price growth to the median of the channel, and in case of its breakthrough, to the resistance. If not, then a pullback to the lower zone of the channel.
Local trend — The nearest events and news background, which can affect (not necessarily) locally (movements to the median of the channel, i.e., the middle, if it is positive) on the yuan rate. This, in less than 1 month, namely from October 22 to 24, 2024 will be held 7.16 XVI BRICS summit (short for Brazil, Russia, India, China, South Africa) in Russia in Kazan.
Line graph for visualization.
S&P 500 Daily Chart Analysis For Week of July 18, 2025Technical Analysis and Outlook:
During the current trading week, the S&P 500 Index has demonstrated a predominantly upward trajectory. It has successfully retested the Mean Support level at 6200 and established a new Key Resistance level at 6314. Currently, the index displays a bullish sentiment, with the objective for the Outer Index Rally set at 6420.
Nevertheless, it is essential to recognize that the current price action may result in a decline, potentially leading to a retest of the Mean Support at 6244 and extending to the Mean Support at 6201. Following this potential downward movement, it is anticipated that the index will resume its upward trend, driving the price action towards the Key Resistance level at 6314 and ultimately achieving the Outer Index Rally target of 6420.
EUR/USD Daily Chart Analysis For Week of July 18, 2025Technical Analysis and Outlook:
In the current trading session, the Euro has continued its decline, completing our Mean Support level of 1.160. Recent analyses indicate that the Euro is likely to experience a sustained downward trend, with an anticipated retest at the Mean Support level of 1.159 and a possible further decline to reach a Currency Dip of 1.152. Nevertheless, it is crucial to consider the potential for a dead-cat bounce toward the Mean Resistance level of 1.167, which could trigger a significant reversal of the downtrend and target a Currency Dip of 1.152.

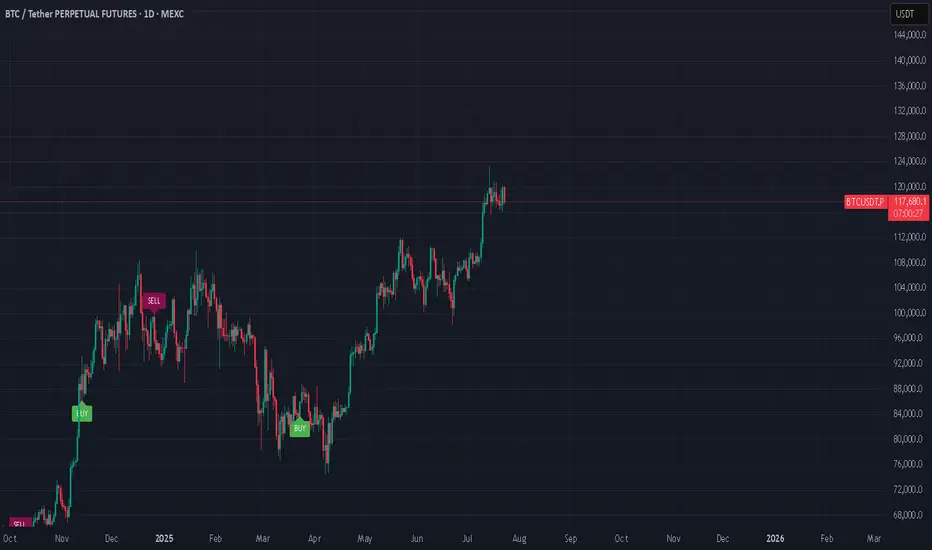
Bitcoin(BTC/USD) Daily Chart Analysis For Week of July 18, 2025Technical Analysis and Outlook:
In last week's trading session, we achieved a new historical high by completing our Outer Coin Rally at 122000. Following this milestone, the coin retraced, as expected, to the newly established Mean Support at 115900 and is currently trading at the Intermediate Mean Support at 117500. Presently, the coin is set to retest the Mean Support at 115900, with the potential for a further pullback to the Mean Support at 112000. This anticipated decline will necessitate a retest for the completed Outer Coin Rally at 122000. The designated targets for the renewed Primary Up-Trend are 126500, 132200, and 135000.
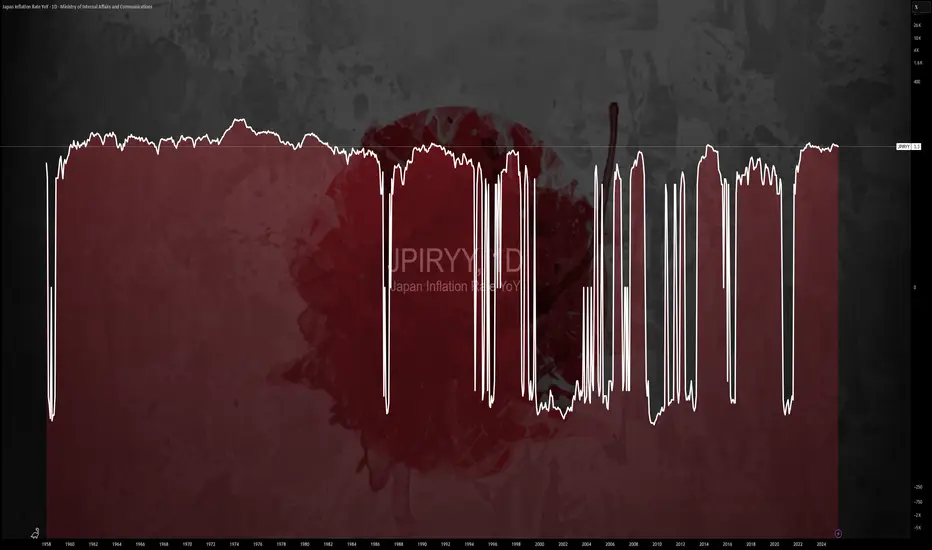
$JPIRYY -Japan Inflation Hits 7-Month Low (June/2025)ECONOMICS:JPIRYY 3.3%
June/2025
source: Ministry of Internal Affairs & Communications
-Japan’s annual inflation rate eased to 3.3% in June 2025 from 3.5% in May, marking the lowest reading since last November, as a sharp slowdown in electricity and gas prices offset persistent upward pressure from rice.
Core inflation also matched the headline rate at 3.3%, pointing to a three-month low and aligning with expectations.
$GBIRYY - U.K Inflation Rises to a 2024 High (June/2025)ECONOMICS:GBIRYY
June/2025
source: Office for National Statistics
- The annual inflation rate in the UK rose to 3.6% in June, the highest since January 2024, up from 3.4% in May and above expectations that it would remain unchanged.
The main upward pressure came from transport prices, mostly motor fuel costs, airfares, rail fares and maintenance and repair of personal transport equipment.
On the other hand, services inflation remained steady at 4.7%.
Meanwhile, core inflation also accelerated, with the annual rate reaching 3.7%.

$USIRYY -U.S Inflation Rate Seen Rising for 2nd Month (June/2025ECONOMICS:USIRYY
June/2025
source: U.S. Bureau of Labor Statistics
- The annual inflation rate in the US likely accelerated for the second consecutive month to 2.7% in June, the highest level since February, up from 2.4% in May.
On a monthly basis, the CPI is expected to rise by 0.3%, marking the largest increase in five months.
Meanwhile, core inflation is projected to edge up to 3% from 2.8%. Monthly core CPI is also anticipated to climb 0.3%, up from 0.1% in May, marking its sharpest increase in five months.

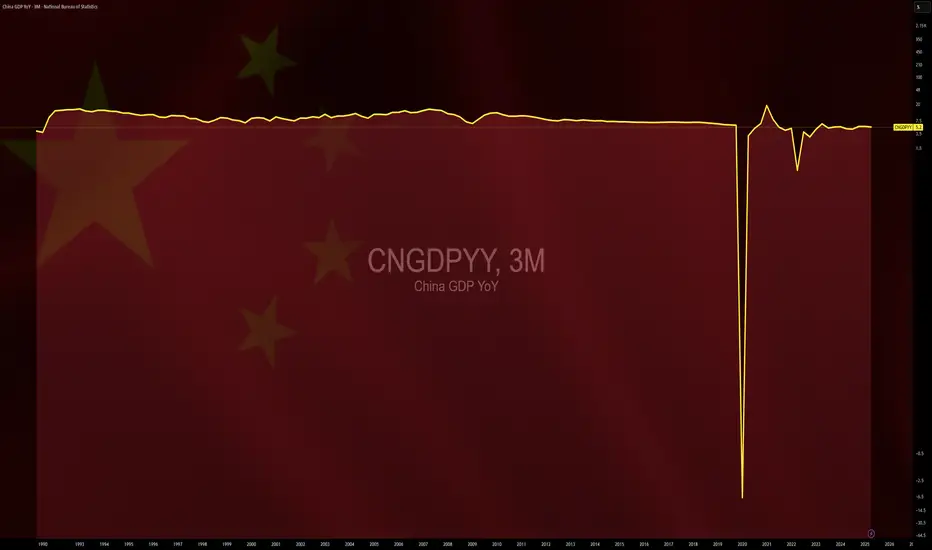
$CNGDPYY -China GDP Growth Slows Less Than Expected (Q2/2025)ECONOMICS:CNGDPYY
Q2/2025
source: National Bureau of Statistics of China
- China’s economy expanded 5.2% yoy in Q2 2025, easing from 5.4% in the prior two quarters and marking the softest pace since Q3 2024.
Still, the latest reading narrowly beat estimates of 5.1%, supported in part by Beijing’s policy measures amid a fragile trade truce.
Growth momentum in H2 is projected to weaken further, due to headwinds from trade tensions, deflation risks, and a prolonged property slump.