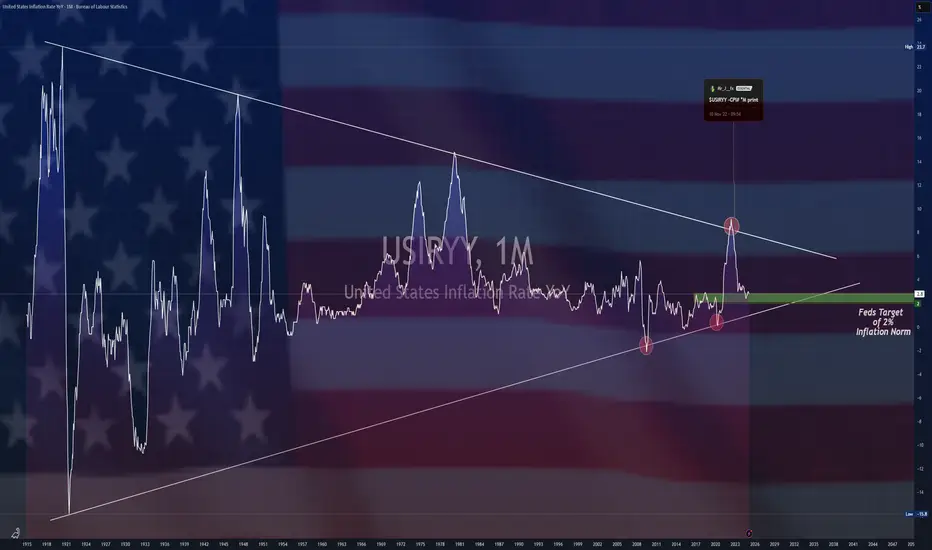
$USIRYY -United States CPI (March/2025)ECONOMICS:USIRYY
(March/2025)
source: U.S. Bureau of Labor Statistics
- The annual inflation rate in the US eased for a second consecutive month to 2.4% in March 2025, the lowest since September, down from 2.8% in February, and below forecasts of 2.6%.
Prices for gasoline (-9.8% vs -3.1%) and fuel oil (-7.6% vs -5.1%) fell more while natural gas prices soared (9.4% vs 6%).
Inflation also slowed for shelter (4% vs 4.2%), used cars and trucks (0.6% vs 0.8%), and transportation (3.1% vs 6%) while prices were unchanged for new vehicles (vs -0.3%).
On the other hand, inflation accelerated for food (3% vs 2.6%).
Compared to the previous month, the CPI decreased 0.1%, the first fall since May 2020, compared to expectations of a 0.1% gain.
The index for energy fell 2.4%, as a 6.3% decline in gasoline more than offset increases in electricity (0.9%) and natural gas (3.6%).
Meanwhile, annual core inflation eased to 2.8%, the lowest since March 2021, and below forecasts of 3%.
On a monthly basis, the core CPI edged up 0.1%, below expectations of 0.3%.
Economy
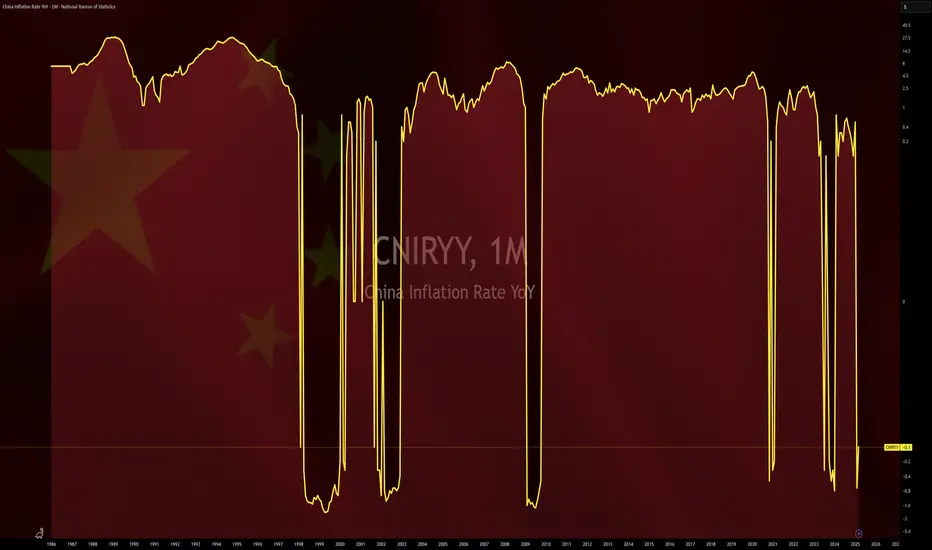
$CNIRYY -China's CPI (March/2025)ECONOMICS:CNIRYY
March/2025
source: National Bureau of Statistics of China
- China's consumer prices fell by 0.1% year-on-year in March 2025, missing market expectations of a 0.1% increase and marking the second consecutive month of drop, as the ongoing trade dispute with the U.S. threatens to exert further downward pressure on prices.
Still, the latest drop was significantly milder than February’s 0.7% fall, supported by a smaller decline in food prices as pork prices accelerated and fresh fruit costs rebounded.
Meanwhile, non-food prices rose by 0.2%, reversing a slight dip of 0.1% in February, driven by increases in housing (0.1% vs 0.1%), healthcare (0.1% vs 0.2%), and education (0.8% vs -0.5%), despite a continued decline in transport costs (-2.6% vs -2.5%).
Core inflation, which excludes volatile food and fuel prices, rose 0.5% in March, rebounding from a 0.1% decrease in February. On a monthly basis, the CPI declined by 0.4%, a steeper fall than a 0.2% drop in February, marking the second straight month of contraction.
Gold/Silver Ratio Nears 100: What Does It Mean Historically?The Gold/Silver ratio is on the verge of reaching 100, an extremely rare level seen only at key historical turning points. The chart includes a 2,500-week linear regression channel, which shows that over the very long term, the ratio has been steadily rising, though at a slow pace. Occasionally, the ratio touches the 1.5 standard deviation line, and in rare, game-changing events, and sometimes it even breaks beyond that level.
Here are some of the key historical turning points marked by major spikes in the Gold/Silver ratio:
1- Early 1990s: The collapse of the Soviet Union, the Gulf War, and a U.S. recession pushed the ratio to 106. It remained above 1.5 standard deviations for more than two years.
2- 2002: Following the dot-com bubble burst, the 9/11 attacks, and the Iraq War, the ratio climbed to 82.6, nearing the 1.5 deviation line.
3- 2008 Recession: The global financial crisis triggered by the collapse of Lehman Brothers sent the ratio to 88.50. This spike sparked a major rally in both gold and silver, lasting until 2011 when the ratio reached one of its deepest bottoms.
4- 2019: The U.S.–China trade war under Trump’s first term pushed the ratio to 93, again nearing the 1.5 deviation threshold.
5- 2020 (COVID-19 Shock): The pandemic caused one of the biggest disruptions in modern economic history. Although relatively short-lived, its impacts were severe. The Gold/Silver ratio surged to 126 , marking the highest level in modern records, possibly the highest in all of history.
6- 2024–2025 (Global Trade War?): With the U.S. imposing major tariffs on key global trading partners, this could be another historic inflection point. The full impact is still unfolding, but risks of a serious global slowdown, or even a deep recession are rising. A full-scale trade war remains a real possibility.
Now, the Gold/Silver ratio is approaching 100 and nearing the 1.5 standard deviation line. It remains unclear whether this represents a powerful pair trade opportunity—"sell gold, buy silver"—or a structural breakout where the ratio stays elevated for an extended period. In either case market is showing that this is one of the rare turning point of global economy.

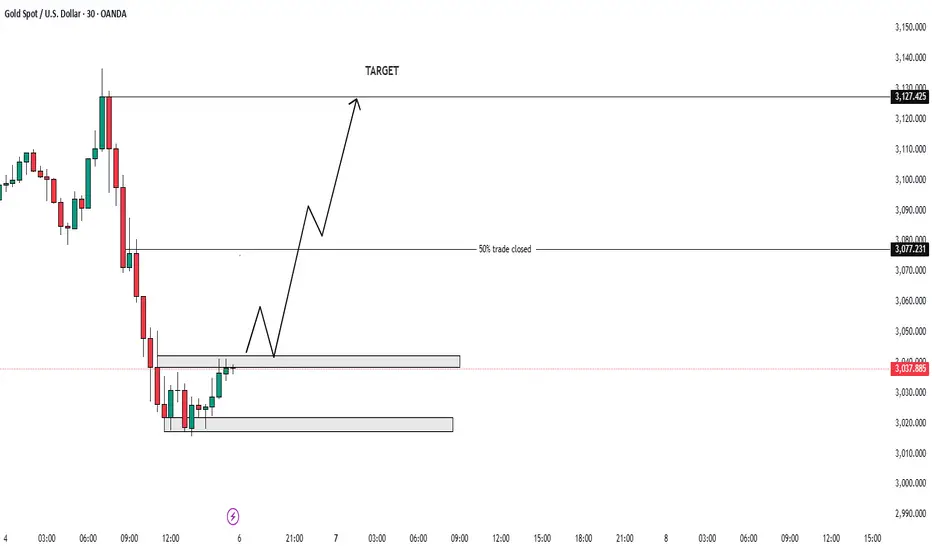
WILL GOLD MARK NEW ATH TRUMP TERRIF ALERT!🚨 GOLD UPDATE (XAU/USD)🚨
Gold is showing a strong bullish trend, and it’s expected to continue for the next month. 🌟 If you see any dips, buy in again and again! We could see gold touch 3200 soon, especially with the ongoing China & Trump tensions. The US economy remains strong, and fundamentally, gold is primed to soar even higher! 📈💥
After Trump's tariffs, gold may dip and sweep more liquidity before bouncing back stronger. ⚡ As China and Trump battle, US strength keeps pushing gold to new heights. 📊
Key Buying Zones 🔑:
- 3030 – 3035: Last zone for reversal 🔄
- 3000: Strong support zone 🚀
Targets 🎯:
- 3100 💰
- 3200 💎
- After 1 month: 3300 💥
⚠️ Always follow risk management⚠️
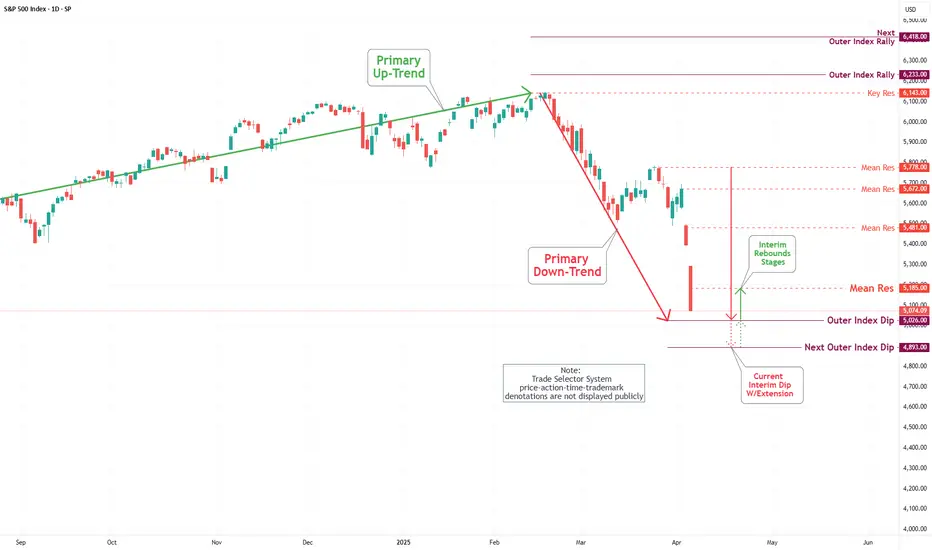
S&P 500 Daily Chart Analysis For Week of April 4, 2025Technical Analysis and Outlook:
During this week's trading session, the Index experienced lower openings, completing the Outer Index Dip at 5403, as highlighted in the previous week's Daily Chart analysis. This development lays a foundation for a potential decline targeting the Outer Index Dip at 5026, with the possibility of further extension to the subsequent target of the next Outer Index Dip, 4893. An upward momentum may materialize at either completed target level, with the primary objective being the Mean Resistance level of 5185.
EUR/USD Daily Chart Analysis For Week of April 4, 2025Technical Analysis and Outlook:
The Euro has experienced a notable increase, surpassing resistance levels at 1.086 and 1.095 in the current trading session, thereby completing the Inner Currency Rally of 1.114. However, an intermediate price reversal has been observed, suggesting that the Eurodollar will continue to decline towards the support level at 1.090, with a potential extension down to 1.075. An upward momentum could emerge from either of these support levels.

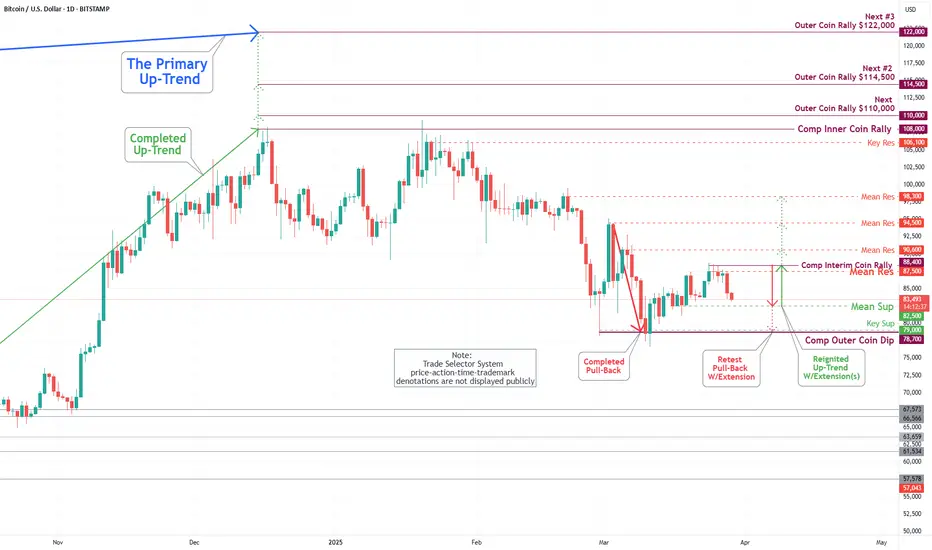
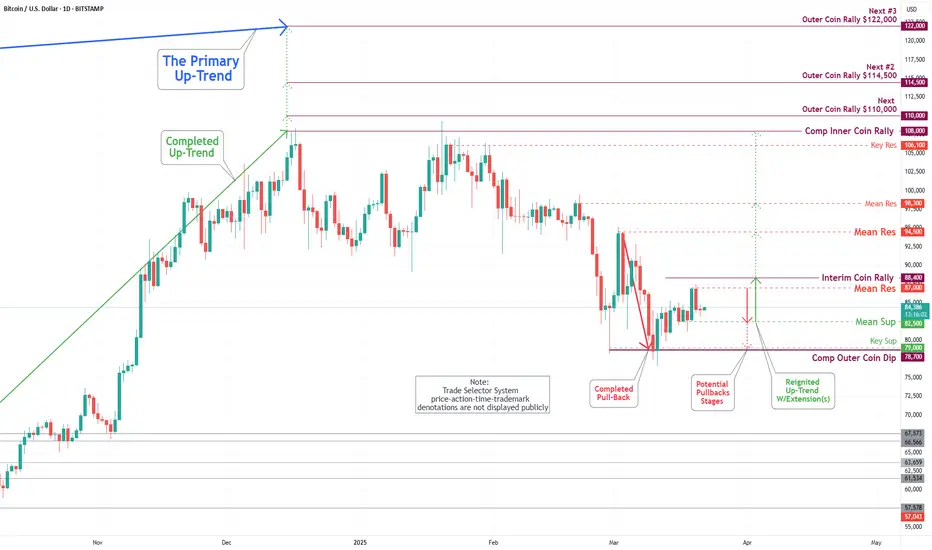
Bitcoin(BTC/USD) Daily Chart Analysis For Week of April 4, 2025Technical Analysis and Outlook:
In the course of this week's trading activities, we noted a successful retest of the Interim Coin Rally at 88400, with particular emphasis on the Mean Support at 82500. This development indicates the potential for an extension in a trajectory toward the previously established Outer Coin Rally at 78700. An upward momentum may originate from the Mean Support at 82500 and/or the Key Support at 79000/completed Outer Coin Dip at 78700.

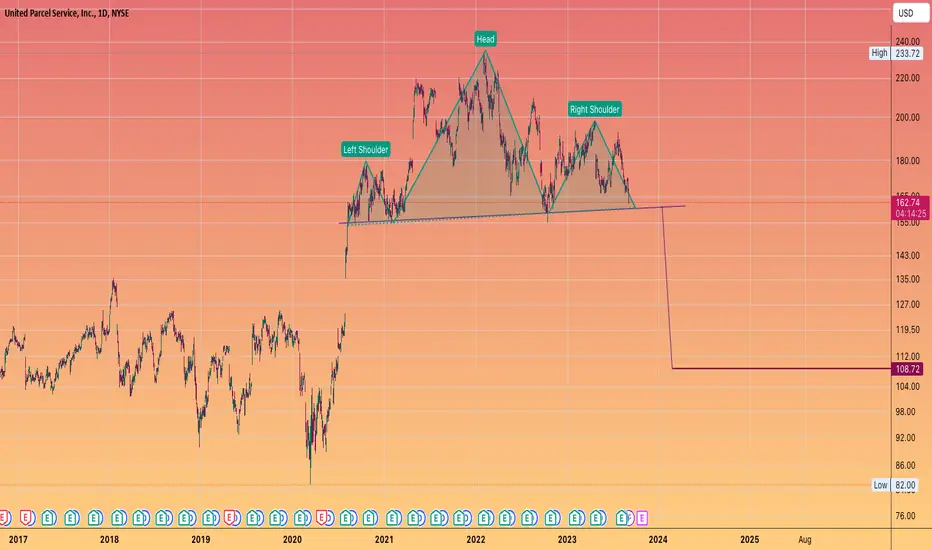
UPS looking DOWNSNice head and Shoulders on the United Parcel Service
#UPS and FEDEX are the new dow transport indicator.
An underlying determinant of how the consumer is faring
Since the US is a consumer economy and Online shopping is the majority of retail
if we see new highs on the Indicies, and the home delivery carriers continue to deteriorate
it would give your non confirmation Top
Similar to Dow theory of new High's in the Industrials , but the transports lagging and indeed falling.
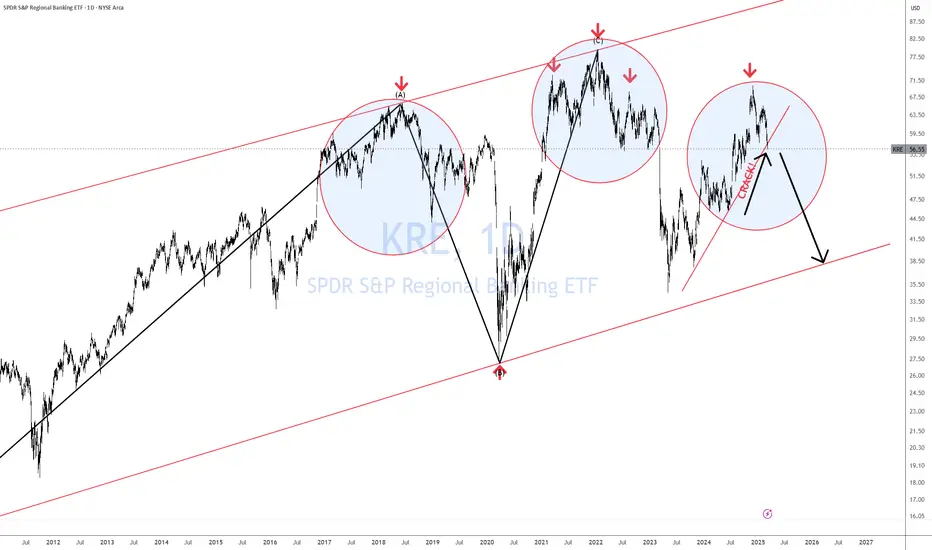
KRE Regional Banks In Trouble?KRE is starting to scream Danger! Wave 3 up ending. Multiple head and shoulders (one massive) the current uptrending is now starting to CRACK! signaling that the right shoulder will now start to form.
I see no benefit for bulls to hold on as risk is now very high. Furthermore, this is a bad sign for the overall economy and markets as regional banks are US domestic. Bad JUJU!
Don't be a dick for tick! ))
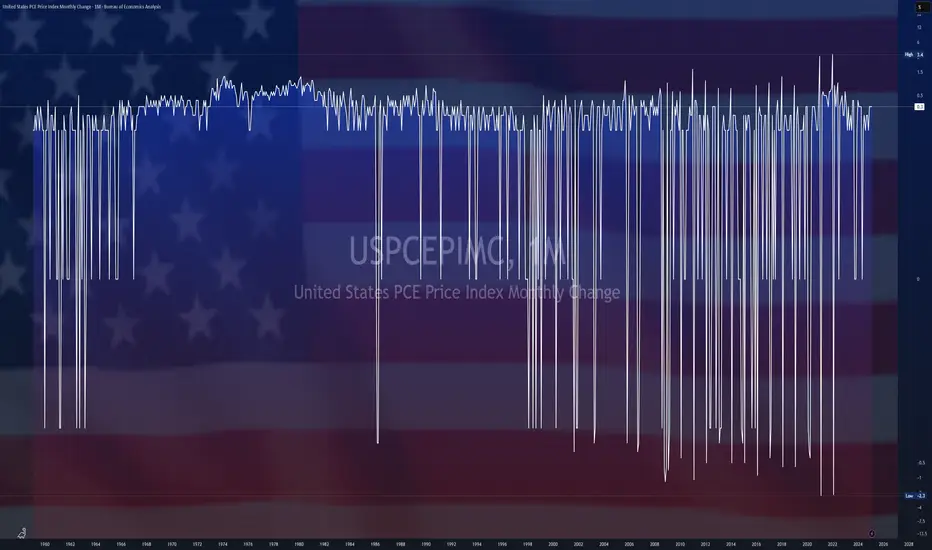
$USPCEPIMC -U.S Core PCE Inflation Rises More than ExpectedECONOMICS:USPCEPIMC
(February/2025)
source: U.S. Bureau of Economic Analysis
- The US PCE price index rose by 0.3% month-over-month in February, maintaining the same pace as the previous two months.
The core PCE index increased by 0.4%, the most since January 2024, surpassing the forecast of 0.3% and up from 0.3% in January.
On a year-over-year basis, headline PCE inflation remained steady at 2.5%, while core PCE inflation edged up to 2.8%, above the expected 2.7%.
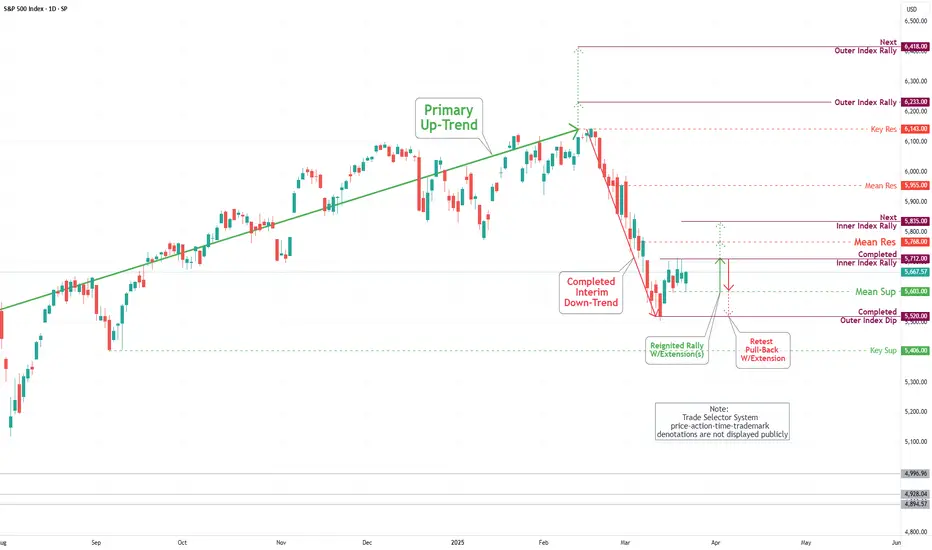
S&P 500 Daily Chart Analysis For Week of March 28, 2025Technical Analysis and Outlook:
During this week's trading session, the Index gapped higher, passing our completed Inner Index Rally of 5712 and setting a Mean Resistance of 5768. This target was accompanied by considerable reversal, ultimately causing a downward movement. On the final trading day of the week, the Index underwent a pronounced decline, resulting in a substantial drop that surpassed the critical target of Mean Support set at 5603. The Index is positioned to retest the completed Outer Index Dip level of 5520. An extended decline is feasible, with the possibility of targeting the subsequent Outer Index Dip at 5403 before resuming an upward rally from either of these Outer Index Dip levels.

EUR/USD Daily Chart Analysis For Week of March 28, 2025Technical Analysis and Outlook:
The Euro has experienced a downward trend in the current trading session, surpassing the Mean Support level of 1.078, where an intermediate price reversal occurred. The analysis indicates that the Eurodollar is expected to retest the Mean Resistance level at 1.086, with a possible resistance level marked at 1.095. A downward momentum may be initiated from either the Mean Resistance of 1.086 or 1.095.

Bitcoin(BTC/USD) Daily Chart Analysis For Week of March 28, 2025Technical Analysis and Outlook:
Bitcoin underwent several significant peaks as it completed the Interim Coin Rally 88400. Subsequently, it experienced a decline, moving towards the Mean Support 82500, with the possibility of extending its trajectory to retest the previously completed Outer Coin Rally 78700. An upward momentum may be initiated from the Mean Support of 82500 or the Key Support of 79000/completed Outer Coin Dip of 78700.
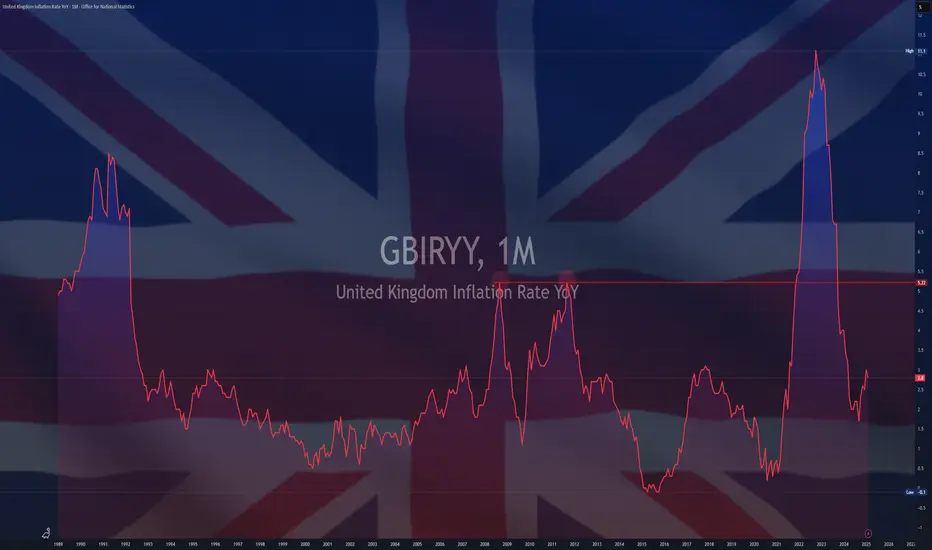
$GBIRYY -U.K Inflation Rate (February/2025)ECONOMICS:GBIRYY
February/2025
source: Office for National Statistics
- The annual inflation rate in the UK fell to 2.8% in February 2025 from 3% in January, below market expectations of 2.9%, though in line with the Bank of England's forecast.
The largest downward contribution came from prices of clothing which declined for the first time since October 2021 (-0.6% vs 1.8%), led by garments for women and children's clothing.
Inflation also eased in recreation and culture (3.4% vs. 3.8%), particularly in live music admission and recording media, as well as in housing and utilities (1.9% vs. 2.1%), including actual rents for housing (7.4% vs. 7.8%).
In contrast, food inflation was unchanged at 3.3% and prices rose faster for transport (1.8% vs 1.7%) and restaurants and hotels (3.4% vs 3.3%).
Meanwhile, services inflation held steady at 5%.
The annual core inflation rate declined to 3.5% from 3.7%.
Compared to the previous month, the CPI increased 0.4%, rebounding from a 0.1% decline but falling short of the expected 0.5% increase.
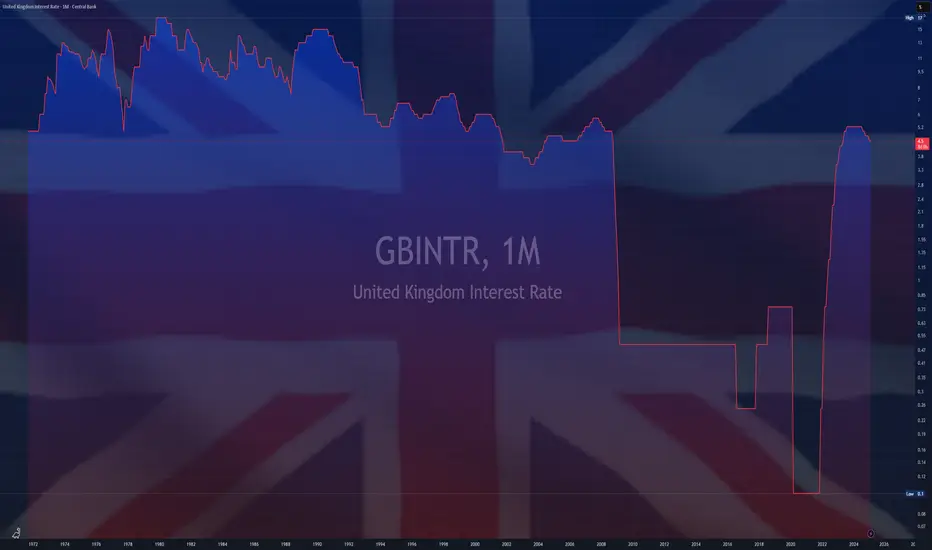
$GBINTR - U.K Interest Rates (March/2025)ECONOMICS:GBINTR
March/2025
source: Bank of England
- The Bank of England voted 8-1 to keep the Bank Rate at 4.5% during its March meeting,
as policymakers adopted a wait-and-see approach amid stubbornly high inflation and global economic uncertainties. The bank highlighted that, given the medium-term inflation outlook, a gradual and cautious approach to further withdrawal of monetary policy restraint remains appropriate.
CPI inflation increased to 3.0% in January, and while global energy prices fell,
inflation is expected to rise to 3¾% by Q3 2025.
Also, the MPC noted that global trade policy uncertainties and geopolitical risks increased, with financial market volatility rising. source: Bank of England
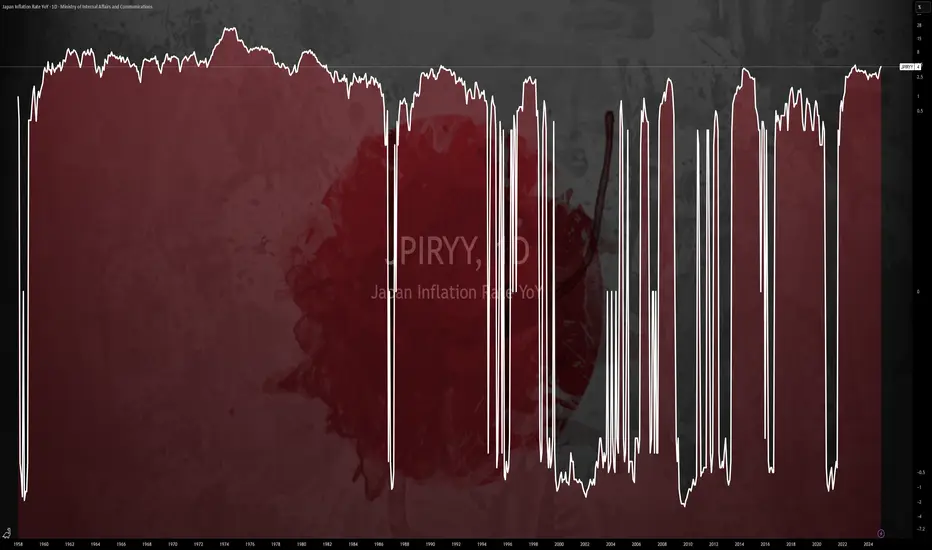
$JPIRYY -Japan's Inflation Rate (February/2025)ECONOMICS:JPIRYY
February/2025
source: Ministry of Internal Affairs & Communications
- The annual inflation rate in Japan fell to 3.7% in February 2025 from a 2-year high of 4.0% in the prior month, amid a sharp slowdown in prices of electricity (9.0% vs 18.0% in January )and gas (3.4% vs 6.8%) following the government's reinstatement of energy subsidies.
Also, food prices rose slightly slower after hitting a 15-month high in January (7.6% vs 7.8%).
Further, inflation eased for healthcare (1.7% vs. 1.8%), recreation (2.1% vs. 2.6%), and miscellaneous items (1.1% vs. 1.4%).
At the same time, education costs continued to fall (-1.1% vs. -1.1%).
In contrast, inflation remained steady for housing (at 0.8%) and clothing (at 2.8%), while accelerating for transport (2.4% vs. 2.0%) and furniture and household items (4.0% vs. 3.4%), and bouncing back for communications (0.1% vs. -0.3%).
The core inflation rate dropped to 3.0% from January's 19-month top of 3.2%, above forecasts of 2.9%.
Monthly, the CPI dropped 0.1%, the first fall since September, after a 0.5% gain in January.
S&P 500 Daily Chart Analysis For Week of March 21, 2025Technical Analysis and Outlook:
During the course of this week's trading session, the S&P 500 achieved the designated target for the Inner Index Rally at 5576, which occurred midweek. This target was accompanied by considerable volatility, ultimately hindering upward movement. On the week's final trading day, the index experienced a notable decline, resulting in a significant drop that reached our critical target, Mean Support, at 5603.
Consequently, the index is now poised to target a retest of the Inner Index Rally level 5712, with a subsequent potential target identified at the Mean Resistance level 5840. It is essential to consider that upon reaching the Inner Index Rally target of 5712, a decrease in the current price level is anticipated, which may lead to a retest of the Mean Support at 5601. Furthermore, an extended decline is possible to revisit the completed Outer Index Dip at 5520 before the resumption of an upward rally.
EUR/USD Daily Chart Analysis For Week of March 21, 2025Technical Analysis and Outlook:
As indicated in the analysis conducted last week, the Euro has initiated a downward trend following a successful retest of the Mean Resistance level at 1.093. It is currently trending downward toward the Mean Support level at 1.078, potentially declining further to the Mean Support level at 1.061. Conversely, should the anticipated downward trend not materialize, the Eurodollar will retest the Mean Resistance level at 1.087, with an additional resistance level marked at 1.095.

Bitcoin(BTC/USD) Daily Chart Analysis For Week of March 21, 2025Technical Analysis and Outlook:
This week's trading session demonstrated considerable volatility in Bitcoin's price action. The cryptocurrency made multiple attempts to attain our Interim Coin Rally 88400, yet it ultimately remained at the same level as the week commenced. The current analysis suggests that Bitcoin must reach our Mean Support of 82500 before initiating an upward progression aimed at the Interim Coin Rally of 88400 through the Mean Resistance of 87000. Furthermore, a retest of the completed Outer Coin Dip 78700 is essential before the emergence of a significant rally.
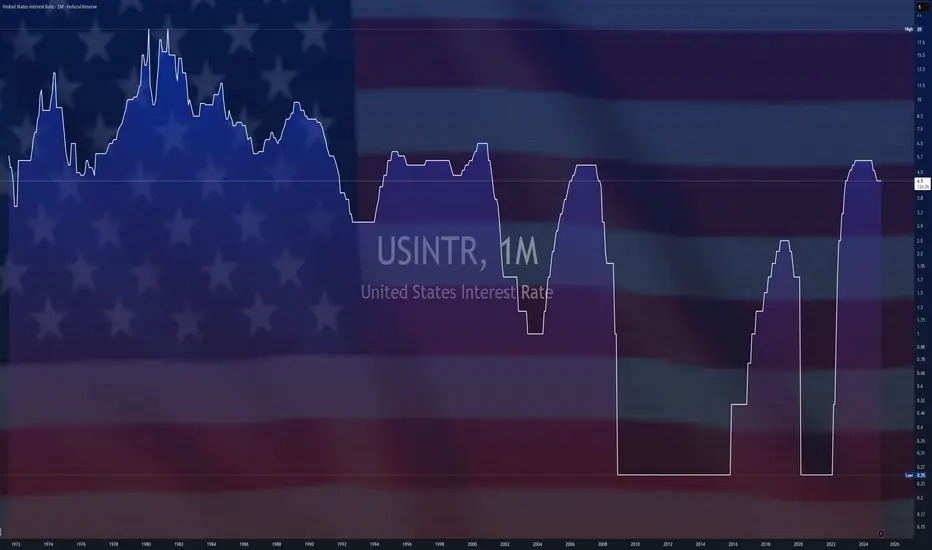
$USINTR - U.S Interest Rates (March/2025)ECONOMICS:USINTR
March/2025
source: Federal Reserve
- The Fed keep the funds rate unchanged at 4.25%-4.5%,
but signaled expectations of slower economic growth and rising inflation.
The statement also noted that uncertainty around the economic outlook has increased, but officials still anticipate only two quarter-point rate reductions in 2025.
$JPINTR -Japan's Interest Rates (March/2025)ECONOMICS:JPINTR
March/2025
source: Bank of Japan
-The Bank of Japan (BoJ) kept its key short-term interest rate at around 0.5% during its March meeting, maintaining it at its highest level since 2008 and in line with market expectations.
The unanimous decision followed the central bank’s third rate hike in January and came before the U.S. Federal Reserve’s rate announcement.
The board took a cautious stance, focusing on assessing the impact of rising global economic risks on Japan’s fragile recovery.
The BoJ pointed to ongoing uncertainties in the domestic economic outlook amid higher U.S. tariffs and headwinds from overseas conditions.
While the Japanese economy had recovered moderately, some weaknesses remained.
Private consumption continued to grow, helped by wage hikes, even as cost pressures persisted.
However, exports and industrial output were mostly flat.
Inflation ranged between 3.0% and 3.5% yearly, driven by higher service prices.
Inflation expectations increased moderately, with underlying CPI projected to rise gradually.

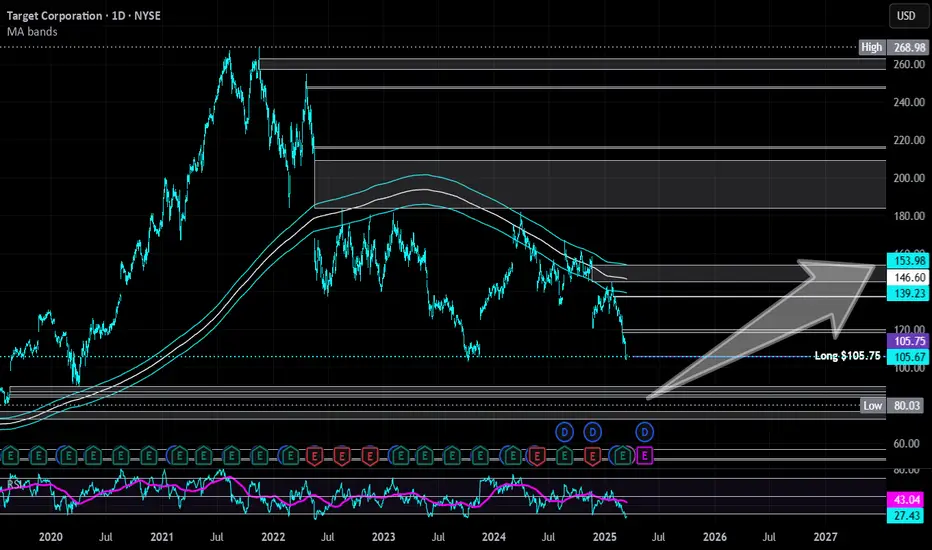
Target | TGT | Long at $105.75Target NYSE:TGT
Strengths:
P/E: 11.82x
Earnings are forecast to grow 4.95% per year
Dividend: 4.24%
Better "value" compared to others (i.e. NYSE:WMT )
Insiders recently awarded options
May have double-bottomed (see weaknesses below...)
Weakness
Economic headwinds / recession concerns
Debt-to-equity: 1.09x (slightly high)
Several price gaps on the daily chart are open below the current price. If recession fears are valid and news to messages "tighter consumer spending", these gaps will likely be filled (all the way down to the GETTEX:50S ). One day these will be filled, but that would be a huge opportunity for long-term investors...
Thus, at $105.75, NYSE:TGT is in a personal buy zone.
Targets
$119.75
$137.00
$150.00
Credit Spreads - About to Blow?While credit spreads, which reached near-historic lows in 2024, remain tight, they have widened notably since the beginning of 2025. If this trend accelerates, it could put substantial pressure on the bond market, resulting in tighter financial conditions and corresponding headwinds for the domestic economy. The last 2-3 weeks have seen risk assets come under pressure, but the below chart suggests that the risk-off sentiment shift may still be early-stage... Whether viewed through a traditional technical lens or supply/demand, current levels could be considered supportive - risk is to the upside.
A few impacted ETFs: NASDAQ:IEF , NASDAQ:TLT , AMEX:HYG , AMEX:JNK
Jon
JHartCharts
