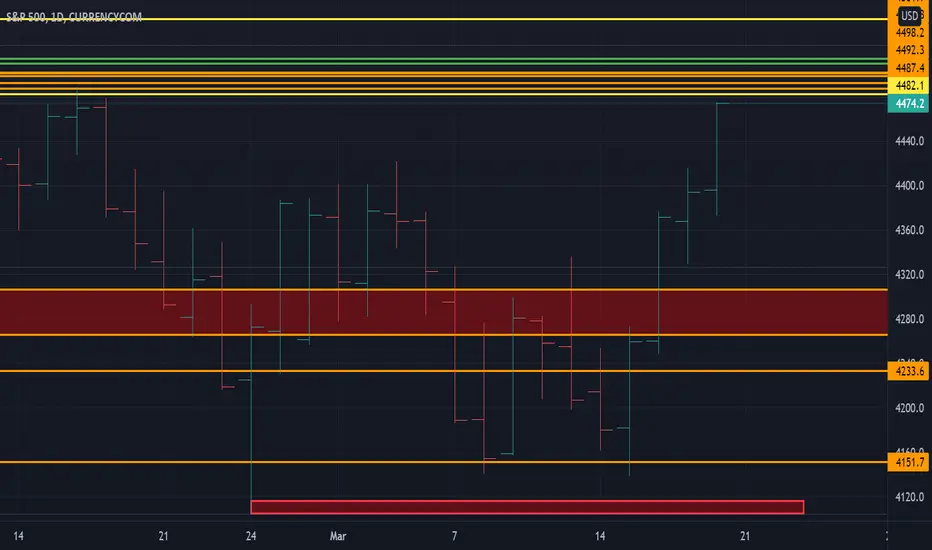
US500 Hello receive a cordial greeting. You have at your disposal a brief technical analysis of the S&P500 We have as the most likely scenario a lateral or slightly upward movement in the short term and in the medium term caution possible bearish movement. Key support and resistance are at your disposal.
Kind regards L.E.D.
Economy
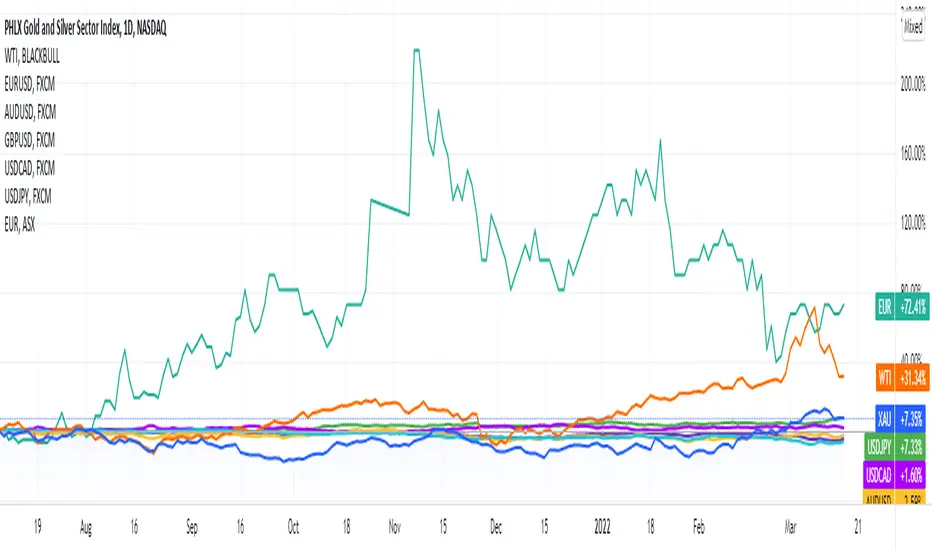
US Dollar Falls after Hawkish Fed AnnouncemeToday's forex news: US Dollar Falls after Hawkish Fed Announcement
EUR/USD ⬆️
GBP/USD ⬆️
AUD/USD ⬆️
USD/CAD ⬇️
USD/JPY ⬆️
XAU ⬆️
WTI ⬇️
On Wednesday, the U.S. Federal Reserve raised interest rates to 2.5%, also preparing further measures to contain inflation. However, the hawkish attitude was not thorough enough to strengthen the dollar against most major currencies, with EUR/USD closing at 1.1032 and GBP/USD at 1.3145. Meanwhile, investors await the Bank of England’s Interest Rate Decision – which will be announced later today (17 March).
The AUD/USD pair saw a rise with the closing price at 0.7289, thanks to a positive job report indicating lower-than-expected unemployment rate at 4%, and an increase in gold prices at a closing price of 1,909.2, which is another response to the restrictive US monetary policy.
US dollar struck a six-year high at 119.12 against Japanese Yen, as the east Asian country experienced a 7.3 magnitude earthquake yesterday (16 March), investors look to a safe haven currency until the earthquake’s aftermath is settled.
Crude Oil, on the other hand, has settled lower at $95.04 per barrel. Since the US has increased its oil inventory, combined with optimism for other oil-producing OPEC members to increase supply, and China’s COVID outbreak slowing global consumption.
Major U.S. stock indexes have surprisingly rallied despite the Federal Reserve’s decision to increase borrowing costs.
United States 10-Year Bond Yield stabilized its rise, closing at 2.187%.
📱 Get instant market news delivered to you in real time on Mitrade
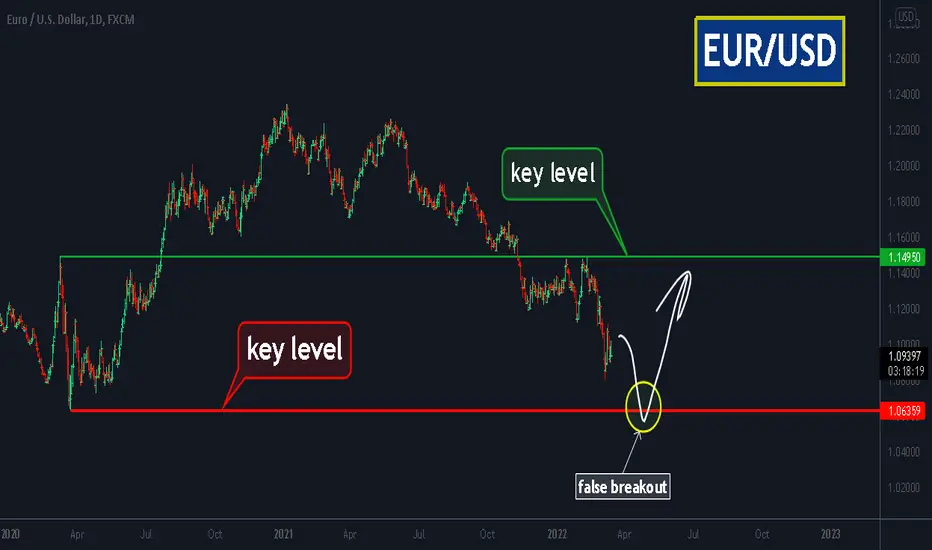
EUR/USD!Euro is weakening! What's NEXT?EUR/USD. The Euro began to fall against the Dollar due to Russia's attack on Ukraine. Conflict in Europe is a high risk and unpredictability of investment in the European economy leads to capital outflow to safer markets.
The outflow of capital from the EU goes to the U.S. market, which causes Euro to fall against the Dollar.
The price is now at 1.10 level and it is very close to the lows of 2016 when the price fell to a record low of 1.03.
If the key level of 1.06 will be broken, a false breakout of this level is very possible, as it shown on the chart.
Friends, push the like button, write a comment, and share with your mates - that would be the best THANK YOU.
P.S. I personally will open entry if the price will show it according to my strategy.
Always make your analysis before a trade.
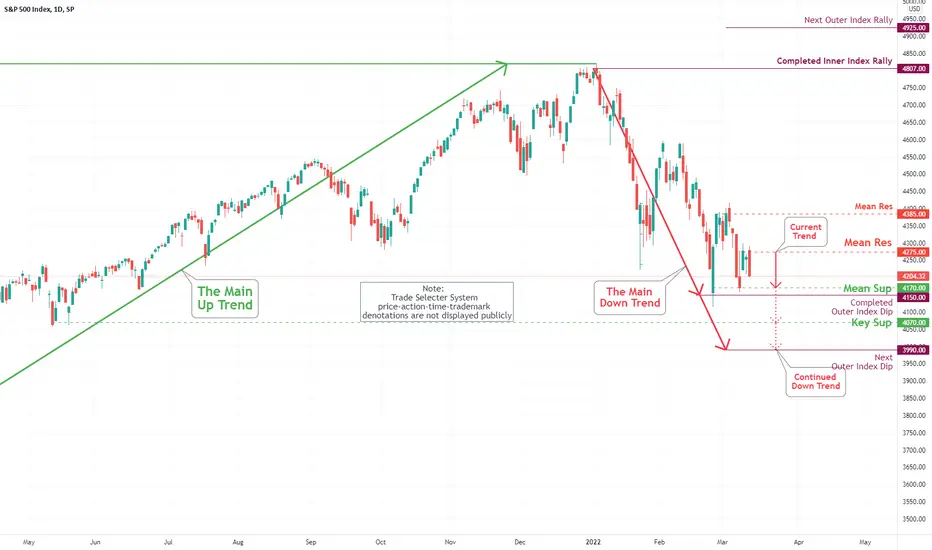
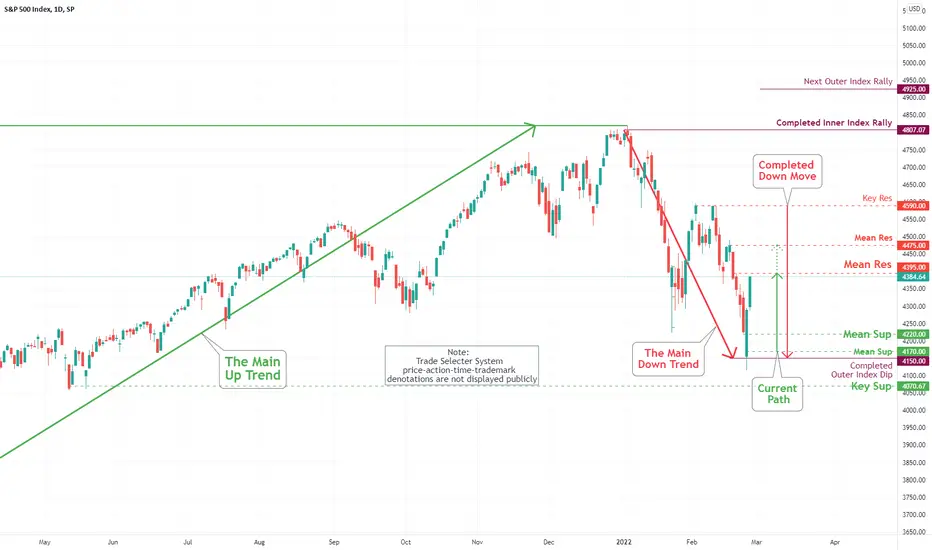
S&P 500 Daily Chart Analysis For March 11, 2022 Technical Analysis and Outlook
Continuation downtrend from our Mean Res 4385, the index created sub Mean Res 4275 for the near-term retest. But the current main target is Mean Sup 4170, completed Outer Index Dip 4150. The Key Sup 4070 and expended Outer Index Dip 3990 are prevailing driving trends, whereas the intermediate bullish moves within the downtrend mode are nothing but an interruption/distraction.
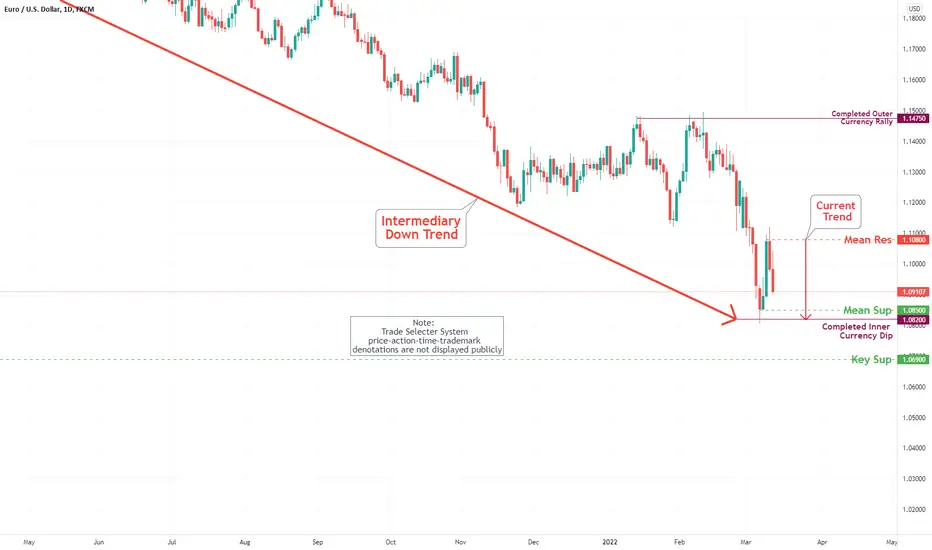
EUR/USD Daily Chart Analysis For March 11, 2022Technical Analysis and Outlook:
The Eurodollar practically went into euphoria to the upside after fulfilling our Inner Currency Dip 1.0820, with leftover Mean Res 1.1080 - the bullish moves are possible to this newly created resistance. The retest and revisiting Mean Sup 1.0850 and completed Inner Currency Dip are imminent - The Key Sup 1.0690 is next.
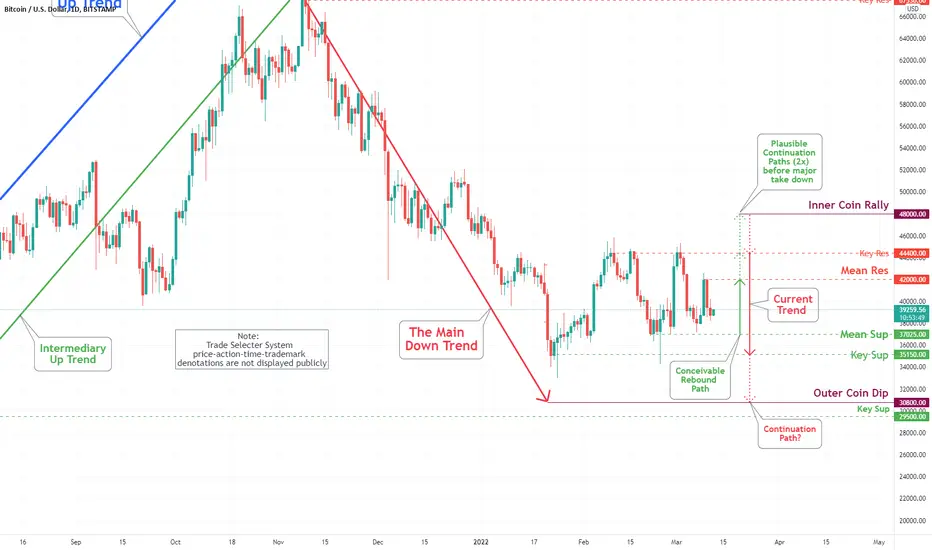
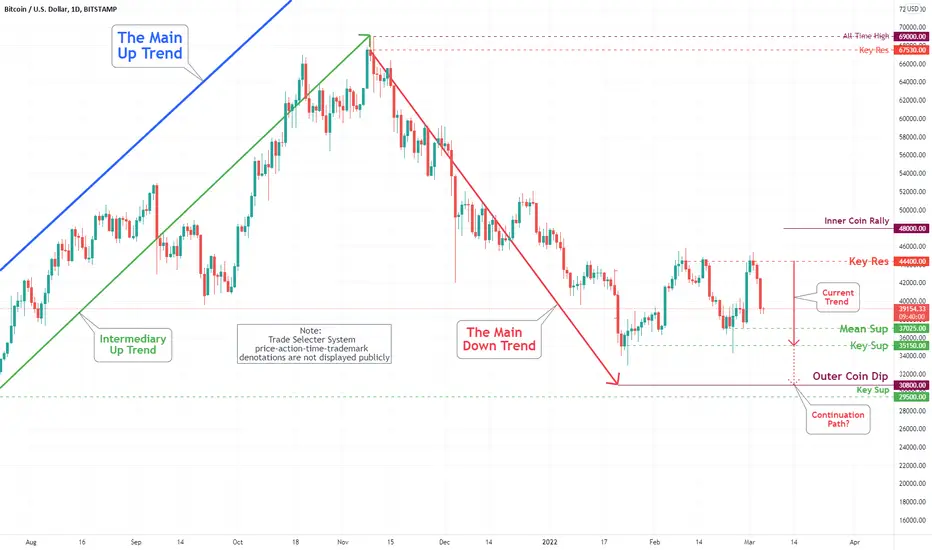
Bitcoin (BTC/USD) Daily Chart Analysis For March 11, 2022Technical Analysis and Outlook:
This week bitcoin soared +10%, but that, unfortunately, did not last. While the bigger picture may indicate a bearish future to Outer Coin Dip $30,800 and few targets in between - some positive short-term upside moves are possible to Mean Res $42,000.
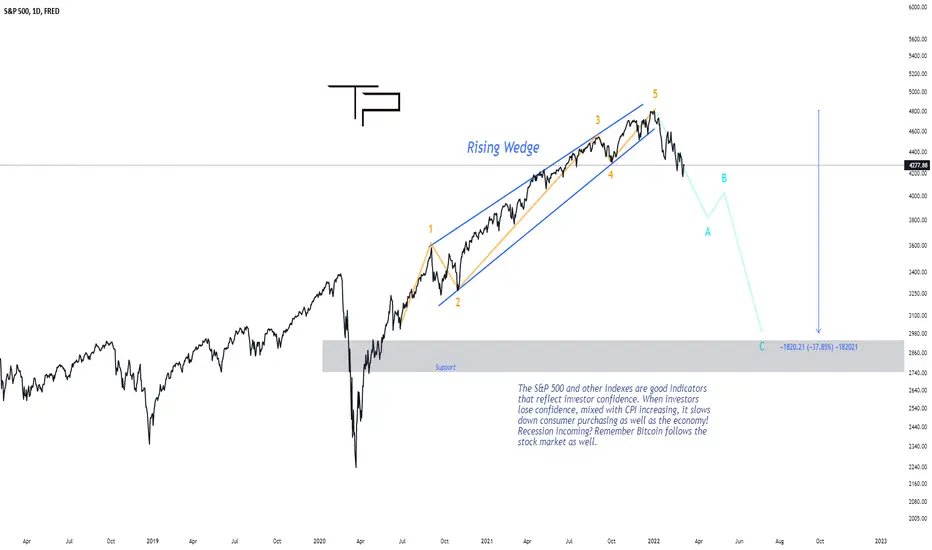
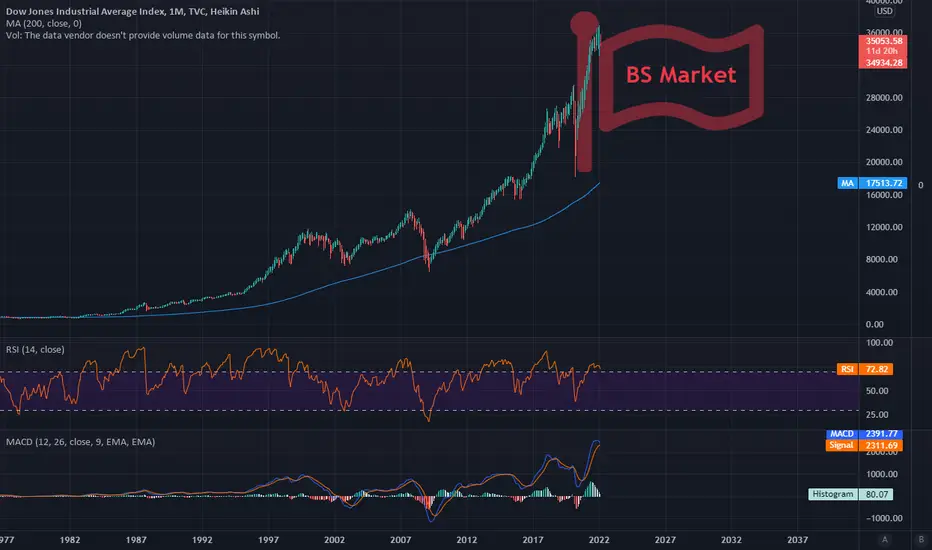
U.S. Economy... Recession incoming?The S&P 500 and other indexes are good indicators that reflect investor confidence.
When investors lose confidence, mixed with CPI increasing,
it slows down consumer purchasing as well as the economy! Recession incoming?
Keep in mind Bitcoin follows the stock market as well.
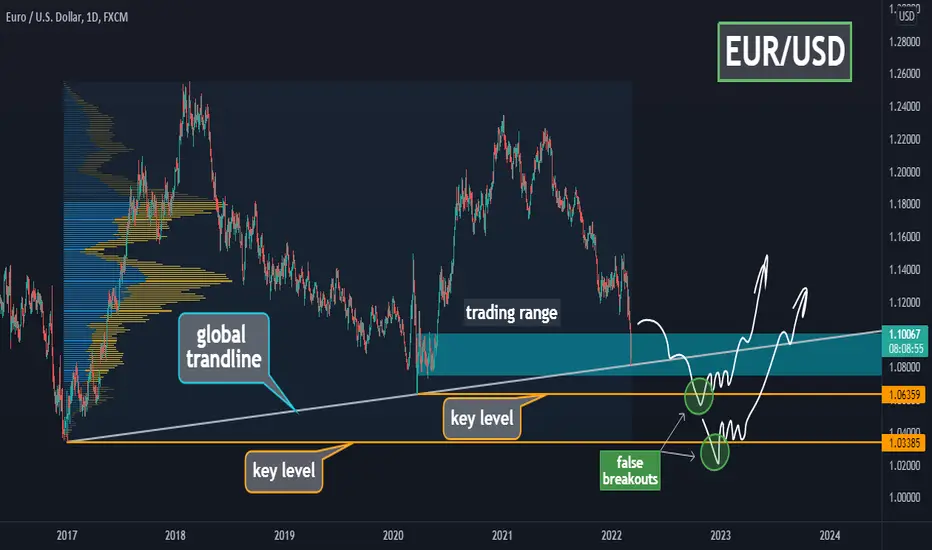
EUR/USD - false breakout of key levels!In the face of sanctions the supply chain in Europe suffers, which leads to a decrease in the economy of the whole EU.
EUR starts to fall against USD, as the EU economy takes a bigger hit than the U.S. economy.
The price is now testing the global trend line and big trading range. If this trend line cannot resist the sellers' pressure, it will test the key level at $1.06. If there will no strong support, the next key level is $1.03.
False breakout is possible in both cases, so watch for updates on the channel, where we will give all the relevant update.
Friends, press the "like" button, write comments and share with your friends - it will be the best THANK YOU!
P.S. Personally, I open an entry if the price shows it according to my strategy. Always do your analysis before making a trade.
EUR/USD Daily Chart Analysis For March 4, 2022Technical Analysis and Outlook:
The Eurodollar practically went into freefall with the current price action a primary target of the Inner Currency Dip 1.0820. Whereas some bullish moves are could possible to our newly created Mean Res 1.1015.

S&P 500 Daily Chart Analysis For March 4, 2022 Technical Analysis and Outlook
After a serial retest of our Mean Res 4385, the index is positioned to move down to retest the Key Sup 4305. The Mean Sup 4220 and Mean Sup 4170 are the primary targets. The Key Sup 4070 is in the near-term future cards. Whereas the bullish move to Mean Res 4475 is also possible within the downtrend mode.

Bitcoin (BTC/USD) Daily Chart Analysis For March 4, 2022Technical Analysis and Outlook:
Monday this week, the crypto market rocketed to our Key Res $44,400 and dropped 7%. Is there enough buying pressure left to push the price of bitcoin through the resistance zone again? Or are the sellers taking over, and will the price fall back to Mean Sup $37,025 and Key Sup $35,150?
A Little RantWhere to begin? In my history of learning, reading, trading, analyzing, I have never seen a market more manipulated and completely disconnected not only from the economy, but reality.
We have come to a time in our society where economic data no longer has ANY impact on equities. We witness the week of Feb 7th till today, Feb 16th a release of horrible economic news. Let's go through it shall we?
Worse Than Expected CPI
Far Worse Than Expected Consumer Sentiment.
Worse Than Expected PPI
Q1 GDP Estimates Now 0.1% or Contraction
7 in 10 Americans Live Paycheck to Paycheck
Home Builder Confidence Falls
Personal Credit/Debt New Records
What we are witnessing is the QE going to corporations through corporate bond buying, in turn we saw the greatest massing of corporate buy backs thus pushing stocks higher and higher. Most companies are trading well over 20x earnings. It's a bubble of idiocy and greed.
The issue is simple, scary, and unavoidable at this point. All of this printing has caused probably the worst inflation in US history. The money printer's solution is raising rates, tapering, and shrinking balance sheet, which will prick this equities bubble. The response to a bear market will be.... guess what? More QE, slashing rates but this time, it'll be game over. The USD will have finally met its end as it's de-pegged as the world reserve currency. It won't matter because as the US is facing its currency crisis, other nations will face their own fiat crisis.
Whatever way you cut it, whatever action they take, there will be hurt and at least a recession plus stock market collapse like we've never seen.
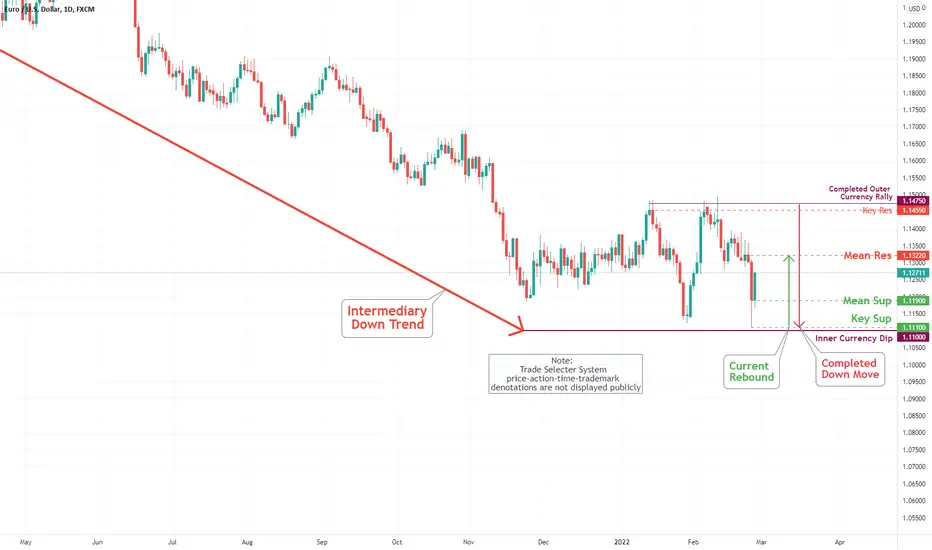
EUR/USD Daily Chart Analysis For February 25, 2022Technical Analysis and Outlook:
The Eurodollar practically completed our Inner Currency Dip 1.1100 flagged on Daily Chart Analysis For January 28, 2022. The current price action suggests a primary target of the Mean Res 1.1322. Whereas more bearish moves are will be executed to our newly created Mean Sup 1.1190 and 1.1110.
S&P 500 Daily Chart Analysis For February 25, 2022 Technical Analysis and Outlook
After piercing our extended and currently completed Outer Index Dip 4150, the index is heading to newly created Mean Res 4395 and later on to 4475. The return to major Mean Sup 4220 and Mean Sup 4170 is imminent, whereas more bullish moves are also possible within the downtrend - Stray tuned.
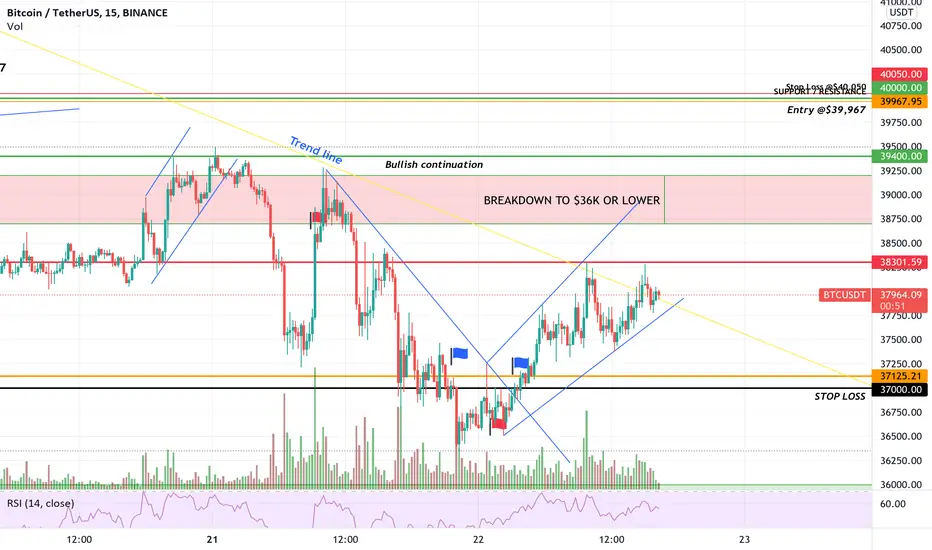
BOUGHT DIPS…TIME TO EAT CHIPS - BOTTOM REACHED FOR BTC! Analysts according to the news feed on Bitcoin Fear & Greed index claim we have reached the bottom of the downtrend…as the geopolitical climate is affecting many countries we are seeing liquidity moved to crypto especially BTC. people are choosing not to trust their money with their governments and even centralized exchanges. Canada just saw the largest withdraw of money from their banking system with the threat of cyber-tyranny. This is why we invest in bitcoin. I’m bullish for now….using Pionex Margin grid bot (leveraged 4x) indicated by the most recent blue entry flag. We NEED to hit $39,500 to sustain this movement!
#BUYINGDIPSANDEATINGCHIPS
S&P 500 Daily Chart Analysis For February 18, 2022 Technical Analysis and Outlook
After hitting our Critical Mean Res 4590 as specified on January 31, 2022, the index continued the trend downwards by touching Mean Sup 4325. The current trend is eyeing the retest of the Key Sup 4295 and targetting Inner Index Dip 4210. The Outer Index Dip 4000 is on the horizon, whereas some bullish moves are also possible within the downtrend - Stray tuned.
