#Edu/USDY#EDU
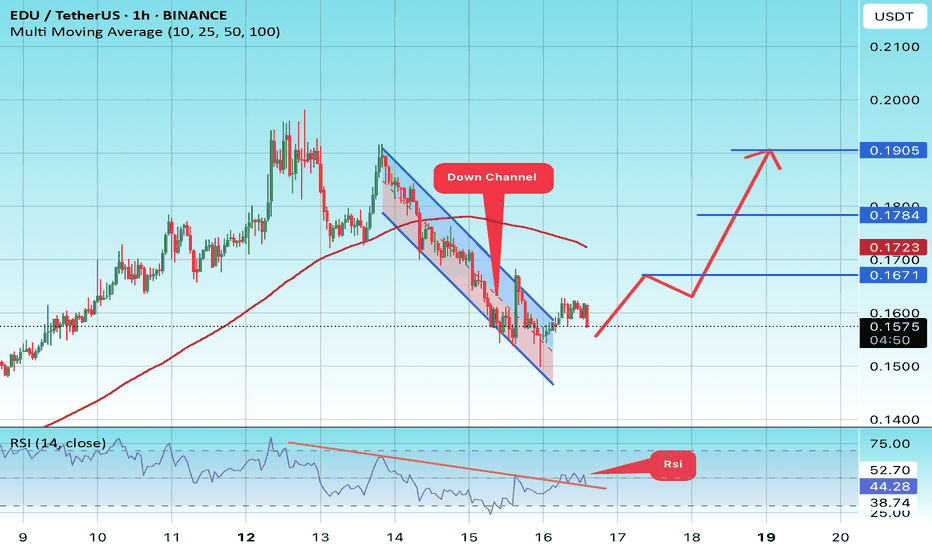
The price is moving within a descending channel on the 1-hour frame and is expected to break and continue upward.
We have a trend to stabilize above the 100 moving average once again.
We have a downtrend on the RSI indicator that supports the upward move with a breakout.
We have a support area at the lower limit of the channel at 0.1500, which acts as strong support from which the price can rebound.
Entry price: 0.1576.
First target: 0.1670.
Second target: 0.1784.
Third target: 0.1905.
EDUBTC
#EDU/USDT Forming Descending Triangle#EDU
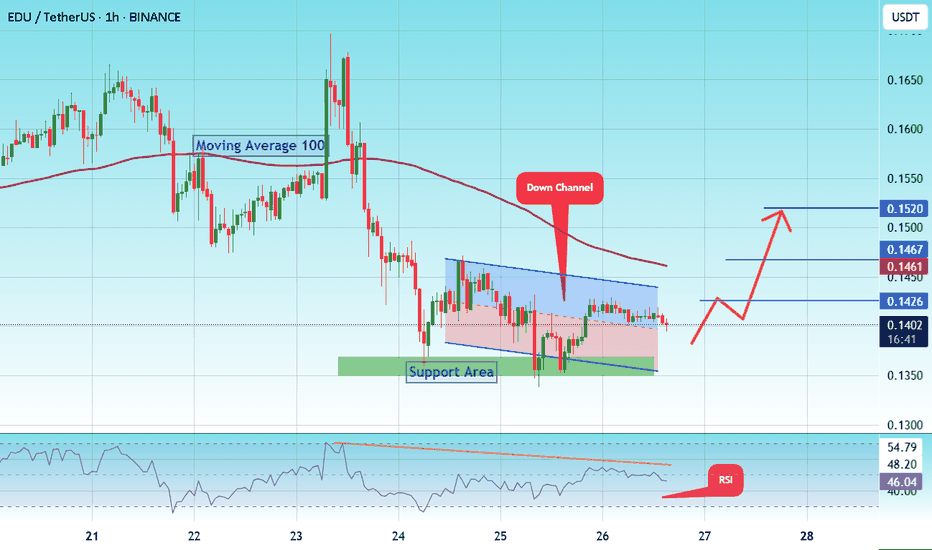
The price is moving within a descending channel on the 1-hour frame and is expected to break and continue upward.
We have a trend to stabilize above the 100 moving average once again.
We have a downtrend on the RSI indicator that supports the upward break.
We have a support area at the lower boundary of the channel at 0.1300, acting as a strong support from which the price can rebound.
We have a major support area in green that pushed the price upward at 0.1350.
Entry price: 0.1400.
First target: 0.1426.
Second target: 0.1460.
Third target: 0.1520.
To manage risk, don't forget stop loss and capital management.
When you reach the first target, save some profits and then change your stop order to an entry order.
For inquiries, please comment.
Thank you.
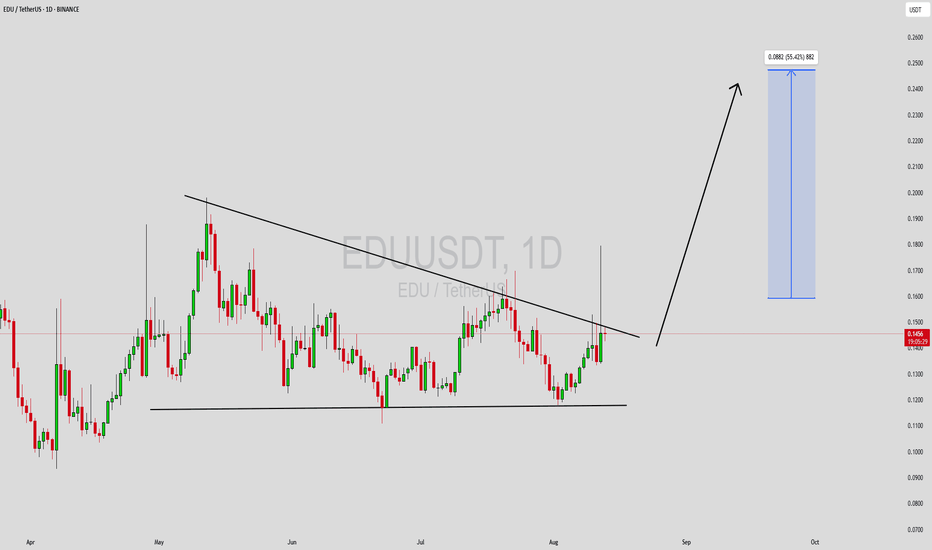
EDUUSDT Forming Bullish ReversalEDUUSDT is showing promising signs of a potential bullish reversal after forming a clear descending channel pattern on the charts. This pattern, often considered a continuation or reversal setup depending on the breakout direction, is currently leaning bullish as the price edges closer to a possible breakout above the upper trendline. With good trading volume supporting the recent price movements, there’s growing confidence that EDUUSDT could rally significantly once the breakout is confirmed, aligning with the expected 70% to 80% upside potential.
Technically, descending channels reflect a period of controlled correction, where sellers gradually lose momentum while buyers accumulate at lower price levels. EDUUSDT has been respecting its channel boundaries well, and the emergence of higher lows on shorter timeframes indicates that buying pressure is slowly building. A decisive breakout above resistance, coupled with a volume surge, could signal the start of a strong bullish wave, attracting more traders to this setup.
Investor sentiment toward EDUUSDT is improving as it nears this key technical point. Market participants are watching closely for a confirmation move, which could trigger a wave of new buying interest. If the breakout holds and price sustains above former resistance zones, EDUUSDT has the potential to hit its projected targets quickly, making it a coin to keep on the radar for short- to mid-term gains.
✅ Show your support by hitting the like button and
✅ Leaving a comment below! (What is You opinion about this Coin)
Your feedback and engagement keep me inspired to share more insightful market analysis with you!
#EDU/USDT#EDU
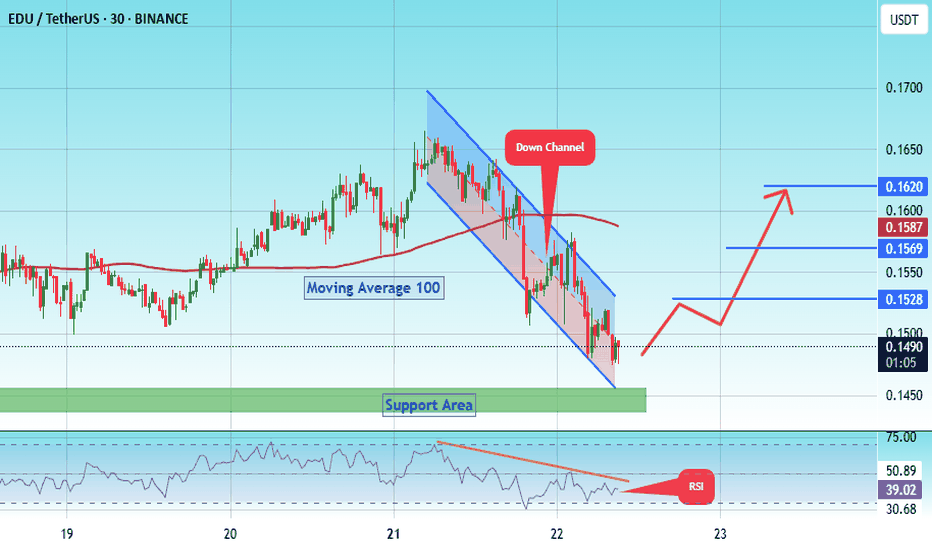
The price is moving within a descending channel on the 1-hour frame, adhering well to it, and is on its way to breaking strongly upwards and retesting it.
We have support from the lower boundary of the descending channel, at 0.1464.
We have a downtrend on the RSI indicator that is about to be broken and retested, supporting the upside.
There is a major support area in green at 0.1442, which represents a strong basis for the upside.
Don't forget a simple thing: ease and capital.
When you reach the first target, save some money and then change your stop-loss order to an entry order.
For inquiries, please leave a comment.
We have a trend to hold above the 100 Moving Average.
Entry price: 0.1487
First target: 0.1528
Second target: 0.1570
Third target: 0.1620
Don't forget a simple thing: ease and capital.
When you reach your first target, save some money and then change your stop-loss order to an entry order.
For inquiries, please leave a comment.
Thank you.
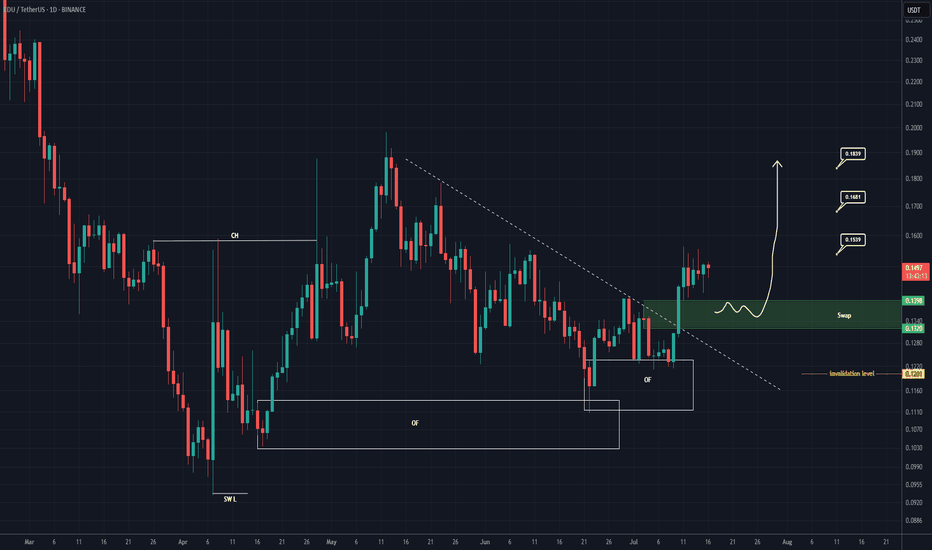
EDU Buy/Long Setup (1D)After forming a swing low, the price has created a bullish Change of Character (CH), and it has flowed well from the origin order blocks.
The trigger line has been broken, and the price has formed a SWAP zone.
Given the bullish signs on the chart, we can consider entering a buy position within the SWAP zone.
The targets are marked on the chart.
A daily candle closing below the invalidation level will invalidate this analysis.
For risk management, please don't forget stop loss and capital management
When we reach the first target, save some profit and then change the stop to entry
Comment if you have any questions
Thank You
#EDU/USDT#EDU
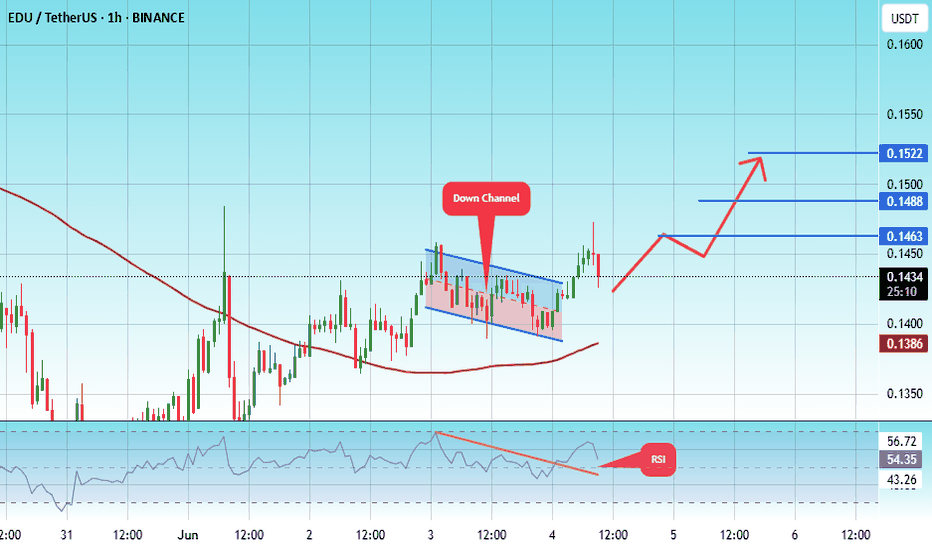
The price is moving within a descending channel on the 1-hour frame, adhering well to it, and is heading toward a strong breakout and retest.
We are experiencing a rebound from the lower boundary of the descending channel. This support is at 0.1400.
We are experiencing a downtrend on the RSI indicator, which is about to break and retest, supporting the upward trend.
We are heading toward stability above the 100 Moving Average.
Entry price: 0.1434
First target: 0.1463
Second target: 0.1488
Third target: 0.1522
#EDU/USDT#EDU
The price is moving in a descending channel on the 1-hour frame and is adhering to it well and is heading to break it strongly upwards and retest it
We have a bounce from the lower limit of the descending channel, this support is at a price of 0.2600
We have a downtrend on the RSI indicator that is about to break and retest, which supports the rise
We have a trend to stabilize above the moving average 100
Entry price 0.2604
First target 0.2677
Second target 0.2736
Third target 0.2824
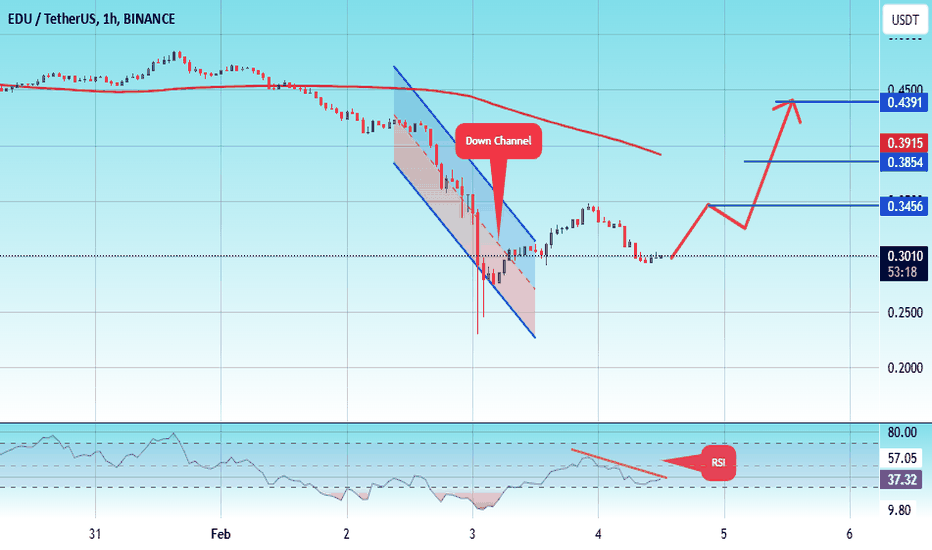
#EDU/USDT#EDU
The price is moving in a descending channel on the 1-hour frame and is adhering to it well and is heading to break it strongly upwards and retest it
We have a bounce from the lower limit of the descending channel, this support is at a price of 0.2300
We have a downtrend on the RSI indicator that is about to break and retest, which supports the rise
We have a trend to stabilize above the moving average 100
Entry price 0.2997
First target 0.3456
Second target 0.3854
Third target 0.4391
#EDU/USDT#EDU
The price is moving in a descending channel on the 1-hour frame and is expected to continue upwards
We have a trend to stabilize above the moving average 100 again
We have a descending trend on the RSI indicator that supports the rise by breaking it upwards
We have a support area at the lower limit of the channel at a price of 0.1700
Entry price 0.1742
First target 0.1774
Second target 0.1818
Third target 0.1860
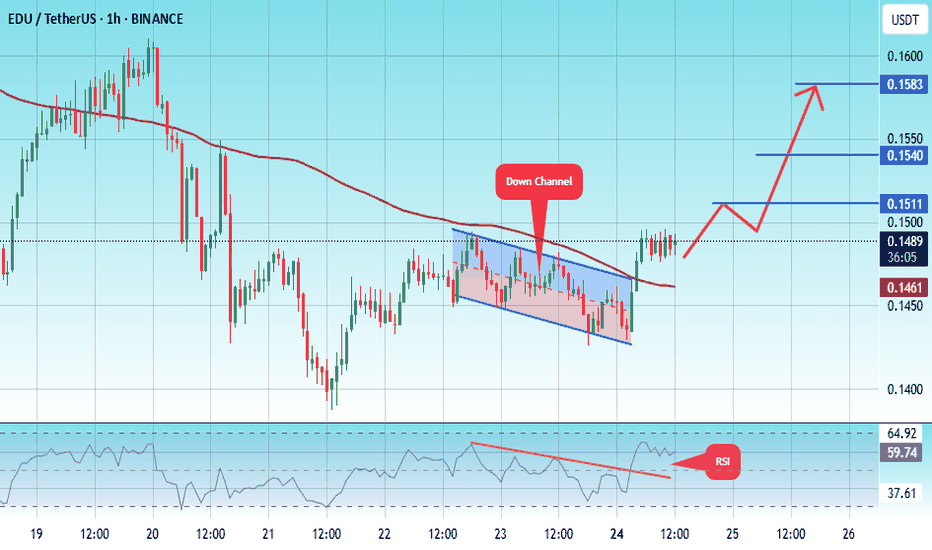
#EDU/USDT#EDU
The price is moving within a descending channel on the 1-hour frame, adhering well to it, and is on its way to breaking it strongly upwards and retesting it.
We are seeing a rebound from the lower boundary of the descending channel, which is support at 0.1430.
We have a downtrend on the RSI indicator that is about to break and retest, supporting the upward trend.
We are looking for stability above the 100 Moving Average.
Entry price: 0.1480
First target: 0.1511
Second target: 0.1540
Third target: 0.1580
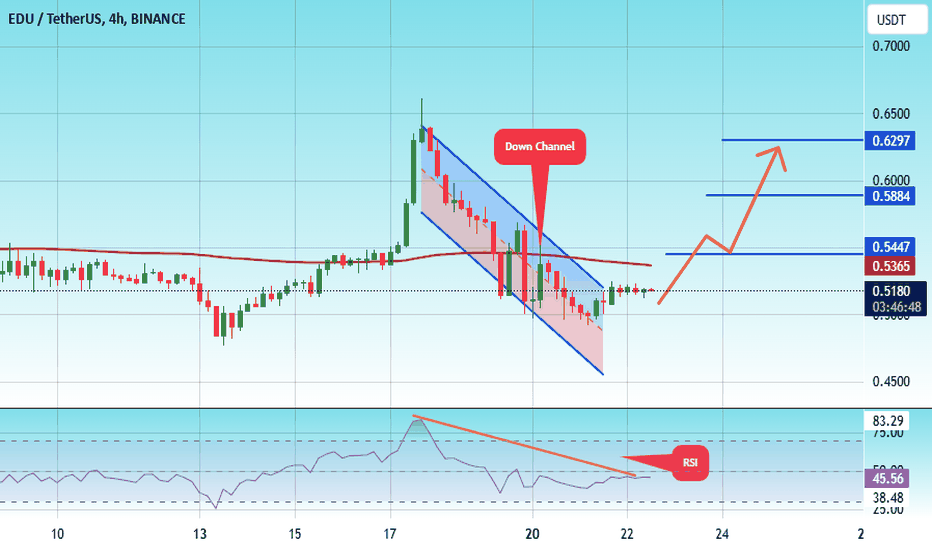
#EDU/USDT Ready to go higher #EDU
The price is moving in a descending channel on the 4-hour frame and sticking to it well
We have a bounce from the lower limit of the descending channel, this support is at 0.4834
We have a downtrend on the RSI indicator that is about to be broken, which supports the rise
We have a trend to stabilize above the moving average 100
Entry price 0.5070
First target 0.5447
Second target 0.5884
Third target 0.6300
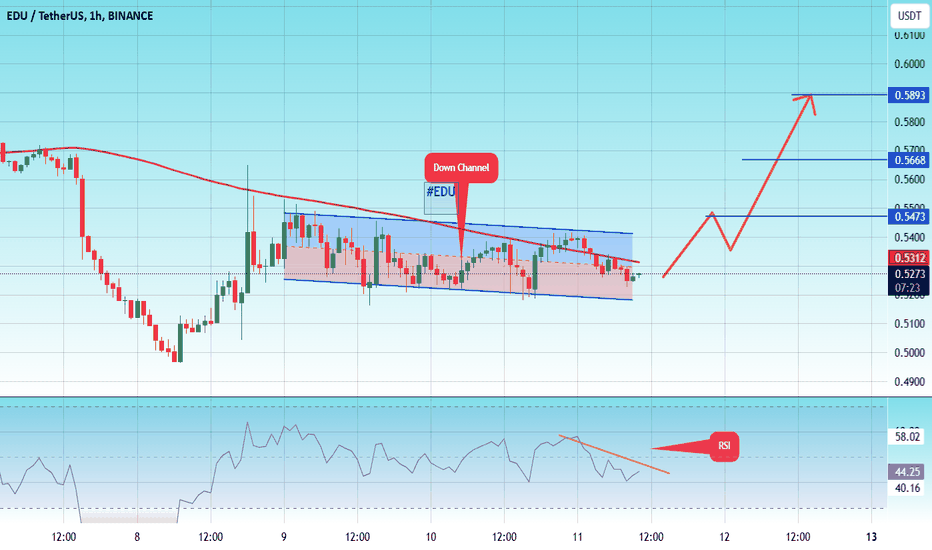
#EDU/USDT #EDU
The price is moving in a descending channel on the 1-hour frame and is expected to continue upwards
We have a trend to stabilize above the moving average 100 again
We have a descending trend on the RSI indicator that supports the rise by breaking it upwards
We have a support area at the lower limit of the channel at a price of 0.5200
Entry price 0.5312
First target 0.5473
Second target 0.5668
Third target 0.5890
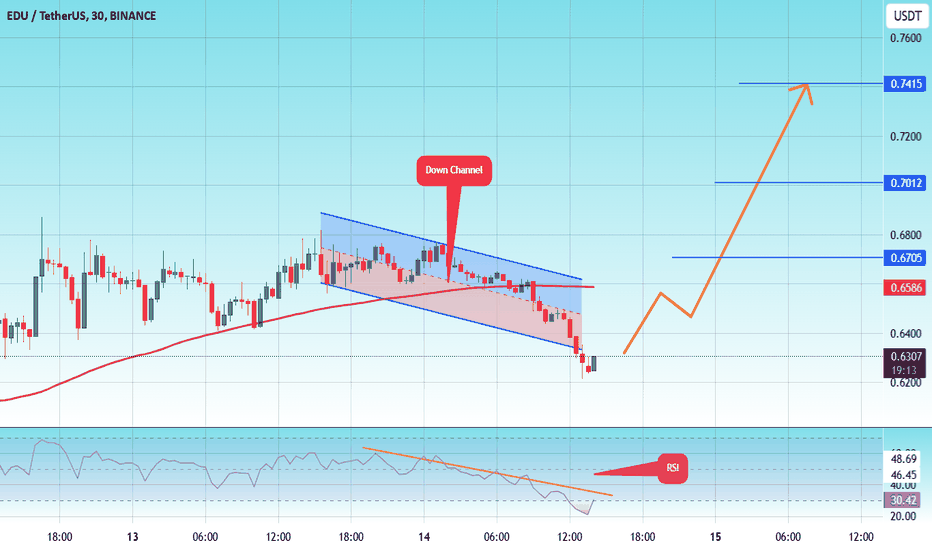
#EDU/USDT#EDU
The price is moving in a descending channel on a 30-minute frame and is expected to continue upwards
We have a trend to stabilize above the moving average 100 again
We have a descending trend on the RSI indicator that supports the rise by breaking it upwards
We have a support area at the lower limit of the channel at a price of 0.6288
Entry price 0.6288
First target 0.6700
Second target 0.7000
Third target 0.7415
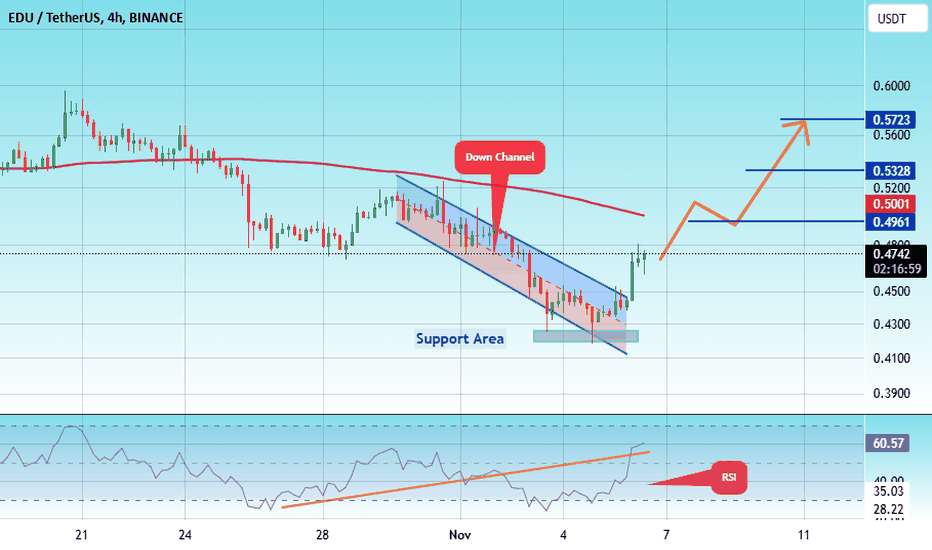
#EDU/USDT#EDU
The price is moving in a descending channel on the 4-hour frame and sticking to it well
We have a bounce from the lower limit of the descending channel, this support is at 0.4230
We have an upward trend, the RSI indicator is about to break, which supports the rise
We have a trend to stabilize above the moving average 100
Entry price 0.4756
First target 0.4961
Second target 0.5328
Third target 0.5723
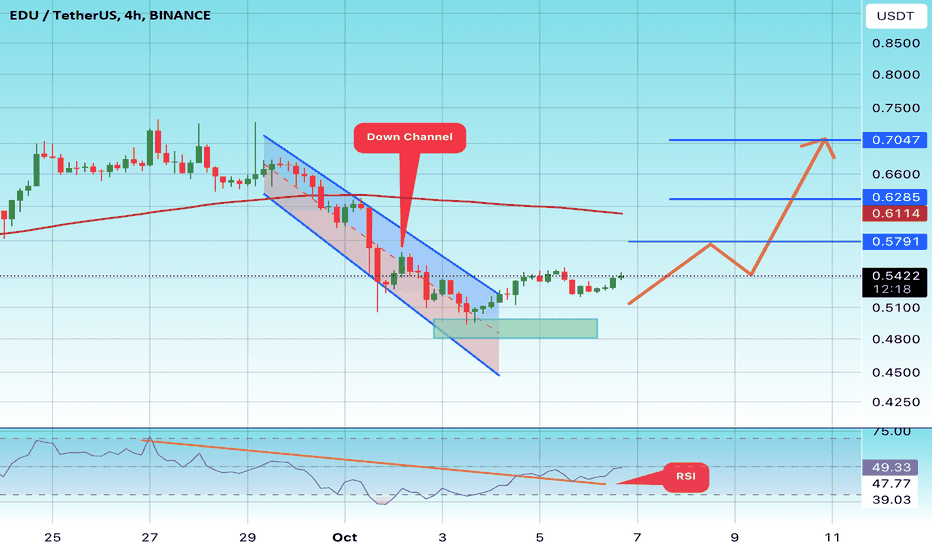
#EDU/USDT#EDU
The price is moving in a descending channel on the 4-hour frame upwards and is expected to continue
We have a trend to stabilize above the moving average 100 again
We have a downtrend on the RSI indicator that supports the rise by breaking it upwards
We have a support area at the lower limit of the channel at a price of 0.4800
Entry price 0.5200
First target 0.5791
Second target 0.6285
Third target 0.7047
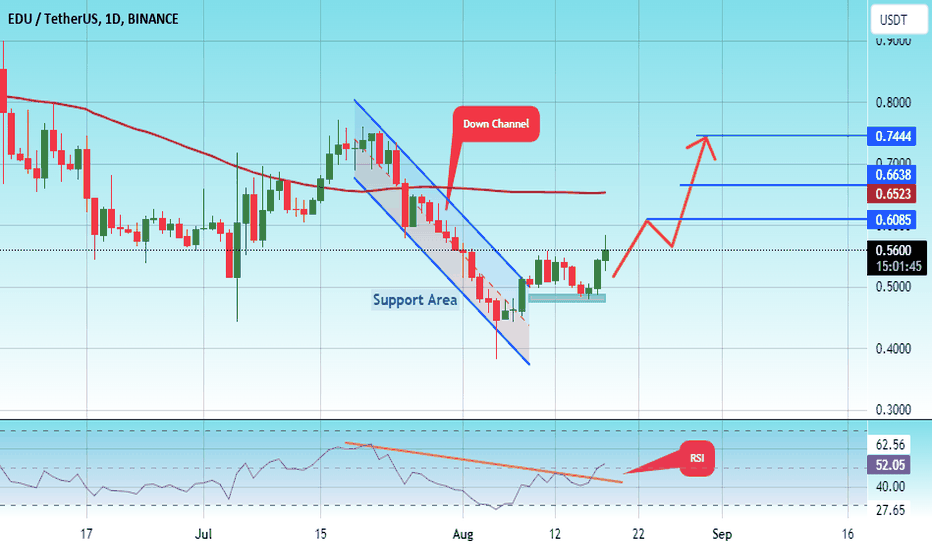
#EDU/USDT#EDU
The price is moving in an ascending channel on the 1-day frame and is sticking to it very well
We have a bounce from a major support area in green at 0.4750
We have a downtrend on the RSI indicator that was broken upwards which supports the upside
We have a trend to stabilize above the 100 moving average which supports the upside
Entry price 0.5000
First target 0.6085
Second target 0.6638
Third target 0.7444
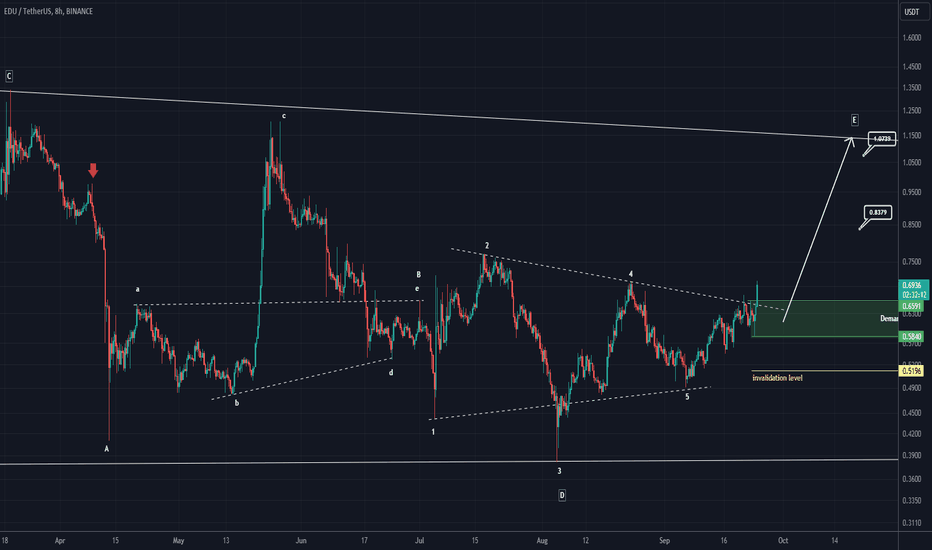
EDU Looks bullishFrom where we put the red arrow on the chart, it looks like a FLAT pattern is formed on the chart. The FLAT pattern has 3 ABC waves.
Wave C, which was a terminal pattern, has now ended and the price can move higher.
The targets are marked on the chart.
Closing a daily candle below the invalidation level will violate the analysis
For risk management, please don't forget stop loss and capital management
When we reach the first target, save some profit and then change the stop to entry
Comment if you have any questions
Thank You
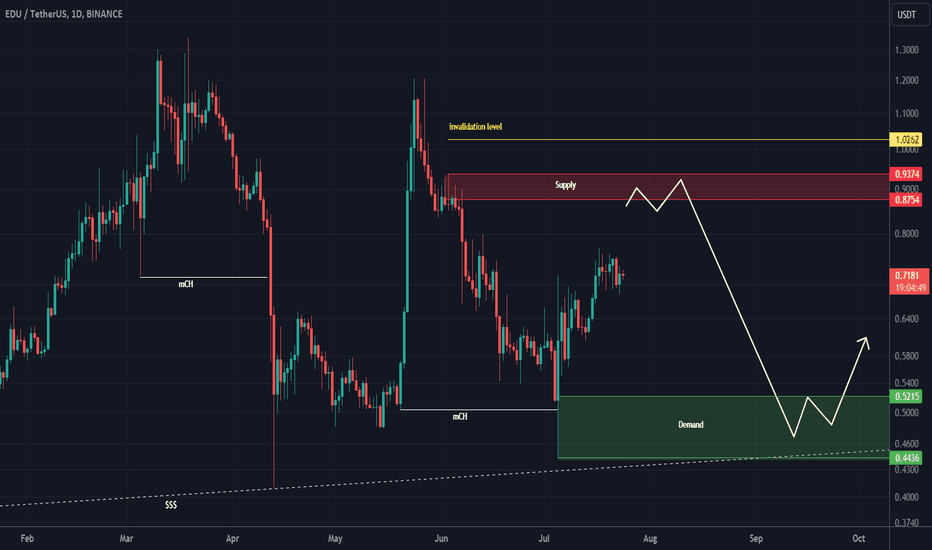
EDU sell/short setup (1D)Note, this is not a buy/long setup but a sell/short setup.
The EDU token is building a large liquidity pool at the bottom, eventually, this liquidity pool will be broken.
Our big structure is a bear.
We have a good supply range on the chart that if the price reaches this area, we can look for sell/short positions.
For risk management, please don't forget stop loss and capital management
Comment if you have any questions
Thank You
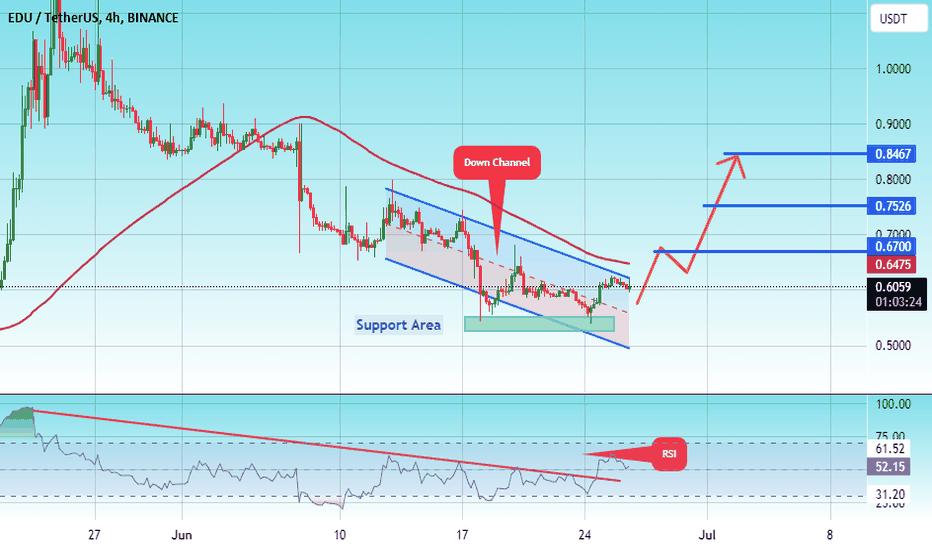
#EDU/USDT#EDU
The price is moving within a descending channel pattern on the 4-hour frame, which is a retracement pattern
We have a bounce from a major support area in the color EUR at 0.5300
We have a tendency to stabilize above the Moving Average 100
We have a downtrend on the RSI indicator that supports the rise and gives greater momentum and the price is based on it
Entry price is 0.5760
The first target is 0.6700
The second target is 0.7526
The third goal is 0.8467
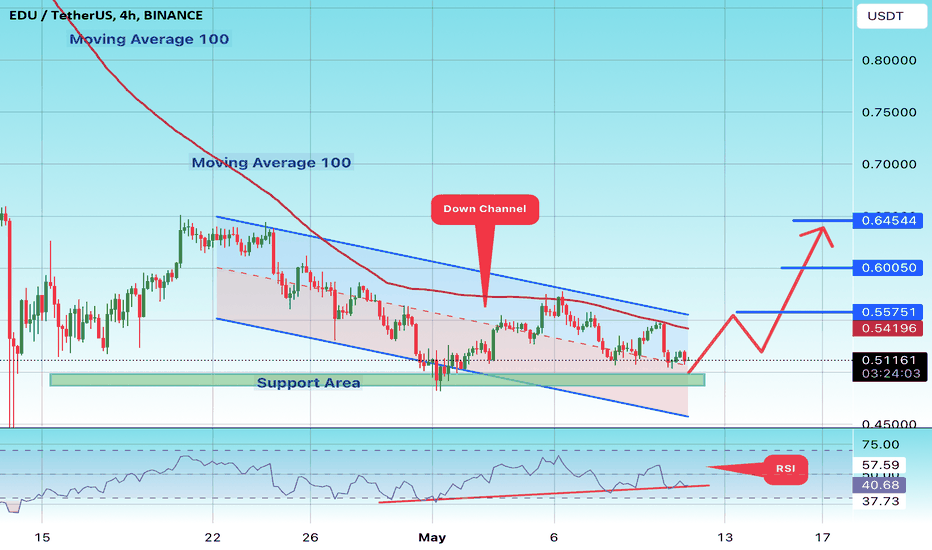
#EDU/USDT#EDU
We have a bearish channel pattern on a 4-hour frame, the price moves within it and adheres to its limits well
We have a green support area at 0.4900 after the price touched it and bounced from it
We have a tendency to stabilize above moving average 100
We have an uptrend on the RSI indicator that supports the price higher
Entry price is 0.5133.
The first target is 0.5575
The second target is 0.6000
The third target is 0.6455
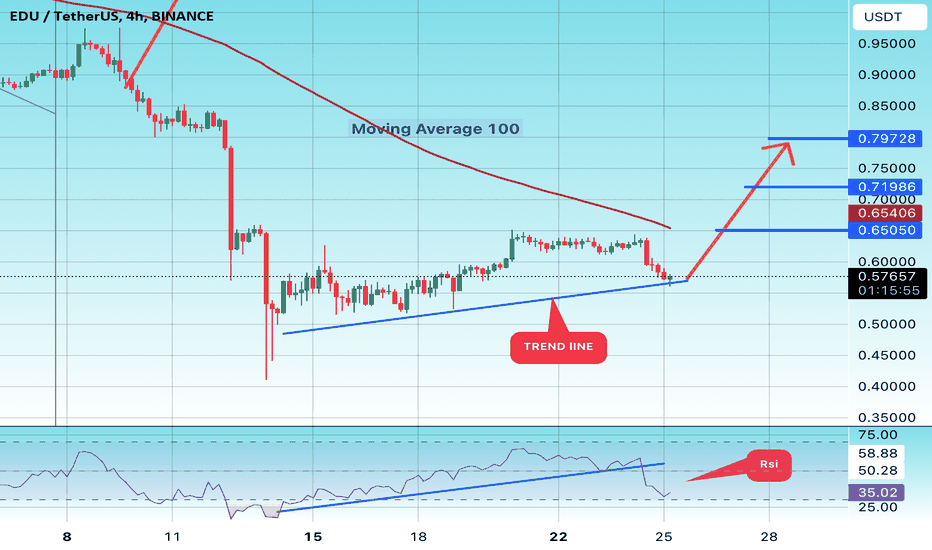
#EDU/USDT#EDU
We have a bullish trend pattern on a 4-hour frame, the price moves based on it and adheres to its limits well
We have a tendency to stabilize above moving average 100
We have an uptrend on the RSI indicator that supports the price higher
Entry price is 0.5750
The first target is 0.6500
The second target is 0.7200
The third target is 0.8000
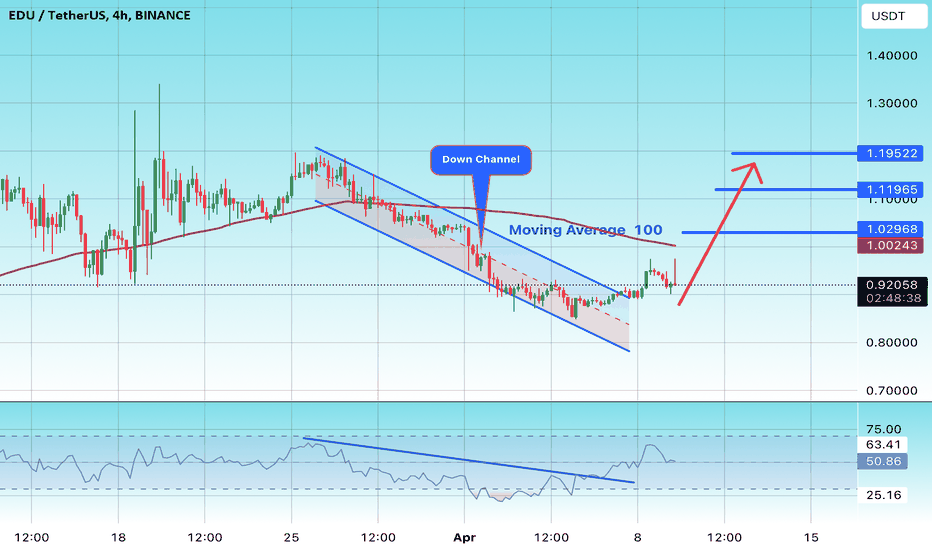
#EDU/USDT#EDU
The price moves in a bearish channel on a 4-hour frame.
The price moves within it and adheres to it to a large extent. We have higher stability, moving average 100.
We have a downtrend on the RSI indicator that supports the rise and is about to break higher
Entry price is 0.920
The first goal is 1.02
The second goal 1.11
The third goal 1.19
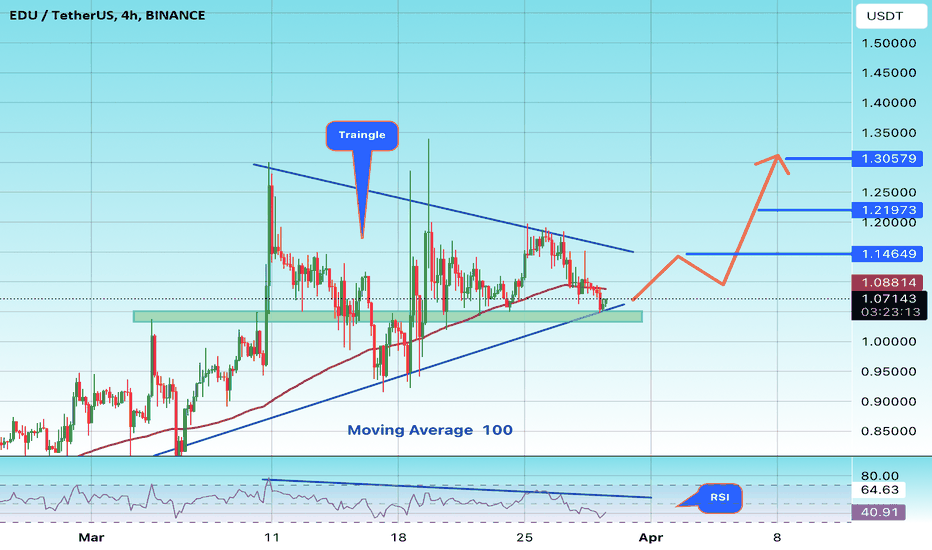
#EDU/USDT#EDU
The price is moving in a triangle on a 4-hour frame, about to break to the upside
The area in green is a very strong support area, and the price rebounded from it at 1.05
We have a downtrend on the RSI indicator about to occur. The fraction is up
We have a higher stability than Moving Average 100
Entry price is 1.06
The first goal is 1.14
Second goal 1.21
The third goal is 1.30
