Detailed analysis of consolidation and growth phases in Nifty. Look at the chart of Nifty carefully. The Circles C1, C2, C3 and C4 show the consolidation phases of Nifty in last 125 Months each time after it makes a new high. Th period between the circles is the growth phase. We will study it carefully and try to derive the conclusions thereoff. To the onset let me tell you that stock market investment are subject to Macro and Micro risks. It is not necessary that the lightning will strike twice at the same spot. But we will use this data and try to measure the statistical possibility of growth and rate at which our investments can grow.
First let us look at Consolidation Phase C1 phase and growth phase that happened thereafter:
C1 Starts in March 2015 when Nifty made a high of 9119. Post that it consolidated for 24 months and came out of consolidation when it gave a closing above previous high in March 2017 when Nifty closed at 9173.
Growth Phase 1 (34 Months) . When Nifty has given a closing above previous high it embarks the journey of growth. It might momentarily go below the past high in some cases but we still consider that whole phase as a growth phase for better understanding and calculation purpose. The next high that Nifty makes is 12430 in January 2020.
Calculations: C1 and Growth Phase 1.
So the actual growth achieved = (12430-9191) = 3311. Which was a 36.3% growth achieved in a Bull Run that lasted 34 months. Which equates to roughly 1.06% Growth per month during the Bull Phase. If you look at the cumulative growth (34 months of bull run + 24 months of consolidation period = 58 months) we get 36.3/58 = 0.62% Growth per month. (During the whole Bull and Bear/Consolidation cycle).
Now let us look at Consolidation Phase C2 phase and growth phase that happened thereafter:
C2 Starts in January 2020 when Nifty made a high of 12430. Post that it consolidated for 10 months and came out of consolidation when it gave a closing above previous high in November 2020 when Nifty closed at 12968.
Growth Phase 2 (11 Months) . When Nifty has given a closing above previous high it embarks the journey of growth. It might momentarily go below the past high in some cases but we still consider that whole phase as a growth phase for better understanding and calculation purpose. The next high that Nifty makes is 18604 in October 21.
Calculations: C2 and Growth Phase 2
So the actual growth achieved = (18604-12430) = 6174. Which was a 49.67% growth achieved in a Bull Run that lasted 11 months. Which equates to roughly 4.5% Growth per month during the Bull Phase. If you look at the cumulative growth (11 months of bull run + 10 months of consolidation period = 21 months) we get 49.67/21 = 2.37% Growth per month. (During the whole Bull and Bear/Consolidation cycle).
Now let us look at Consolidation Phase C3 phase and growth phase that happened thereafter:
C3 Starts in October 2021 when Nifty made a high of 18604. Post that it consolidated for 13 months and came out of consolidation when it gave a closing above previous high in November 2022 when Nifty closed at 18758.
Growth Phase 3 (22 Months). When Nifty has given a closing above previous high it embarks the journey of growth. It might momentarily go below the past high in some cases but we still consider that whole phase as a growth phase for better understanding and calculation purpose. The next high that Nifty makes is 26277 in September 2024.
Calculations: C3 and Growth Phase 3.
So the actual growth achieved = (26277-18604) = 7673. Which was a 41.2% growth achieved in a Bull Run that lasted 22 months. Which equates to roughly 1.87% Growth per month during the Bull phase. If you look at the cumulative growth (22 months of bull run + 13 months of consolidation period = 35 months) we get 41.2/35 = 1.17% Growth per month. (During the whole Bull and Bear/Consolidation cycle).
Right Now we are in C4 which is the consolidation phase which started in September 2024. Next trading day is in September 2025 so we have almost completed 12 months of consolidation phase. When exactly this phase will be over we can not say but let us look at statistical possibility: (Again let me retrate performance of past can not guarantee performance of future but let us see what statistics has to say).
If we look at data from C1, C2 and C3:
Average Consolidation phase length has been 24 (C1) + 10 (C2) + 13 (C3)= 15.6 Months (Almost 12 months have passed so investors should keep the faith and have little more patience).
Average Bull Phase or the Growth phase post completion of Consolidation lasts for 34 (Growth Phase 1) + 11 (Growth Phase 2) + 22 (Growth Phase 3)= 22.33 Months (So there is a huge probability the phase that everyone will enjoy is near by and we are certainly going to be rewarded sooner than later.)
Average Growth during the Growth Phases= 1.06(Growth Phase 1) + 4.5(Growth Phase 2) + 1.87(Growth Phase 3) = 7.43/3 = 2.48% per month.
Average Cumulative Growth considering both Growth phases and Consolidation phase = 0.62(58 Months during C1 and Growth Phase 1) + 2.37(21 months during C2 and Growth Phase 2) + 1.87(35 months of C3 and Growth phase 3) = 4.86/3 = 1.62%.
Conclusion:
/ After every high there is a substantial consolidation phase.
/ If you keep patience during consolidation phase you will be rewarded handsomely by equity market.
Disclaimer: The above information is provided for educational purpose, analysis and paper trading only. Please don't treat this as a buy or sell recommendation for the stock or index. There are a lot of assumptions in data and pure statistics is not applied. We just want to pass on the message that markets have always be rewarding the patient. That does not mean they will continue to do so in future but we are working on probabilities and assumptions here. There can be some mistakes in assumptions and calculations. The Techno-Funda analysis is based on data that is more than 3 months old. Supports and Resistances are determined by historic past peaks and Valley in the chart. Many other indicators and patterns like EMA, RSI, MACD, Volumes, Fibonacci, parallel channel etc. use historic data which is 3 months or older cyclical points. There is no guarantee they will work in future as markets are highly volatile and swings in prices are also due to macro and micro factors based on actions taken by the company as well as region and global events. Equity investment is subject to risks. I or my clients or family members might have positions in the stocks that we mention in our educational posts. We will not be responsible for any Profit or loss that may occur due to any financial decision taken based on any data provided in this message. Do consult your investment advisor before taking any financial decisions. Stop losses should be an important part of any investment in equity.
Educationalanalysis

Curious case of Kotak Bank. What to do now? Investment is always a long term game. Even the best of the companies can have issues with governance, operations, supply chain and demand. We need patience, perseverance and persistency sometimes. Avoid being impulsive, hasty and emotional and impetuous in this journey to create generational wealth and achieve financial freedom.
With my limited knowledge I will try to give my honest assessment on the curious case of Kotak bank. Let us all try to arrive at our own logical conclusion without considering this article as a prophesy to buy or sell the stock.
My observations tell me and I might be wrong but it is obvious RBI does not have a problem with asset quality of Kotak bank. Neither is there any complex issue related to compliance and probably organizational ethics. NPAs will be known soon (3rd May Quarterly Result) but I assume with prejudice and bit of bias it will neither be a major issue.
Then what is the issue? It seems the issues are related to cyber security, data of clients and lethargy with compliances related to digital growth in foot print. Yes things might be pretty nasty here considering the wrath with which RBI came down on them.
So my logical assessment tells me that fundamentally it might not be a major worry. So there are further questions:
Will they have to spend a lot in cybersecurity etc?
Yes.
Can it effect top line growth?
Yes.
Can it hamper the growth of the bank for few quarter or more?
Yes.
Will I be selling the stock I hold?
Probably not unless they hit my predetermined stop loss.
Will I buy Kotak bank right now as it has fallen more than Rs.200 and is at mouthwatering levels?
No. Not right now.
Why not?
Because we do not catch a falling knife. We will catch the bouncing ball.
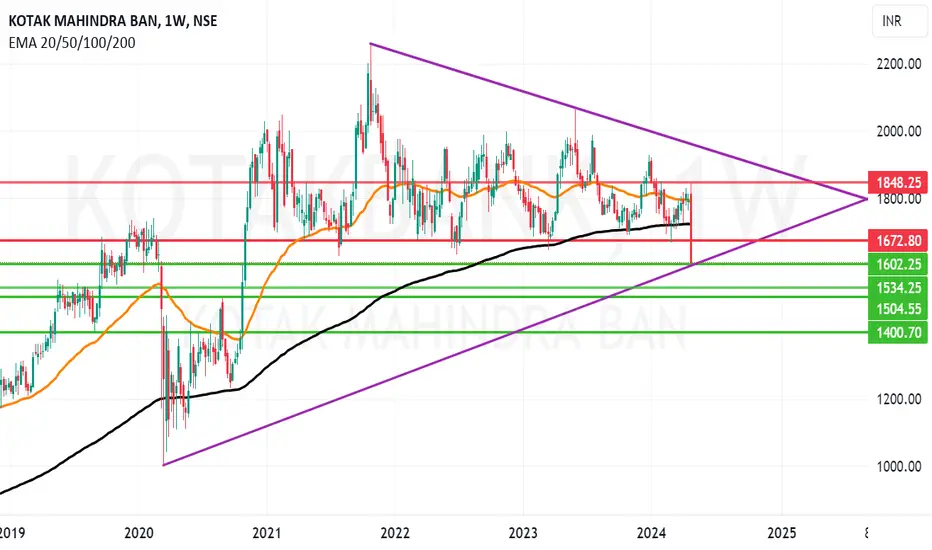
What does the chart of Kotak Mahindra Bank say?
The Zone between 1602 and 1534 has potential to provide a strong support. If 1534 is broken on weekly closing. We may see new multi-year lows of 1504 or even 1400 (As of now). 1640, 1672, 1700 and 1721 will be very tough resistances to cross. This is what my analysis of chart says. Do not take it as a buy or sell call. Take a wise descision before giving a knee jerk reaction and selling in hurry or panic. One good quarter and things can be back to normal. I personally hold Kotak bank currently in my portfolio. I may rethink my further call to action if 1534 or 1504 are broken as of now I might not sell this stock. I may add on bounce at an opportune time.
Disclaimer: Investment in stocks, derivatives and mutual funds is subject to market risks, please consult your investment advisor before taking financial decisions. The data provided above is for the purpose of analysis and is purely educational in nature. The names of the stocks or index levels of spot Nifty mentioned in the article are for the purpose of education and analysis only. Purpose of this article is educational. Please do not consider this as a recommendation of any sorts.
GBP/JPY- TRADE UPDATE / TRADE PLACED On June 9th 2021✯✯✯✯✯✯✯✯✯✯✯✯✯✯✯✯✯✯✯✯✯✯✯✯✯✯✯✯✯✯✯✯✯✯✯✯✯✯✯✯✯✯✯✯✯✯✯✯✯✯✯✯✯✯✯✯✯✯✯✯✯✯✯✯✯✯✯✯✯✯✯✯
✯✯✯✯✯✯✯✯GBP/JPY- TRADE UPDATE- 06-09-2021- Trade Placed✯✯✯✯✯✯✯✯✯✯✯✯✯✯✯✯
✯✯✯✯✯✯✯✯✯✯✯✯✯✯✯✯✯✯✯✯✯✯✯✯✯✯✯✯✯✯✯✯✯✯✯✯✯✯✯✯✯✯✯✯✯✯✯✯✯✯✯✯✯✯✯✯✯✯✯✯✯✯✯✯✯✯✯✯✯✯✯✯
✯✯✯✯✯✯✯✯GJ- GBP/JPY- Weekly Forex Trade Analysis- 06-06-2021 - 06-11-2021✯✯✯✯✯✯✯
✯✯✯✯✯✯✯✯✯✯✯✯✯✯✯Trade Idea Information And Market Analysis✯✯✯✯✯✯✯✯✯✯✯✯✯✯✯✯✯✯✯✯✯✯✯✯✯✯✯✯✯✯✯✯✯
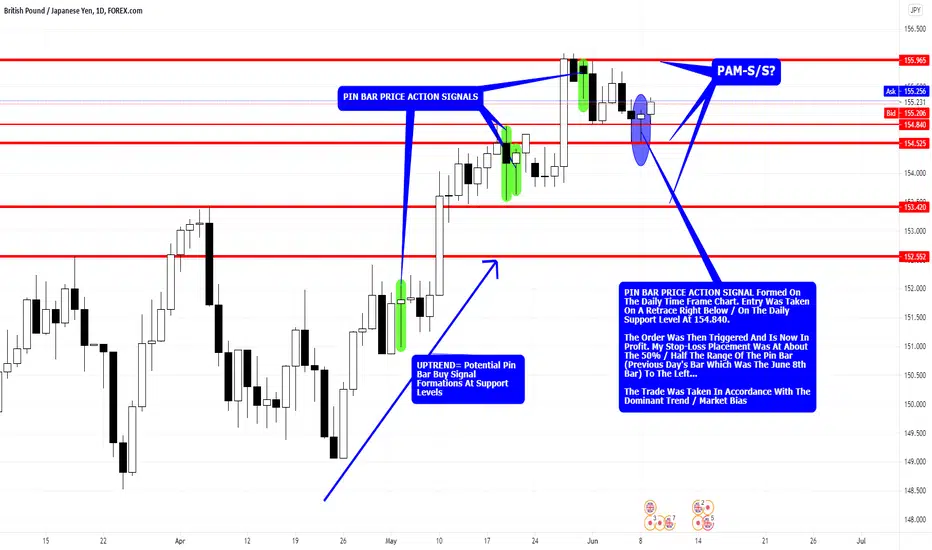
The ANALYSIS POSTED - The TRADE TAKEN... The Trade Was Now Taken On A PIN BAR PRICE ACTION BUY SIGNAL Formation That Was Formed On The Daily Time Frame Chart. Entry Was Taken On A Retrace Right Below / On The Daily Support Level At 154.840.
The Order Was Then Triggered And Is Now In Profit. My Stop-Loss Placement Was At About The 50% / Half The Range Of The Pin Bar (Previous Day's Bar Which Was The June 8th Bar) To The Left...
The Trade Was Taken In Accordance With The Dominant Trend / Market Bias.
I Will Update The Trade As It Progresses...
✯✯✯FOR EDUCATIONAL PURPOSES ONLY And TO SHOW WHY I WAITED - WHAT I WAITED FOR - WHEN I TOOK THE TRADE - HOW I TOOK THE TRADE And WHERE I TOOK THE TRADE... AND MOST IMPORTANTLY HOW I AM MANANGING THE TRADE