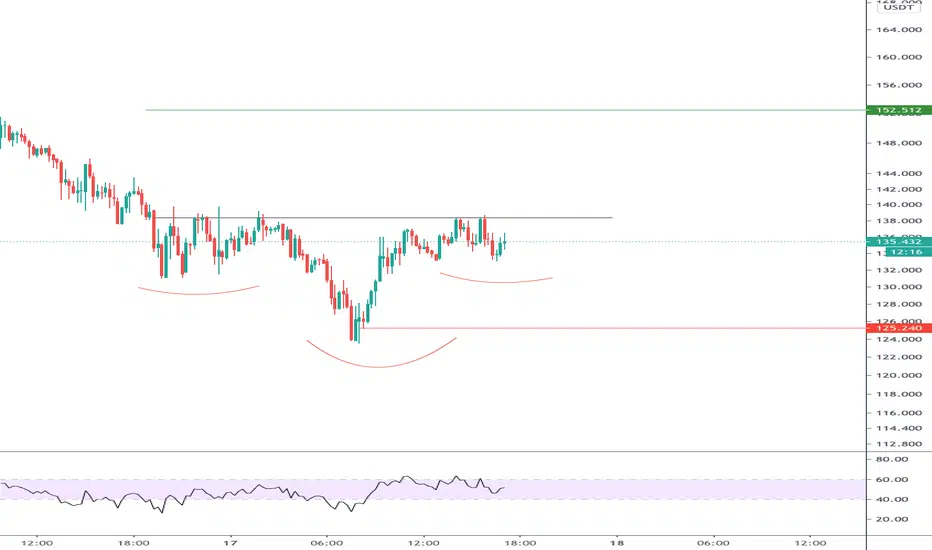
Follow the happy man, target 152Did you see t he happy man?
Following the reversal head & shoulders pattern.
If it breaks 138,5 then target will be 152.5
SL 125.2
Please follow 15m chart and candle close prices. Please wait for the confirmation to enter the trade.
And I'd be happy to see your comments if you join the trade.
EGLD
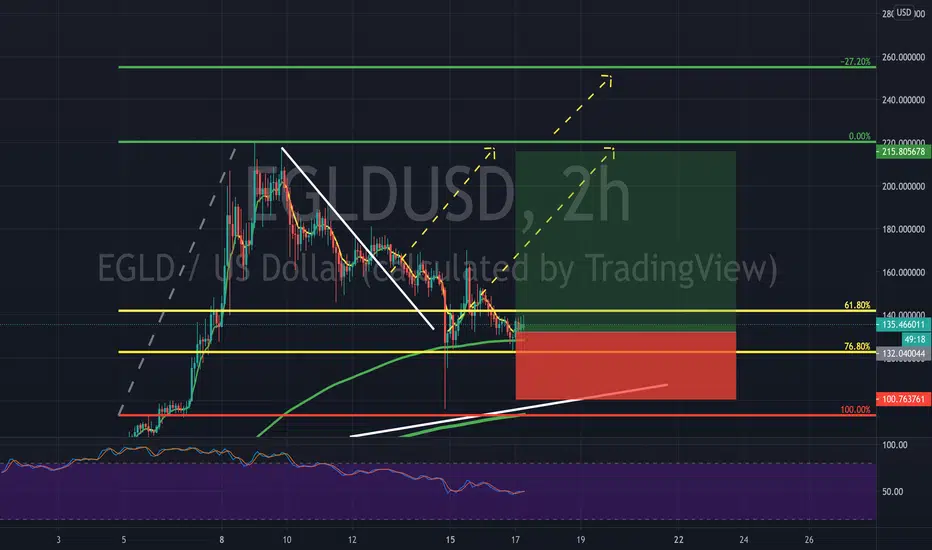
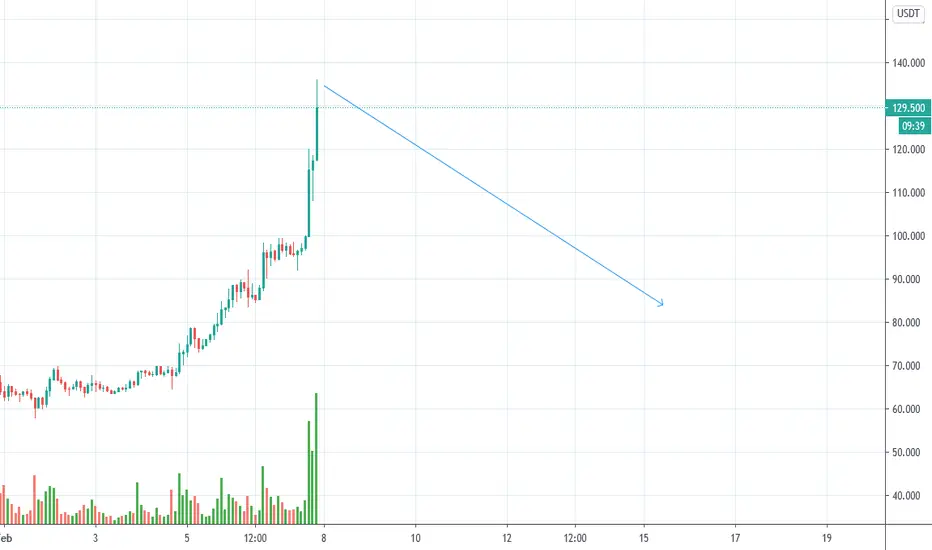
EGLD straight oblique descent, where to?There are some options and some levels in my drawing.
Take care of your hard worked money!
Cheers!

Elrond EGLDUSD - Crypto - potential 100% move? Elrond EGLDUSD - Crypto - potential 100% move? We are expecting bigger things for EGLD. We can start with the double up. Research this one. Not financial advice.
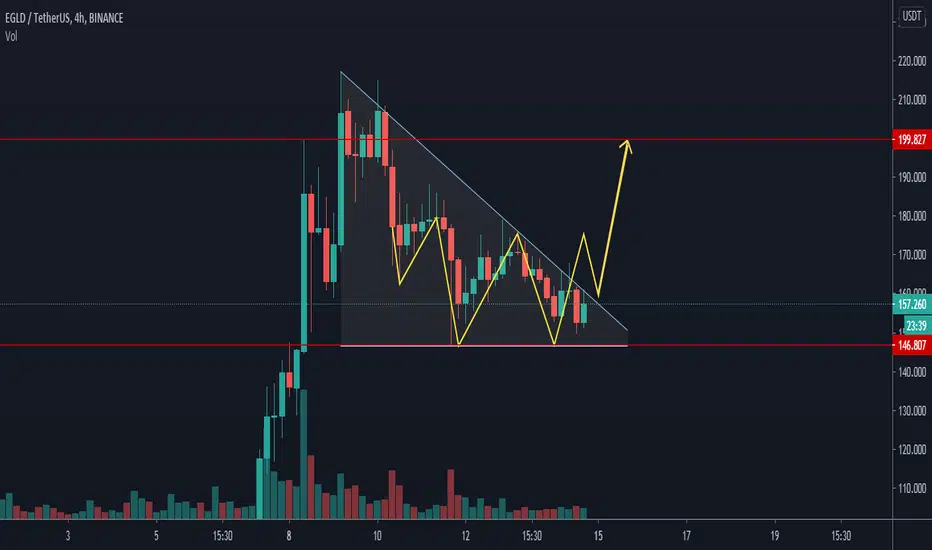
EGLD forming a Descending triangle?Neutral position, key things to watch for is dips below the Descending triangle pattern, and of course the break above.
BTC known to affect altcoins, any real price movement downward with BTC could cause EGLD to break below into the next support line.
Stop Limit to protect the assets.

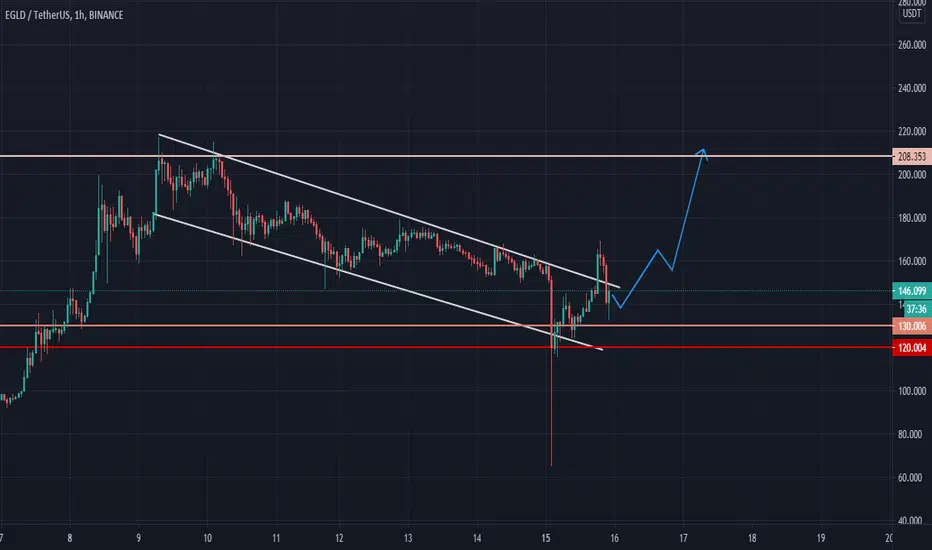
EGLD usdt - falling prices for eGoldHowever, the support levels on all timeframes have been rising. EMA is rising on the 15m chart.
Will we see a recovery or will it drop further?

Do you think this pattern is possible on the EGLD?Do you think this pattern is possible on the EGLD?
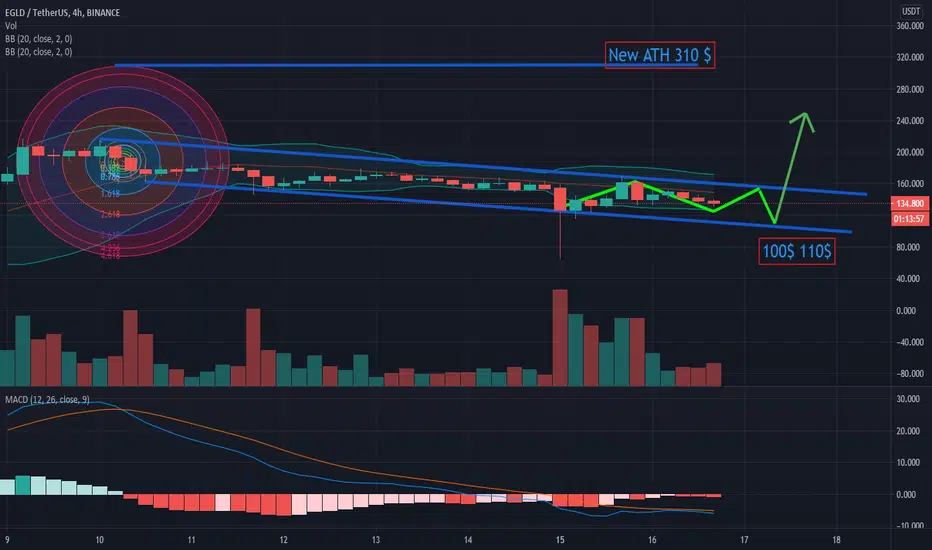
EGLD to 300$ EGLD is super bullish and its at a perfect buying zone. This will give very good profit from here. Keep an eye on this
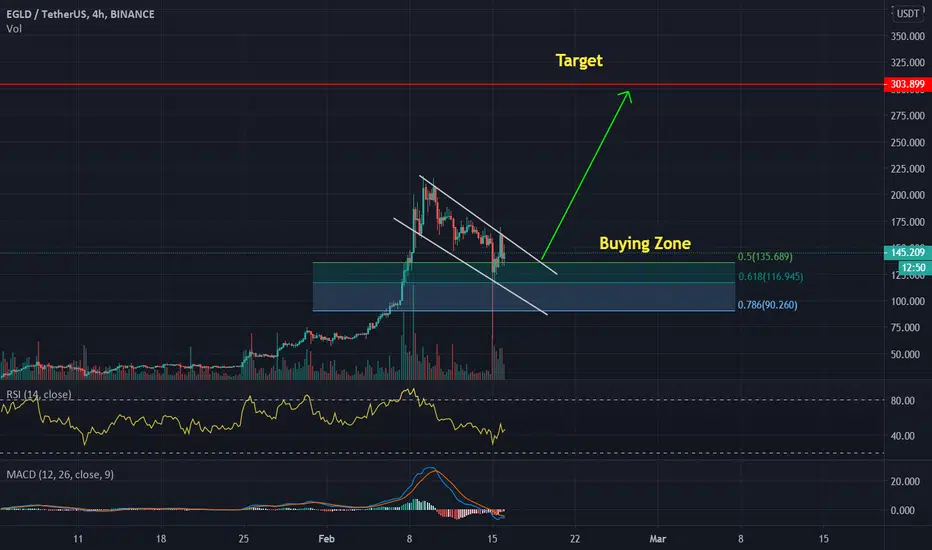
EGLD to 300$ EGLD is super bullish and its at a perfect buying zone. This will give very good profit from here. Keep an eye on this.
Guys please our other channel "https://tradingview.sweetlogin.com/u/profittraders23/", we post more trades there.

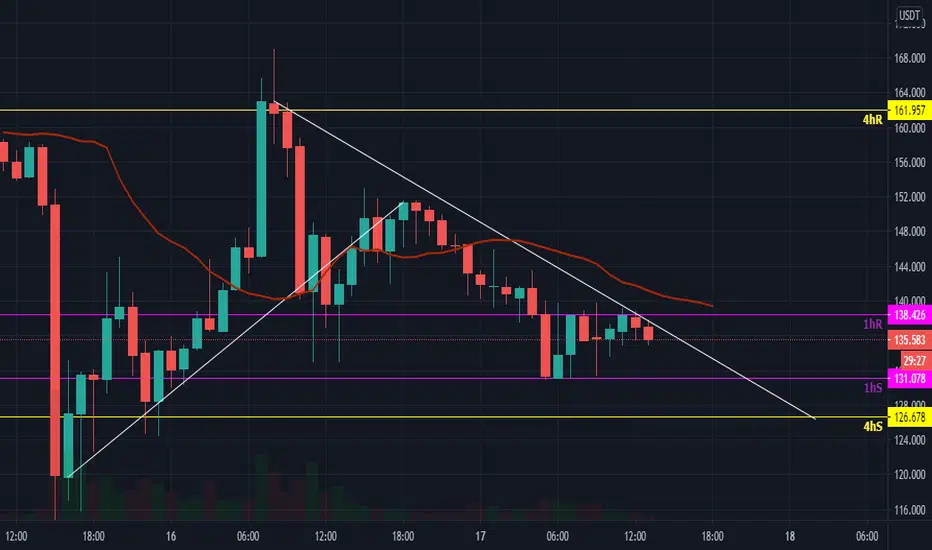
EGLDUSDT Long term basic chartSupport line is 130 . It will based on price action and short term targets.
Breakdown level is 120
*Please hold yourself and ALTs. Don't rush to buy anything which on all time high or +%100s. Be responsible for your wallet.*
Follow me to stay up to date.
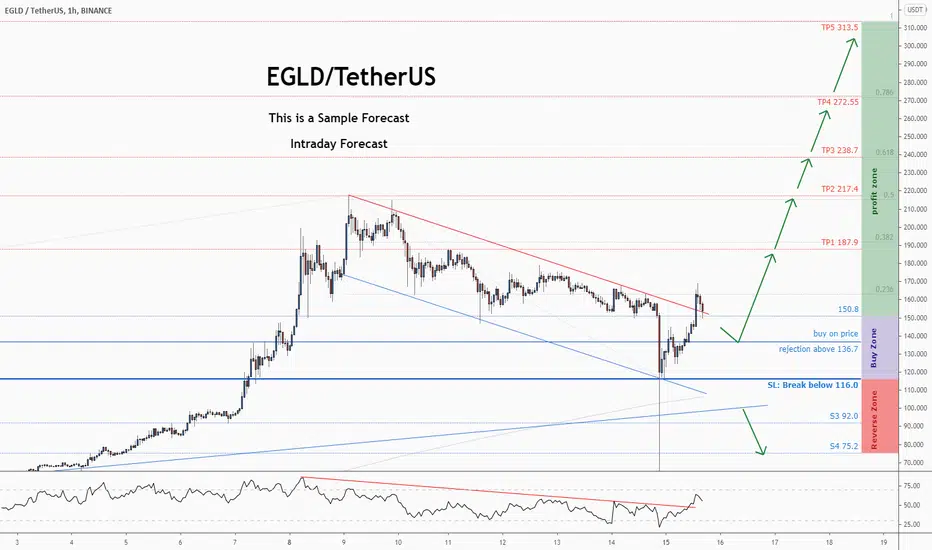
💡 Don't miss the great buy opportunity in EGLDUSDTTrading suggestion:
. There is a possibility of temporary retracement to suggested support line (136.7). if so, traders can set orders based on Price Action and expect to reach short-term targets.
Technical analysis:
. EGLDUSDT is in a range bound and the beginning of uptrend is expected.
.The price is above the 21-Day WEMA which acts as a dynamic support.
. The RSI is at 55.
Take Profits:
TP1= @ 187.90
TP2= @ 217.40
TP3= @ 238.70
TP4= @ 272.55
TP5= @ 313.50
SL= Break below S2
❤️ If you find this helpful and want more FREE forecasts in TradingView
. . . . . Please show your support back,
. . . . . . . . Hit the 👍 LIKE button,
. . . . . . . . . . . Drop some feedback below in the comment!
❤️ Your Support is very much 🙏 appreciated! ❤️
💎 Want us to help you become a better Forex trader ?
Now, It's your turn !
Be sure to leave a comment let us know how do you see this opportunity and forecast.
Trade well, ❤️
ForecastCity English Support Team ❤️
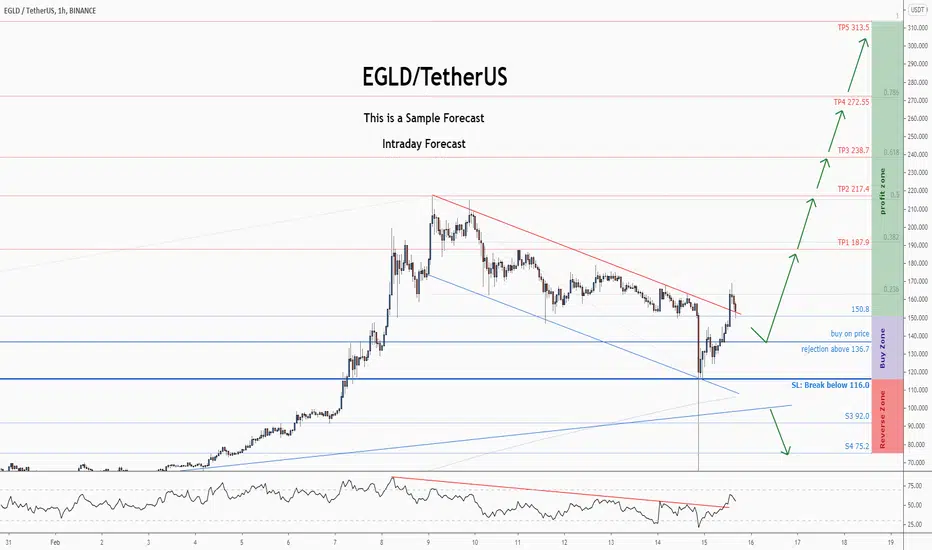
Head and Shoulders pattern on EGLD token ?As you can see a bearish pattern is forming on the EGLD chart the head and shoulders with the pull back confirmation.
maybe a chance to buy the dip ?
Price target 120usd to 140usd.
***NOT FINANCIAL OR INVESTEMENT ADVICE***

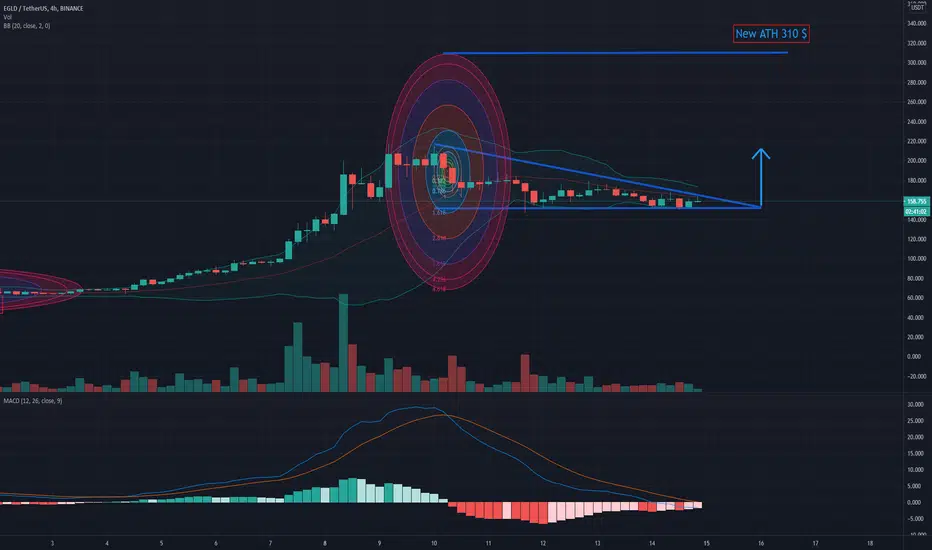
ELROND EGLD preparing to hit $300 ?reasons:
1. candle hit the 50 SMA line. 4H MACD just landed to nearly zero level. descending volume. cooling down almost over?
2. hoping to see double bottom pattern, or a bullish descending triangle pattern.
3. fundamentally still on hyper active development & partnership going on. Staking on MAIAR app is not even live yet. DYOR
--
!! That is my personal hope & observation nor financial advice. I am not self-claimed pro/wizard TA analysist lol.
just documenting my own reasons of my investment & trading.

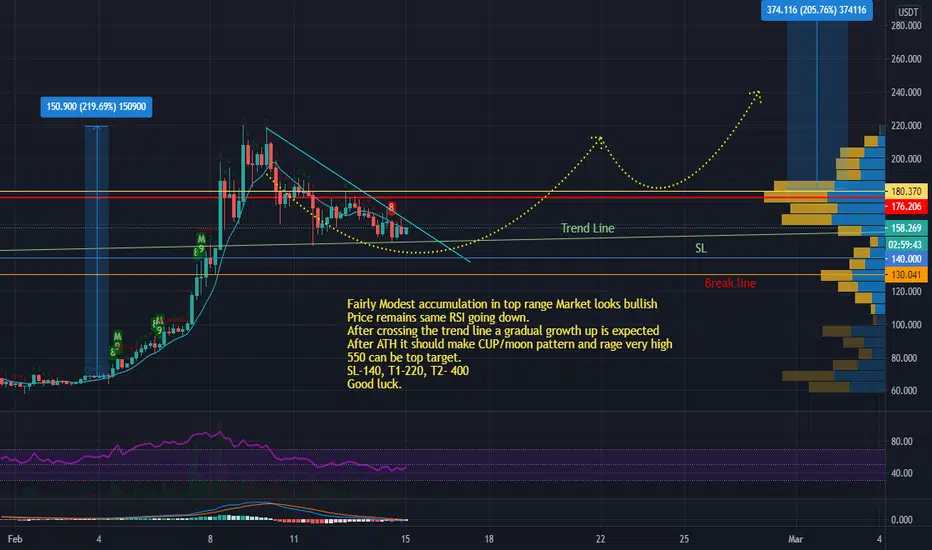
High Growth potential Long around - 155 (USDTPERPBINANCE)Fairly Modest accumulation in top range Market looks bullish
Price remains same RSI going down.
After crossing the trend line a gradual growth up is expected
After ATH it should make CUP/moon pattern and rage very high
550 can be top target.
SL-140, T1-220, T2- 400
Good luck.

THIS IS VERY EXCITING. POSSIBLE BREAKOUT?This is only a 15 minute chart, for impatient ones like me. Not the most stern, but might be a strong indicator of breakout.

EGLD You can get over 400% from this forecast !! Elrond is in retracement phase in its bullish trend line. However we have a divergence after ATH. We should wait for more decreasing until about 90$. The maximum target is 474$. Enjoy that.

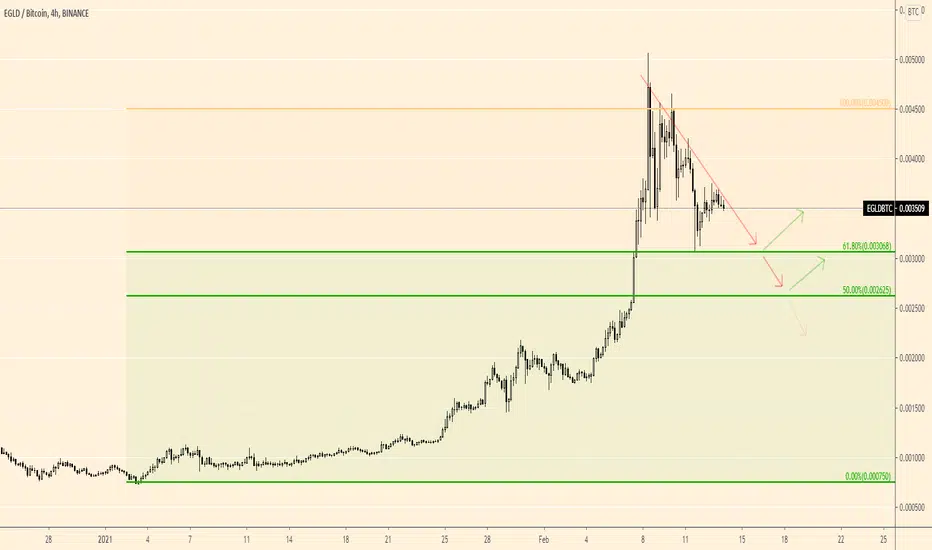
EGLD/BTC 13-FEB-2021 (4-hr)Resistance at 4500
Support at 3000
If that support fails then it falls towards 2625 > 2100
Plan Your Tades and
Trade Your Plan.
Update on EGLD/USDT price action. It's been almost 3 months of uptrend for this particular pair, the current marked brown lines shows a resting stage which more or less another accumulation stage. If the price should close above the top line, $EGLD will be on the run to $500 region in no time meanwhile if the price break below the lower trend line the correct might have a long tail wick to 110 - 120 region. $EGLD still bullish imo
