EGLD Breaks Key Downtrend – Is This the Beginning?📊 Detailed Technical Analysis (Daily Timeframe):
🔍 1. Market Structure & Chart Pattern
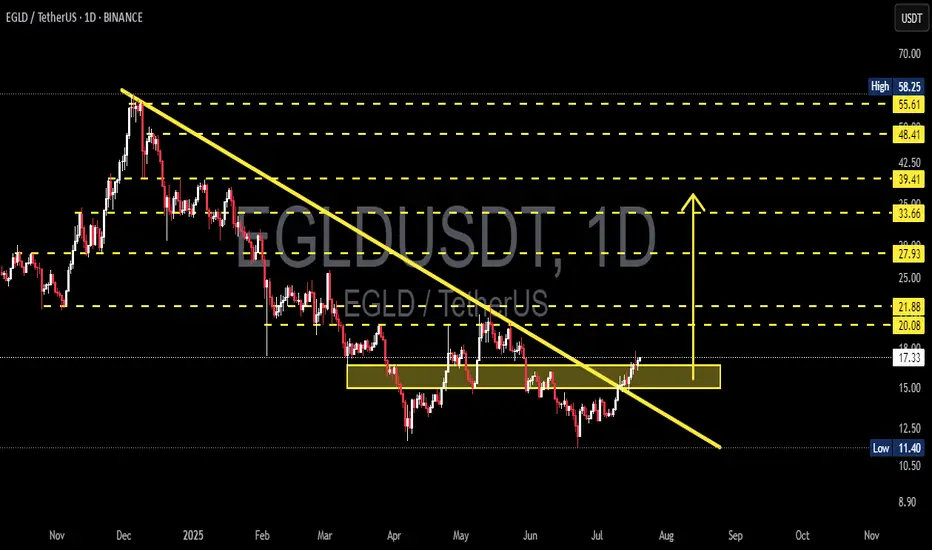
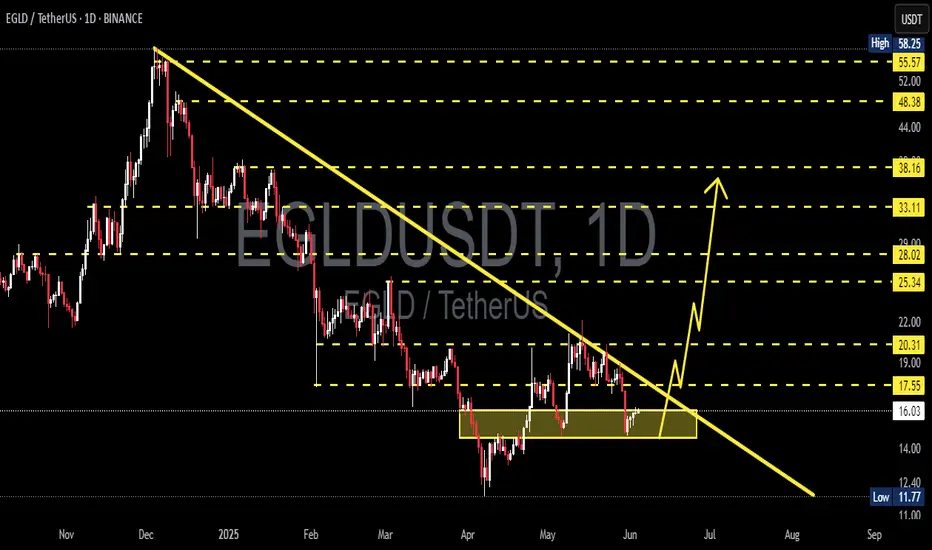
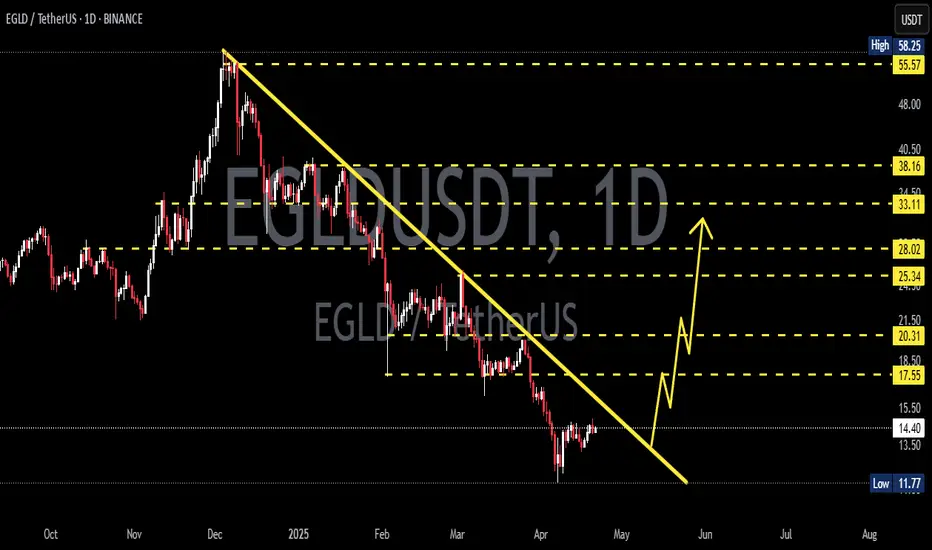
Major Downtrend Line Breakout – Reversal Signal:
After being stuck under a persistent downtrend for nearly 9 months, EGLD has officially broken out of the descending trendline, signaling a potential shift from distribution to expansion phase. This breakout is significant and could mark the beginning of a new bullish trend.
Double Bottom + Accumulation Range:
Price action shows a clear double bottom formation within the $13.00–$16.50 range, which acted as a strong accumulation zone. This horizontal structure suggests buyers have been silently accumulating before triggering this breakout.
Resistance Turned Support (RBS):
The breakout is now being retested around the $17 level. If EGLD holds this area, it would confirm a support flip, which is a classic bullish signal. Holding above this zone would give bulls full control over the next moves.
🟢 2. Bullish Scenario (Base Case):
If the breakout sustains with increasing momentum:
✅ Short-Term Targets:
$20.08 and $21.88 – minor historical resistance levels.
✅ Mid-Term Targets:
$27.93 and $33.66 – key levels aligning with measured move targets and Fibonacci retracements.
✅ Long-Term Targets:
$39.41, $48.41, up to $55.61–$58.25 – previous key highs and psychological zones.
💡 If EGLD successfully retests and holds above $17.00, it presents a strong opportunity for trend-following entries with favorable risk-reward.
🔴 3. Bearish Scenario (Alternative Case):
If this breakout fails (false breakout scenario):
⚠️ Price could fall back into the previous accumulation range between $13.00–$15.50.
A breakdown below that range could drag EGLD further down toward $11.40, or even $10.00 – a crucial long-term support zone.
Lack of volume or weak bullish confirmation would be early signs of a failed breakout.
🧠 4. Sentiment & Broader Context:
🌐 This breakout comes at a time when altcoin capital rotation is starting to emerge as BTC dominance cools off.
🚀 EGLD, as a smart contract platform, historically performs well during altseason waves and ecosystem narratives.
✅ Final Thoughts:
> EGLD has printed a significant breakout from long-term bearish control. With accumulation completed and momentum building, this may be the beginning of a bullish cycle. However, staying above the $17 level is the key validation to confirm this trend reversal.
#EGLD #EGLDUSDT #CryptoBreakout #AltcoinSeason #TrendReversal #CryptoAnalysis #TechnicalAnalysis #BullishSetup #DoubleBottom
Egldusdt
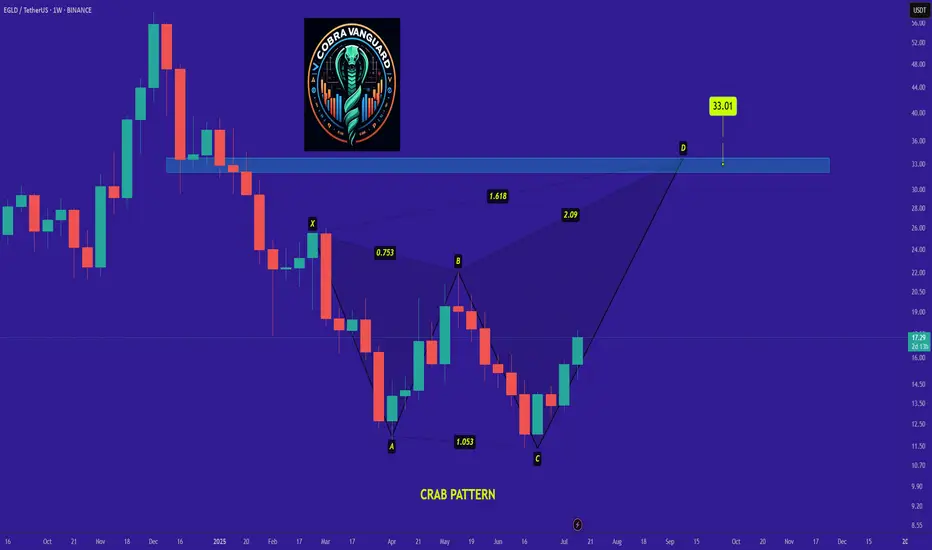
EGLD is bullish now & many Traders don't see it !!!Be careful with EGLD !!!
we can hope that the price will act like a Crab pattern and the price will grow well.
I expect that the price will grow very quickly...
Stay Awesome , CobraVanguard.
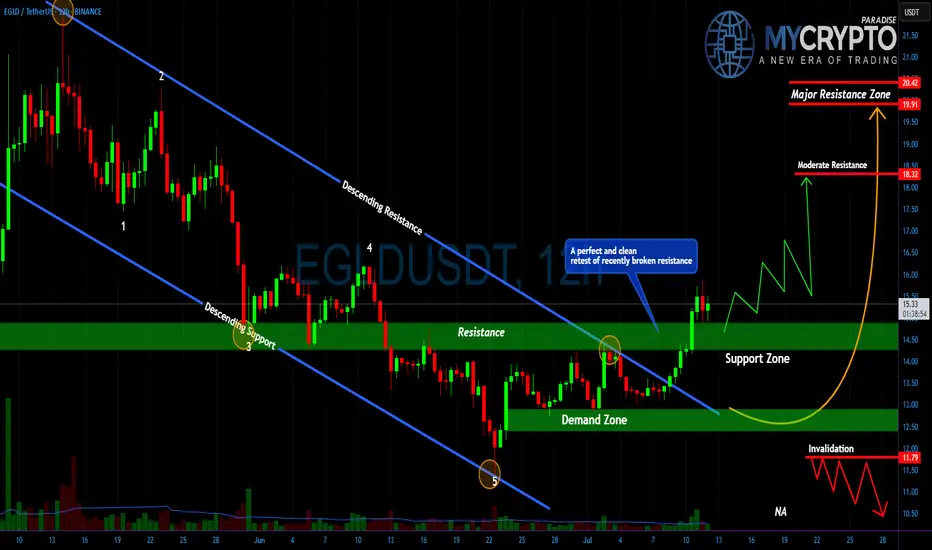
Most Will Get Trapped on EGLD’s Next Move Don’t Be One of ThemYello Paradisers, did you catch the EGLD breakout or are you still waiting for confirmation that’s already gone? While most traders are sleeping on this setup, it has just completed one of the cleanest breakout-and-retest patterns we’ve seen in weeks, and what comes next could leave many trapped on the wrong side.
💎#EGLDUSDT recently broke through its descending resistance with strength and has now retested that same level, which is acting as solid support in the $14.30–$15.00 range. This successful flip of resistance into support is a textbook bullish signal, and it’s holding beautifully indicating strong buyer presence and increasing the probability of continued upside.
💎If this support holds firm, #EGLD is eyeing a move toward the $18.00–$18.25 region, where moderate resistance is expected. A break above this could open the path toward the $19.90–$20.40 zone, a significant resistance level that may shape the next macro structure on this chart.
But it’s not all upside. If EGLD fails to hold the $13.00 level and especially the key invalidation point at $11.85 this entire bullish setup breaks down, and sellers will likely take control. The bullish momentum would collapse fast, and the door would open to much deeper downside levels.
MyCryptoParadise
iFeel the success🌴
EGLDMultiversX
Egld usdt Daily analysis
Risk rewards ratio >2.2 👈👌
Pattern = two bottoms
First target =21.3$

EGLD Analysisno need to say something , chart is speaking it self .Remember Ride the wave of the trend and let it guide you.
Best regards CobraVanguard.💚

EGLDUSDT 1D AnalysisEGLD ~ 1D Analysis
#EGLD Buy back gradually from here if you still have confidence in this coin with a short term target of at least 15%+ from here.
$EGLD Gearing Up for Next Leg – Bull Flag in PlayCRYPTOCAP:EGLD is forming a clean bull flag on the 6H chart after a strong move up.
Price is holding the trendline, and a breakout above $19.7 could target $27 that’s a 47% potential move.
This setup appears solid, incorporating confluence from Fib levels and volume zones.
Eyes on this breakout that could be explosive.
Flag breakout incoming?
DYOR, NFA.
#EGLDUSDT #Altseason2025

Bullish outlook for MultiversX (EGLD) | Eyes 40% to 100% surgeBullish outlook for MultiversX base token, egold (EGLD)
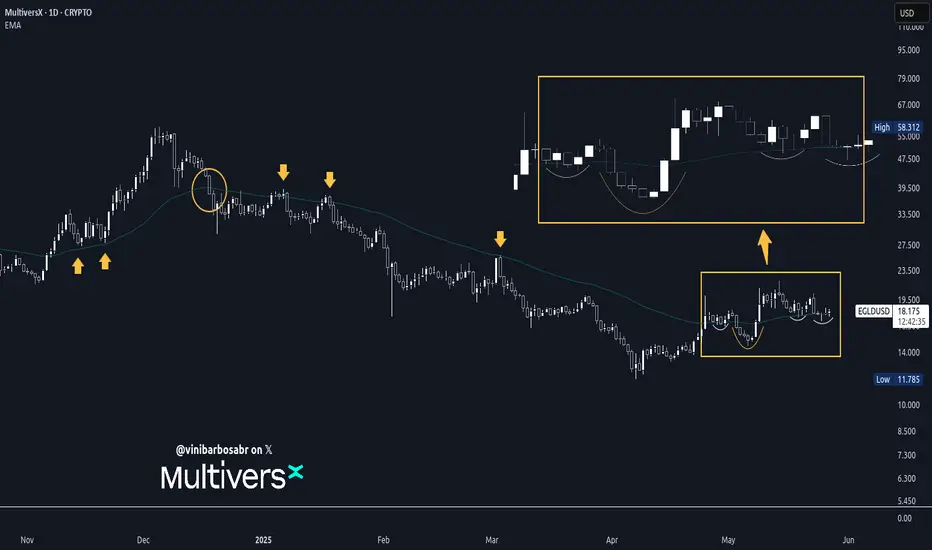
Since April 25, CRYPTOCAP:EGLD has been trading above a key trend indicator — closing 27 days above the S/R 1D50EMA, with a 6-day deviance below that line.
The 50-day exponential moving average has played a significant role for the token, indicating short- and mid-term trends and market sentiment for egold and the MultiversX chain.
This current behavior signals strength and a rising positive sentiment. I wouldn't be surprise with a sudden run to each of the previous touching points: $25.5 and $37, making 40% to 100% from the current $18.2.
Despite the targets, trading and closing all these days above the 1D50EMA marks a significant trend shift after nearly 5 months trading below this average (bearish), followed by a massive negative sentiment in the MvX ecosystem.
Things are changing in a great timing with the Andromeda upgrade activation — the biggest release for MultiversX since the mainnet launch around five years ago.
$XRP Breakout Alert!CRYPTOCAP:XRP Breakout Alert!
XRP has broken out of a long-term falling wedge on the daily chart
This classic bullish reversal pattern could drive price toward the $4.50 zone, nearly +89% upside from here! 👀
As long as it holds above the breakout zone, momentum looks strong

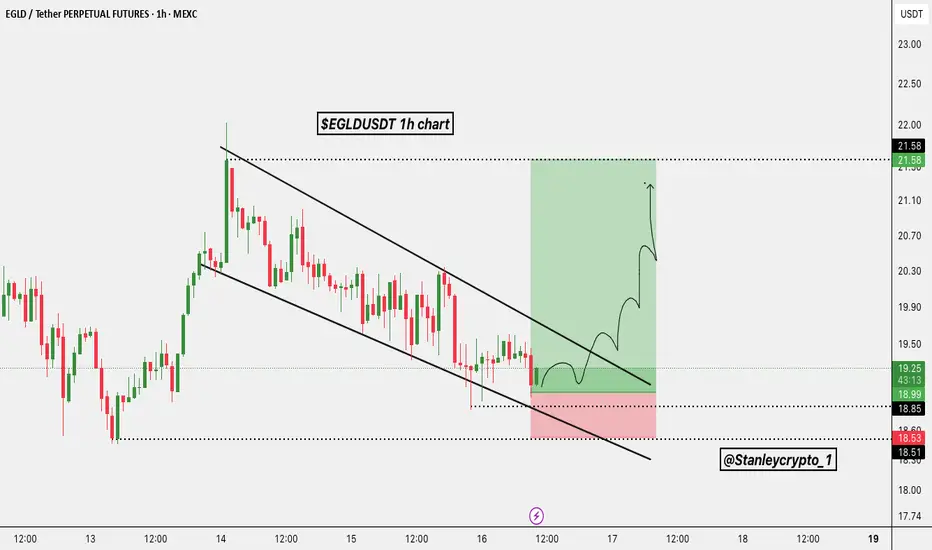
$EGLDUSDT Long Setup BINANCE:EGLDUSDT – Long Setup 🚀
TF: 1H | Pattern: Falling Wedge
Entry: $19.00–$19.20
SL: $18.53
Targets: $19.90 / $20.70 / $21.58
Bullish breakout
#EGLD/USDT#EGLD
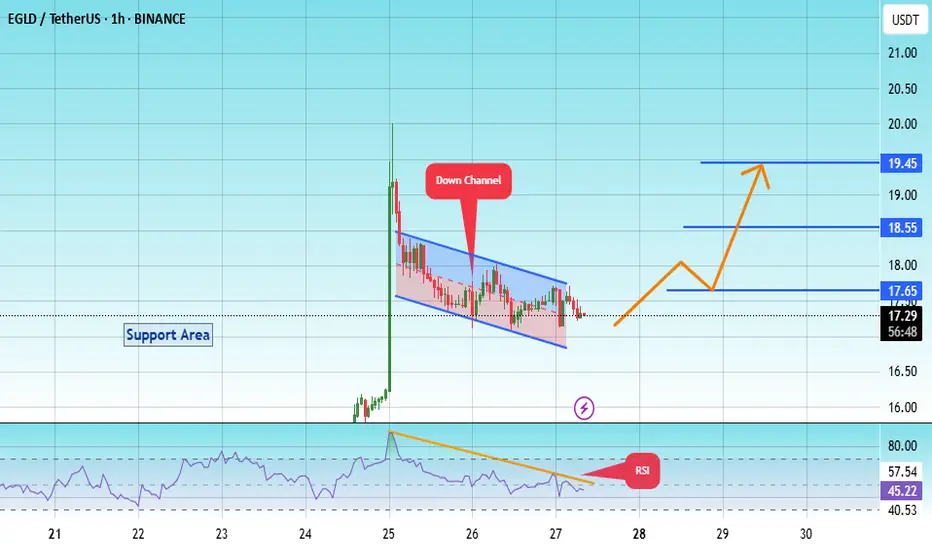
The price is moving within a descending channel on the 1-hour frame, adhering well to it, and is heading for a strong breakout and retest.
We are seeing a rebound from the lower boundary of the descending channel, which is support at 16.80.
We have a downtrend on the RSI indicator that is about to be broken and retested, supporting the upward trend.
We are looking for stability above the 100 moving average.
Entry price: 17.32
First target: 17.65
Second target: 18.55
Third target: 19.45
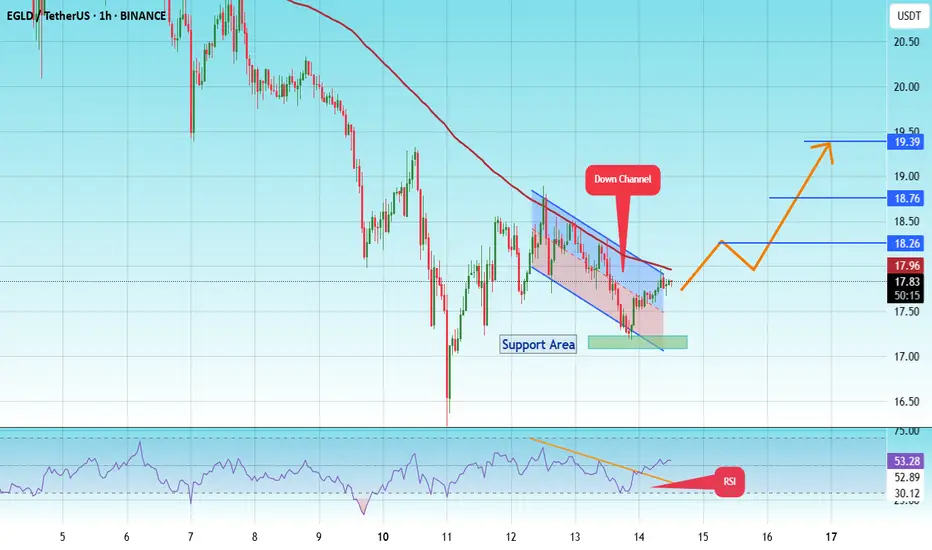
#EGLD/USDT#EGLD
The price is moving within a descending channel on the 1-hour frame and is expected to continue upward.
We have a trend to stabilize above the 100 moving average once again.
We have a downtrend on the RSI indicator that supports the upward move with a breakout.
We have a support area at the lower boundary of the channel at 17.19.
Entry price: 17.82
First target: 18.26
Second target: 18.76
Third target: 19.40
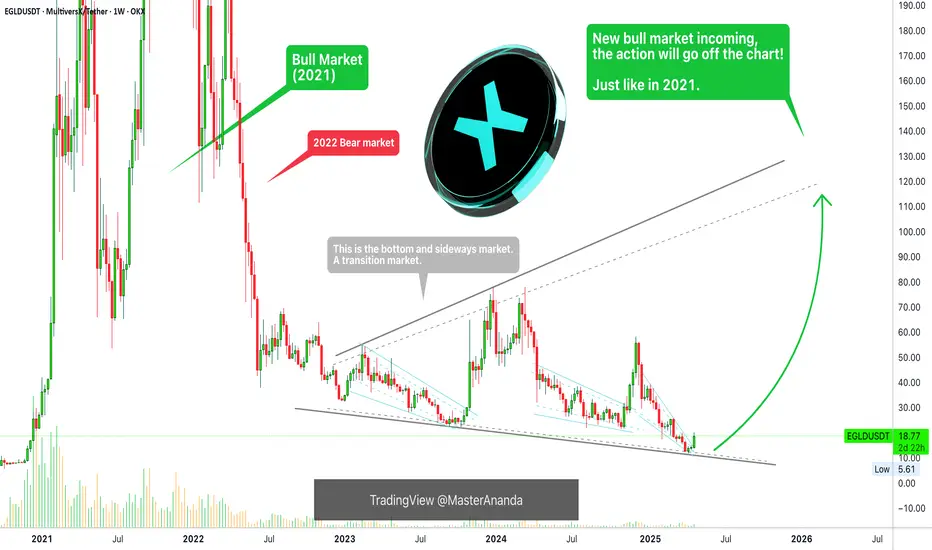
MultiversX, Crypto, Stock Market, The World & Soul PsychologyThis is MultiversX in the transition period, between bear and bull market.
I don't know if you already know what I've been saying and sharing about the transition years, 2023 and 2024. Here I have the linear chart which clearly shows the difference between a bull market vs a sideways market.
After the bottom in mid-2022 all the action has been mostly neutral, sideways. There has been some bullish waves but this is nothing compared to bull market type of action. The only reason why the waves from 2023 and 2024 looks big in my other charts is because of the log. scale. When you use linear, you can see the difference.
Late 2024 we saw some bullish action. Mid-2025 is nothing like 2022, 2023 or 2024, it will be like 2021. It will be crazy.
Now, as to the chart, the candles will extend and become really big like on the left side. So all projections will be invalidated and all the charts will become distorted.
All the action from 2023 and 2024 will become almost invisible and everything will trade at new All-Time Highs. This is what you need to prepare for.
Even with a 20%, 30% rise, this is nothing, we are still at the bottom. New All-Time Highs all across (allow for the usual variations of course).
Those pairs that didn't produce a very strong correction have limited potential for growth.
Those pairs that removed 100% of all gains from previous cycles can do huge growth.
All Cryptocurrency tradings pairs have huge potential in this year 2025 and possibly beyond.
Now, we are in the bull market year but this isn't all. There will be bullish waves and bearish waves all the years, endless opportunities. Another strong bull market in 2029, 2033 and so on. It goes on and on and on. For hundreds of years.
The stock market is already hundred of years old.
The English people and the Jews used to trade with papers more than a hundreds years ago. It evolved into what we have today.
The Cryptocurrency market is only starting now and is here to stay.
The markets will evolve but nothing will be lost, we will have the usual commodities, forex (currencies), metals, stocks and Crypto. And all the other stuff that I am not familiar with, the derivatives, bonds and other type of junk.
You are a human being. You have the living spirit within you and to read this you are using a technological device, your choice is Crypto. The rest is old.
Money evolves, the world evolves, we don't fight change, we adapt and grow.
The most important ability in this reality is adaption. The market has never stop changing, nothing is permanent other than your Soul.
Namaste.
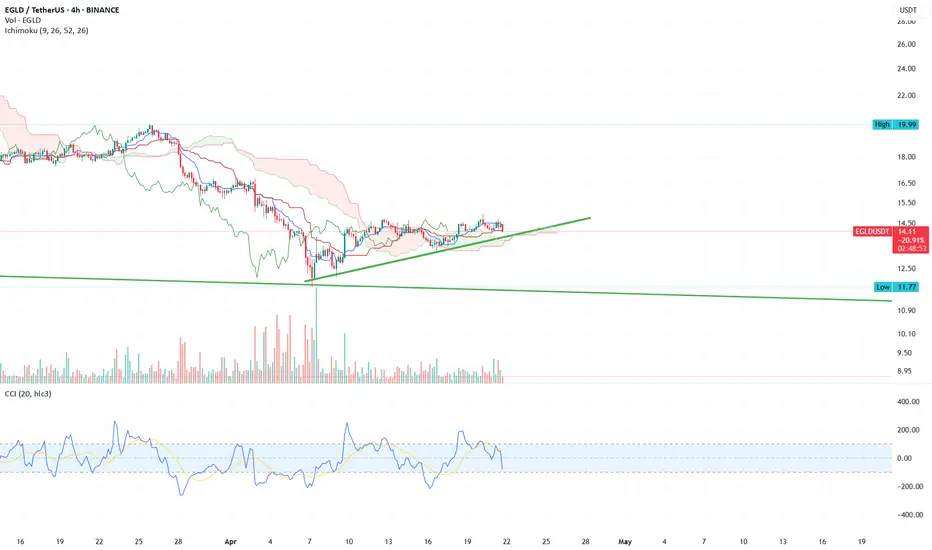
edld 📊 EGLD/USDT – 4H Technical Analysis
The price of EGLD/USDT is currently trading at $14.28, consolidating in a rising triangle pattern after a significant downtrend.
🔍 Key Observations:
Ascending trendline support is clearly holding since the April bottom, showing gradual higher lows.
Ichimoku Cloud indicates mixed signals:
Price is above the Kumo, suggesting short-term bullish momentum.
However, the cloud ahead is thin, indicating weak support/resistance levels and a potential for indecision.
CCI (Commodity Channel Index) is slightly negative around -6.91, indicating a lack of strong momentum and a possible pause or retracement.
Volume has decreased recently, showing that buyers are cautious and not yet confirming a breakout.
🧭 Key Levels:
Support: $13.44 (horizontal), $14.00 (trendline)
Resistance: ~$15.00 (local top), followed by $16.50 and $19.99 (historical high)
⚠️ Outlook:
A break above $15.00 with strong volume could confirm bullish continuation.
A break below the trendline (~$14.00) might trigger a deeper pullback toward the $13.00–$12.00 region.
EGLDUSDT 1D AnalysisEGLD ~ 1D Analysis
#EGLD Buy after successfully penetrating this resistant line with a short -term target of at least 10%+.
EGLD is ready to hit $30 (Short Squeeze)CRYPTOCAP:EGLD just hit its weekly demand zone and is showing a good reaction its about time it goes to $30.
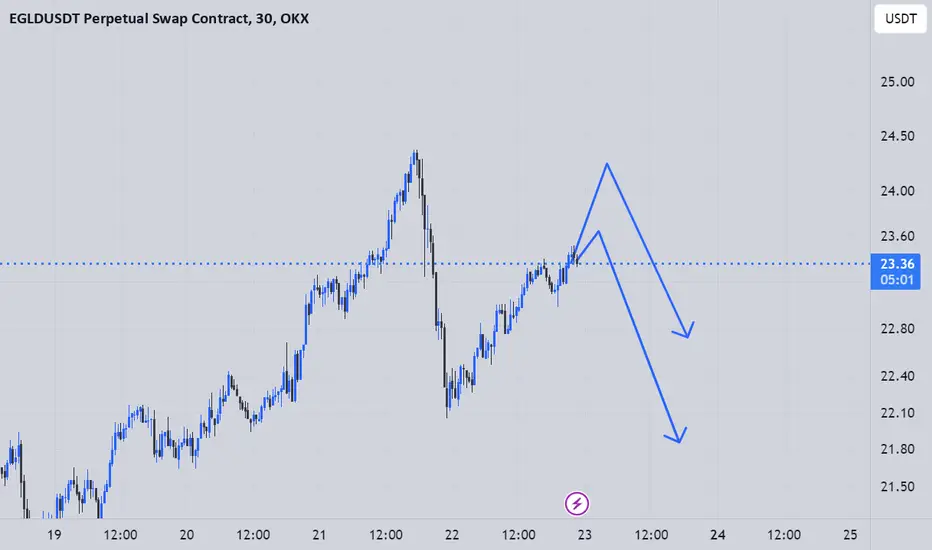
EGLD Roadmap (3D)From the point where we placed the red arrow on the chart, it seems that the correction of EGLD has begun.
This correction appears to be a diamond-shaped diametric, and we are currently in wave G of this diametric, which is a bearish wave.
We expect wave G to complete within the green zone, leading to a trend reversal for several months in EGLD.
A daily candle closing below the invalidation level will invalidate this analysis.
For risk management, please don't forget stop loss and capital management
Comment if you have any questions
Thank You

Ready for PUMP or what ?The price has formed a Triangle on the 4h time frame, and if it breaks out, it can drive the price up to around $27 .
Give me some energy !!
✨We spend hours finding potential opportunities and writing useful ideas, we would be happy if you support us.
Best regards CobraVanguard.💚
_ _ _ _ __ _ _ _ _ _ _ _ _ _ _ _ _ _ _ _ _ _ _ _ _ _ _ _ _ _ _ _
✅Thank you, and for more ideas, hit ❤️Like❤️ and 🌟Follow🌟!
⚠️Things can change...
The markets are always changing and even with all these signals, the market changes tend to be strong and fast!!

egld setup"🌟 Welcome to Golden Candle! 🌟
We're a team of 📈 passionate traders 📉 who love sharing our 🔍 technical analysis insights 🔎 with the TradingView community. 🌎
Our goal is to provide 💡 valuable perspectives 💡 on market trends and patterns, but 🚫 please note that our analyses are not intended as buy or sell recommendations. 🚫
Instead, they reflect our own 💭 personal attitudes and thoughts. 💭
Follow along and 📚 learn 📚 from our analyses! 📊💡"
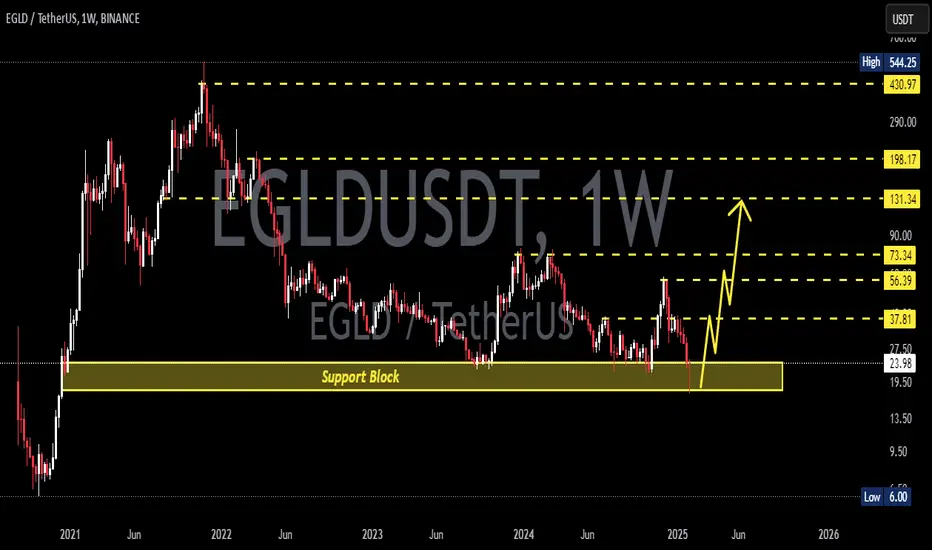
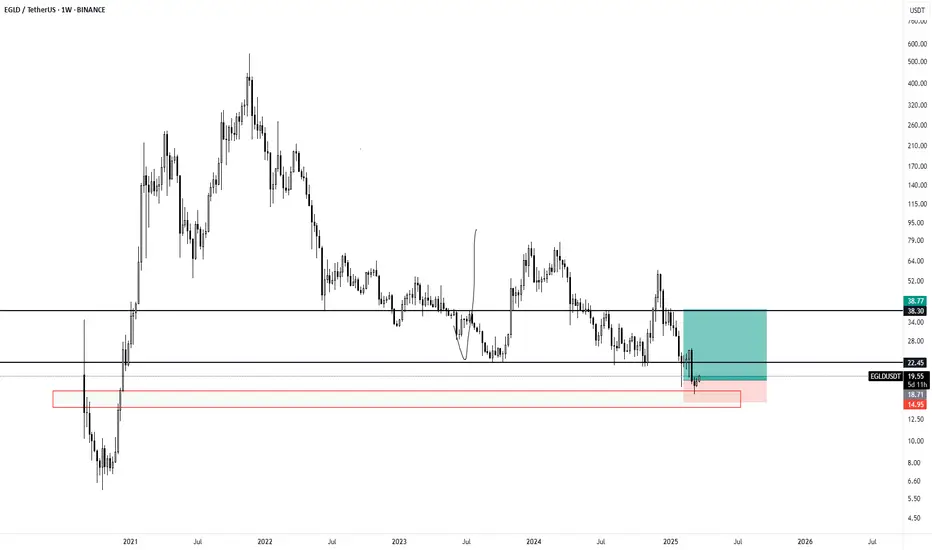
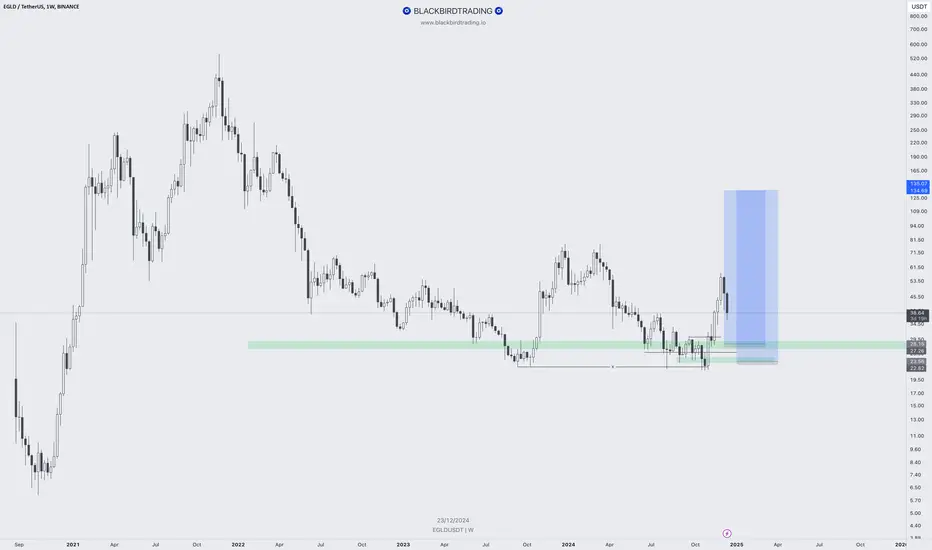
EGLD Ready !!!Hello Birdies,
MultiversX has broken out of the wedge pattern and is currently retesting it on the weekly chart.
The entry points are well mentioned on the chart beside if anything changed in the market.
A successful test above the pattern could trigger a rally towards targets at $55, $77, $112 and $235.
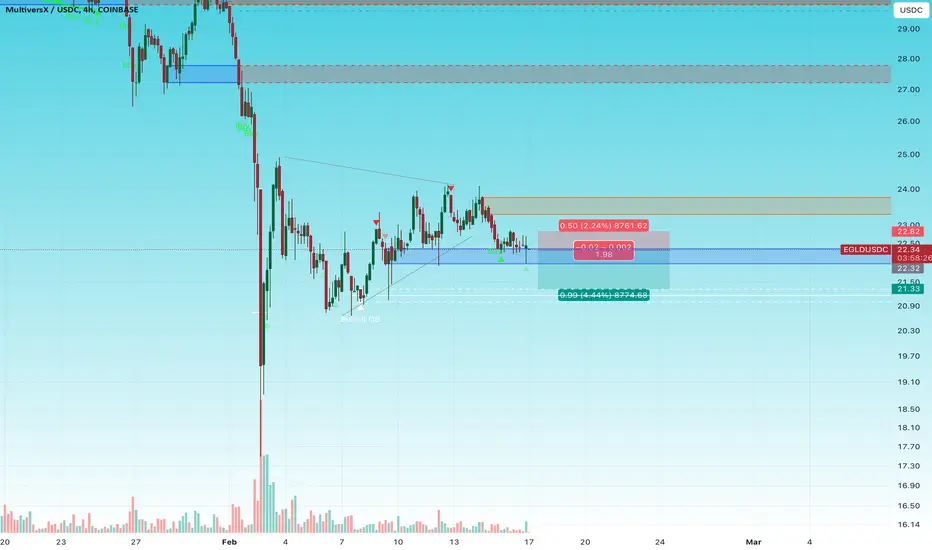
$5 drop or $5 rise ?!!!The price has formed a Triangle on the 4h time frame, and if it breaks out, it can drive the price up to around $27.
Give me some energy !!
✨We spend hours finding potential opportunities and writing useful ideas, we would be happy if you support us.
Best regards CobraVanguard.💚
_ _ _ _ __ _ _ _ _ _ _ _ _ _ _ _ _ _ _ _ _ _ _ _ _ _ _ _ _ _ _ _
✅Thank you, and for more ideas, hit ❤️Like❤️ and 🌟Follow🌟!
⚠️Things can change...
The markets are always changing and even with all these signals, the market changes tend to be strong and fast!!

EGLDUSDT 1WEGLD ~ 1W Analysis
#EGLD This is the lowest support for now. Buy from here if you still have a Conviction on this coin with a minimum target of 20%+