EGLD/USDT Bracing Bullish Shift from Support?👀 EGLD Analysis💎 Paradisers, focus on #EGLDUSDT, as it's showcasing a pattern that strongly suggests a bullish surge from its support level.
💎 #MultiversX is currently flirting with its resistance level, teetering on the edge of a breakout. It's nudging the short-term 0.618 Fibonacci retracement near $55.45 but has recently faced a setback at this fib level.
💎There's a chance CRYPTOCAP:EGLD might not sustain the initial momentum needed for a breakout. If so, we could see a downward consolidation before another crucial retest at our current support of $51.58. Once this level is firmly retested, we anticipate a significant upward movement.
Egldusdt
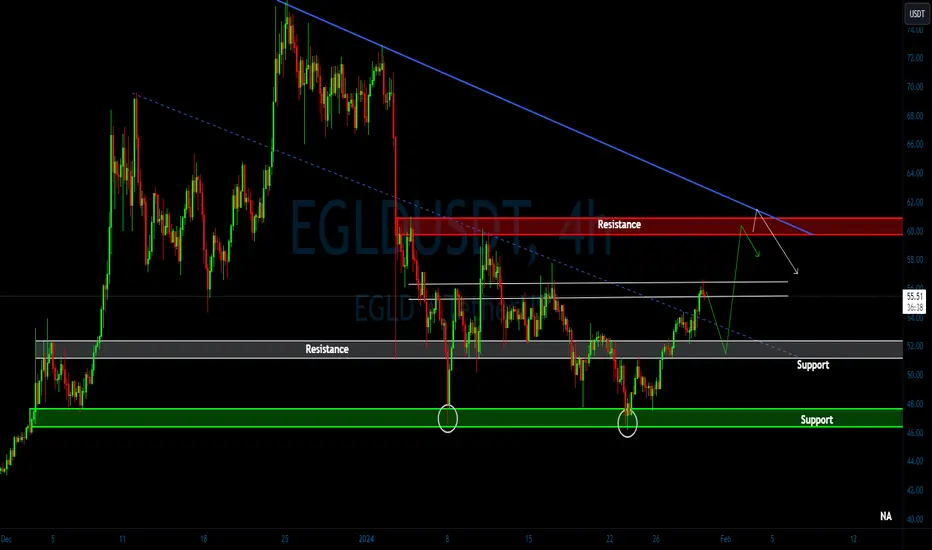
EGLD WatchOuTEgld currently on massive Resistance.
Possible rejection is going to send it lower with impulsive move.
Already in short position from Above 61()
and adding margin here from above 59.20.
Targeting much lower will se how it rejects.
Stopping if holds above 60.
Note: Not a Financial Advice.

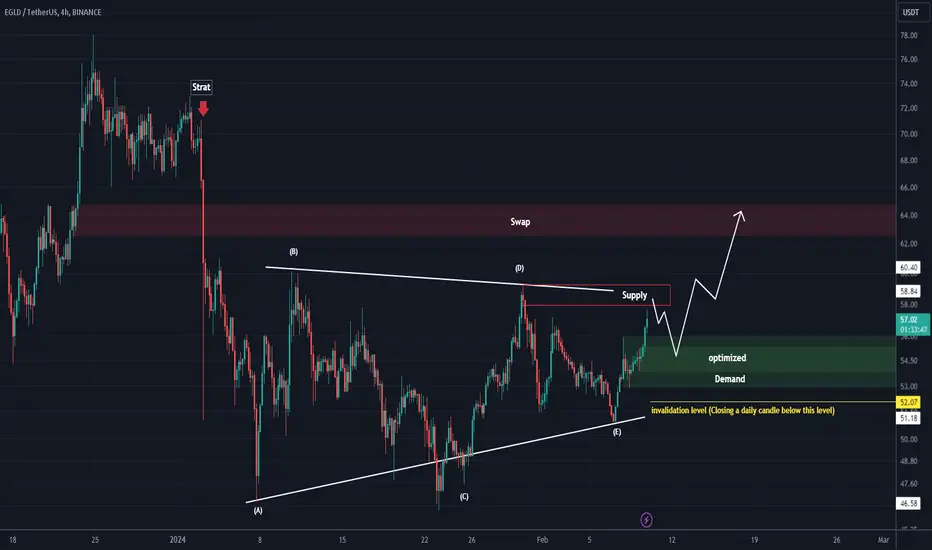
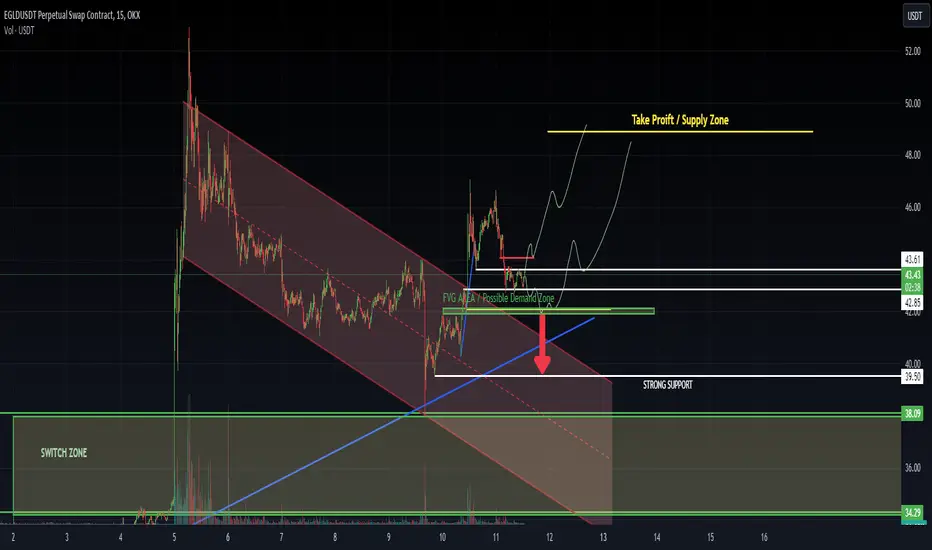
EGLD ANALYSIS (4H)From where we have inserted "start" on the chart, it looks like a Boolean triangle. If EGLD pullbacks on the green range, we will look for buy/long setups.
We have selected a swap range as the target.
Also, we specified the invalidation level on the chart, closing a daily candle below this level will violate the analysis.
For risk management, please don't forget stop loss and capital management
Comment if you have any questions
Thank You
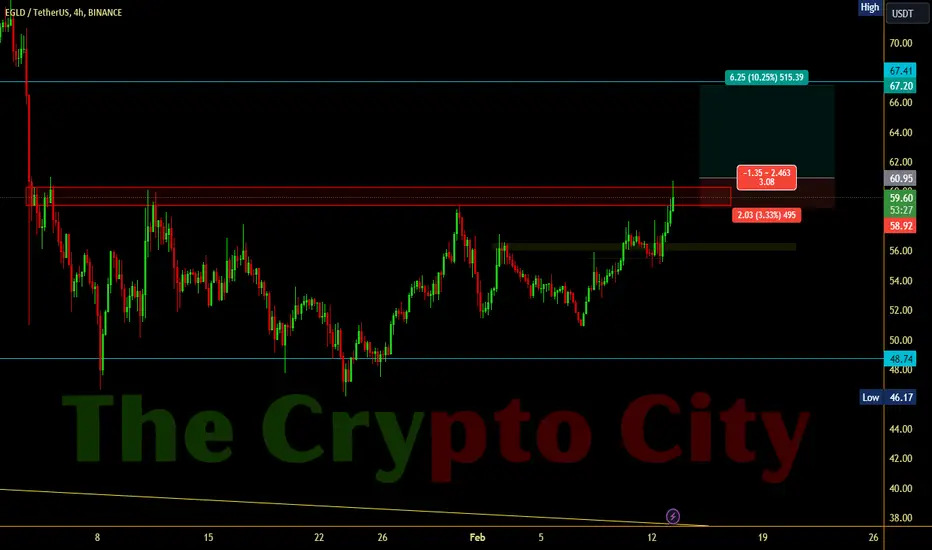
EGLD ChartThe price chart for CRYPTOCAP:EGLD shows growth potential. If it confirms a breakout above the indicated red zone, an entry point around $60.95 could be favorable. It's essential to use a stop-loss for risk management.
Everything is on the chart. All the targets are marked.
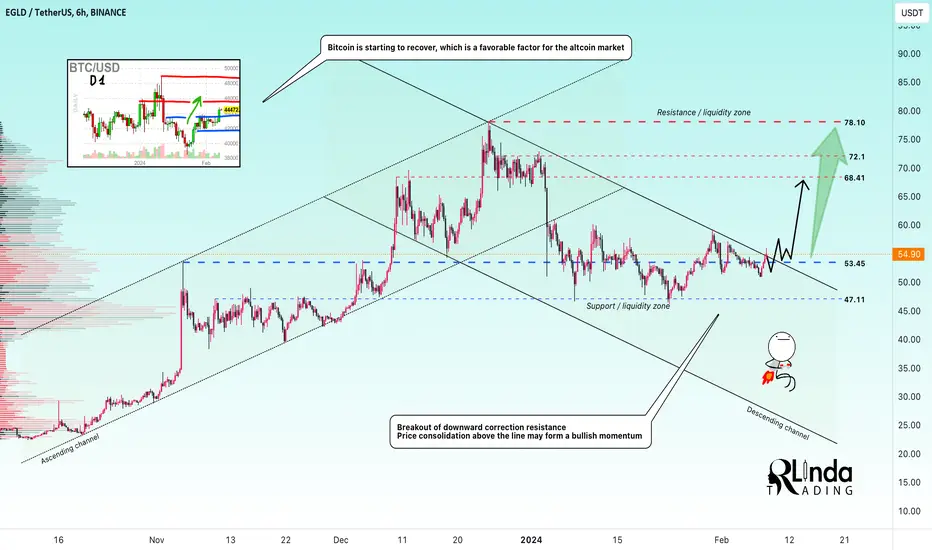
EGLDUSDT → Growth may resume after the correction stopsBINANCE:EGLDUSDT is trying to finish the technical phase of correction and continue the global uptrend amid the realization of 2-year accumulation.
Since the middle of last year, the coin was in hibernation, or rather in the consolidation phase. Formed a bottom, a narrow corridor allowed the formation of a strong support area. On the background of cryptocurrency market recovery, the growth of the flagship - bitcoin, EGLD revives, but at the same time forms trend resistance. On D2 the resistance is broken and for a few weeks the price forms a consolidation above the line, on H6 it is a descending range (correction).
On the main chart we see an attempt by price to break the correction resistance. Consolidation of price above 53.45 will form a bullish potential that could resume the uptrend.
Support levels: 53.45, 51.4, 47.11
Resistance levels: 60.1, 68.48
I expect the continuation of the global trend, but for this the bulls need to finish the correction phase, which is within the current descending channel. A breakout of the resistance and consolidation above this level will be a good signal
BINANCE:BTCUSD CRYPTOCAP:TOTAL
Regards R. Linda!
EGLD/USDT Primed for Bullish Turnaround from Key Support? 👀🚀💎 Paradisers, #EGLDUSDT as it unfolds a significant pattern, nestled at a crucial support level, and hinting at a potential bullish upswing.
💎 Observing #Multiversx's recent activity, we've noted a trend of breaking to new lows, suggesting a prevailing bearish sentiment. However, a notable aspect is the potential for a bullish reversal from the critical support of $39.48. Achieving stability at this level could catalyze a strong ascent to counter the overhead supply.
💎 As savvy traders, we're equipped for a range of scenarios. Should #EGLD fail to materialize the expected bullish reversal, we might see a rebound from a secondary demand level at $34.97. A breach below this threshold, however, could signify a significant shift to bearish momentum.

#EGLDIn time H2, it is moving inside a density, which can be a 4th wave of correction erosion, which will finally be completed with a shorter roof inside the density from the bottom to make a complete cycle of 5 waves of correction. Therefore, it is possible to enter a sell position with failure from the bottom.

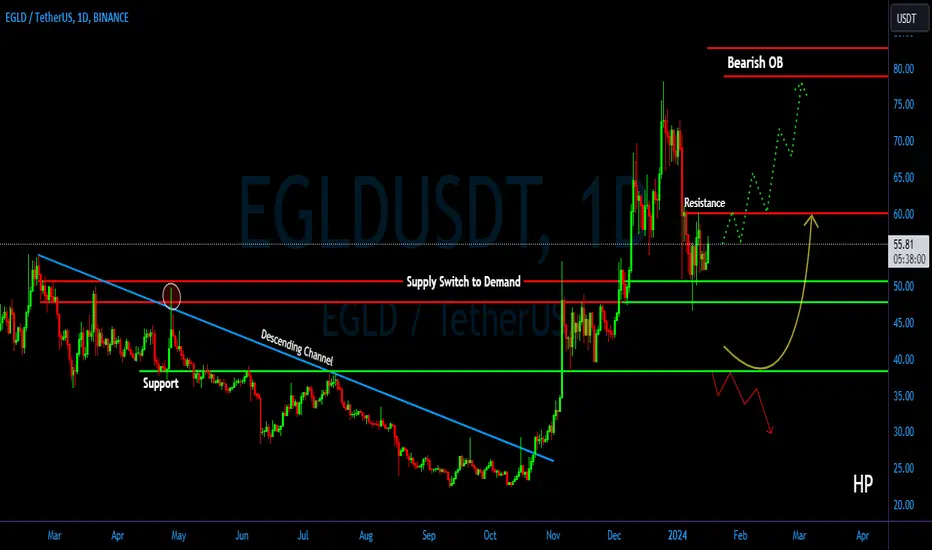
EGLD/USDT The retest is valid. Ready for Continue Upward Move ??💎 EGLD has recently exhibited remarkable market dynamics. Following a strong bounce signaled by a bullish green candle, EGLD encountered resistance at the $60 level, leading to a rejection.
💎 However, EGLD appears poised for another attempt at breaking through this resistance. A successful breach of the $60 barrier could facilitate a smoother upward trajectory, The probability propelling EGLD toward the targeted Bearish OB area.
💎 On the flip side, should EGLD struggle to surpass the $60 resistance and face another rejection, there's a likelihood of retracing back to the demand zone. Moreover, a prolonged consolidation in this demand area could weaken its support, raising the risk of a breakdown.
💎 Such a scenario would indicate a significant shift in trend, potentially leading EGLD into a bearish phase. If EGLD were to fall through the demand zone, it could descend towards the $38 support level. A breach below this support might exacerbate the downward movement, causing EGLD to explore even lower levels in the market.
EGLDUSDTAt this point, I will be following the possible movements EGLD can make. I think the likely scenario will be to see the demand zone below (around $ 41).
If it cannot see enough demand in the demand area, I think it may hit the support of $ 39, which I have been thinking about for a long time. Therefore, I will set up accordingly.
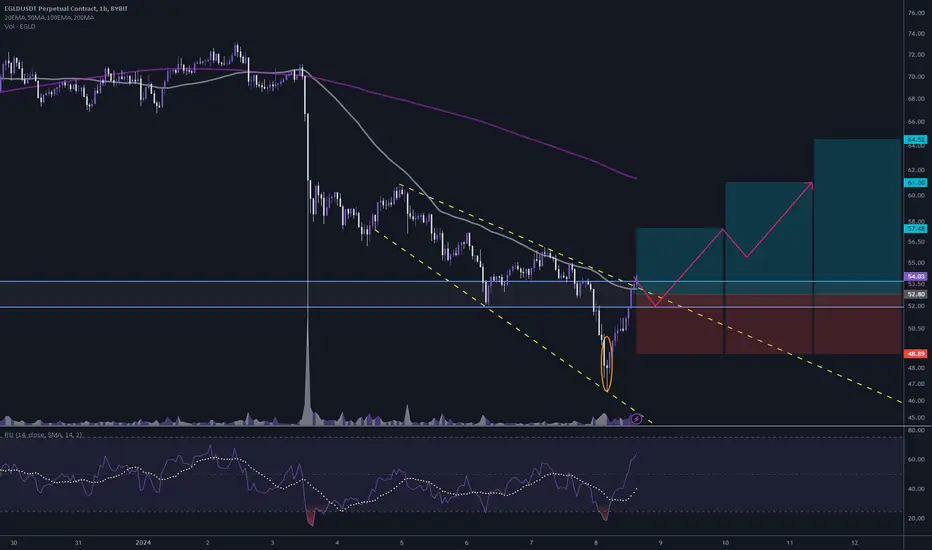
#EGLD/USDT 1h (ByBit) Broadening wedge breakoutMultiversX (f.k.a. Elrond eGold) just regained 50MA support and seems about to leg up towards 200MA resistance.
⚡️⚡️ #EGLD/USDT ⚡️⚡️
Exchanges: ByBit USDT, Binance Futures
Signal Type: Regular (Long)
Leverage: Isolated (5.0X)
Amount: 5.4%
Current Price:
54.03
Entry Zone:
53.68 - 51.92
Take-Profit Targets:
1) 57.48
1) 61.00
1) 64.52
Stop Targets:
1) 48.89
Published By: @Zblaba
SEED_WANDERIN_JIMZIP900:EGLD BYBIT:EGLDUSDT.P #MultiversX #Elrond #eGold multiversx.com
Risk/Reward= 1:1.2 | 1:2.1 | 1:3.0
Expected Profit= +44.3% | +77.7% | +111.0%
Possible Loss= -37.0%
Estimated Gaintime= 2-6 days
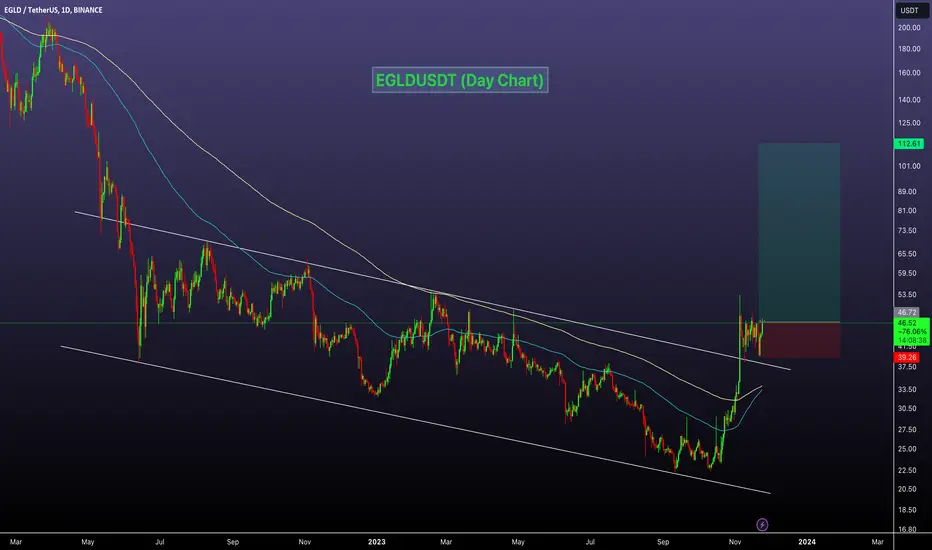
EGLD/USDT upward momentum from support? 👀🚀EGLD Analysis💎 Paradisers, turn your attention to #EGLDUSDT, as it's currently exhibiting trends that suggest a bullish transition from its current support zone.
💎 In light of recent market fluctuations, #EGLD has been on a decline. However, if it manages to sustain momentum at the support level of $46.94, there is a promising opportunity for a bullish advance towards the significant resistance level at $75.32.
💎 The dynamic nature of the cryptocurrency market demands a strategy that is both adaptable and responsive. Should #EGLD face challenges in holding above the $46.94 support level, it might be time to recalibrate our strategy.
💎 In this event, our focus would shift to a potential bullish rise from a lower demand level at $42.61. Monitoring this level is vital, as a breach below could signal the necessity for a strategic realignment, potentially pointing to challenges in maintaining a bullish trend in the #EGLD market. 🌴💰

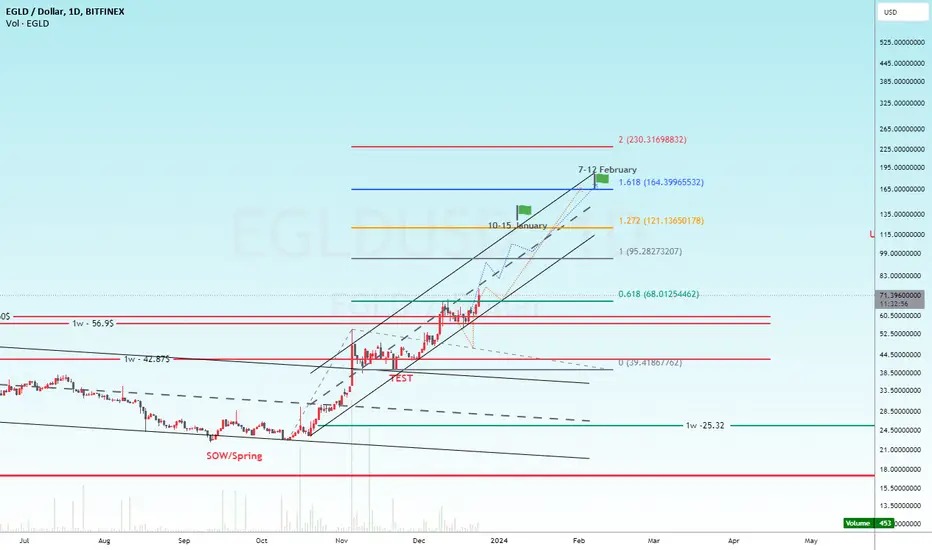
Zoomin' in: 140-170$I already added the comment to my other idea (linked below). A more conservative target would be 140-170$ if we are believers of the 1.618. This is when we don´t consider big wicks, we also look at the volume profile resistance levels and we look at the historical 0.618 retracement from previous all-time-high.
This could be a possible channel to go there, also depending on Bitcoin ETF, when first buys will be allowed, and so on....
EGLD/US Achieving a breakout a key resistance area. Bull Moment?💎 EGLD has become a standout in the market, recently achieving a breakthrough past a key resistance area. In the Lower Time Frame (LTF), the chart indicates a valid breakout and EGLD is now entering a crucial retesting phase. This phase could pave the way for a substantial upward movement, with our next target being the bearish OB area.
💎 During this retesting phase, it's essential for EGLD to demonstrate a strong bounce from the current support area, which was previously a resistance zone. This bounce is necessary to mitigate the risk of a false breakout.
💎 Failure to rebound and a closure below the current level could signal a false breakout. Such a scenario would likely reverse EGLD's trajectory, potentially leading it to a downward trend towards the next lower target, the demand area.

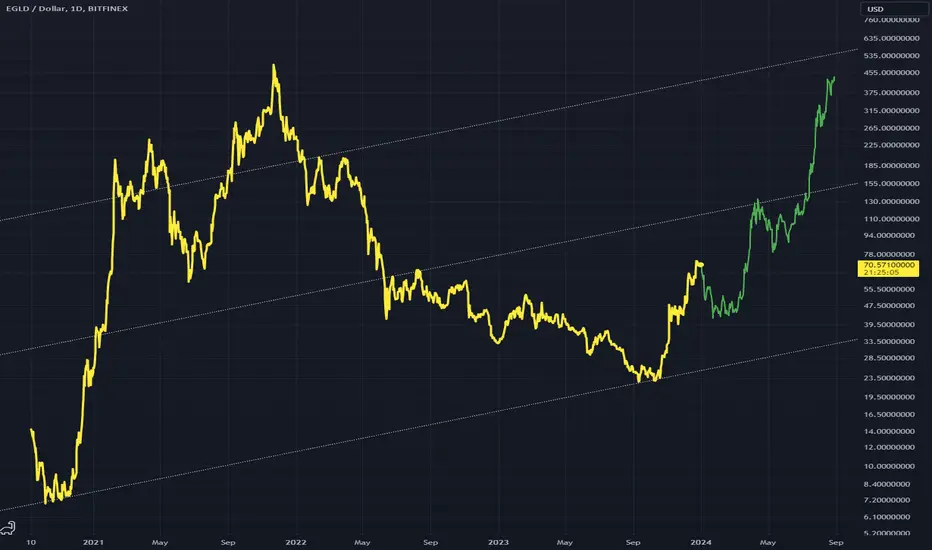
EGLDUSD IdeaThe log chart for EGLD
I expect an inverted H&S to form and then a strong reversal allowing the bulls to take control.
This control is shown with the green bars pattern.
The white dotted lines are just some areas of interest.
The bars pattern tool is great.

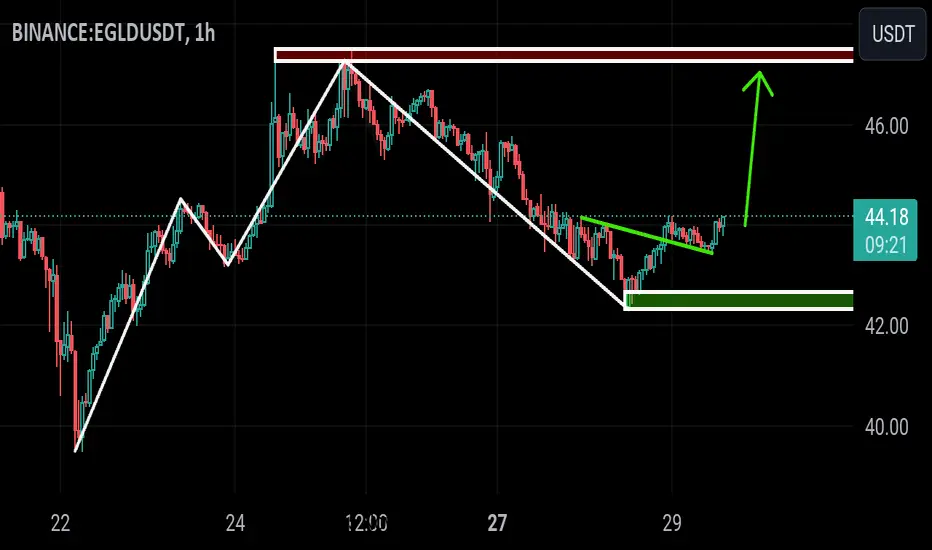
🚧EGLDUSDT will Go Up Again🚧 Road Map(DAILY)🗺️!!!
➡️EGLD has done a Impressive Movement recently but the odds of another bullish Movement is Pretty high because the pattern which EGLD is in, Is a Bullish Flag Pattern! Since The break out has not happened, there is no confirmation of a Bullish Movement But If It happens, we Can Expect a Bullish Movement as much as the Measured Price movement (flag pole) to happen!
🤑 Stay Awesome my friends.
_ _ _ _ _ _ _ _ _ _ _ _ _ _ _ _ _ _ _ _ _ _ _ _ _ _ _
Thank you and for more ideas ❤️like❤️ and 🌟follow🌟!

EGLDUSDT Probabilities for a 60% UpswingEGLDUSDT persists in honoring the uptrend trendline, maintaining movement within a long-term ascending channel. Notably, the previous supply zone has transformed into a respected demand area, significantly bolstering the likelihood of sustained uptrend continuation.
This favorable price action significantly heightens the probability of a 60% price surge in the imminent days or weeks. The key resistance at the $75 area, validated by a double Fibonacci level, stands as a crucial indicator for potential price movements.
In summary, EGLD appears notably positive at this stage, with an evident uptrend, demand zone validation, and potential for significant growth.

EGLD/USDT Bullish Continuation from Demand Zone? 👀 🚀MultiversX💎 Paradisers, let's zoom in on #EGLDUSDT as it's shaping up for an exciting market opportunity. Currently, it is showing signs of a bullish continuation from a key demand zone.
💎 Taking a glance back at #MultiversX, it's been consistently navigating a descending channel, breaking above, and then climbing upwards. Right now, the market sentiment is leaning towards selling, but here’s the twist - CRYPTOCAP:EGLD seems primed for a bullish leap from the demand zone at $53.81, potentially soaring towards the major supply zone at $102.20. It’s like gearing up for a market jump!
💎 But, as any seasoned #EGLD trader knows, crypto markets are like a game of chess. If EGLD doesn’t ride the bullish tide and instead takes a dip, it's time to consider our Plan B - rallying from a lower support level at $46.81.
💎 And a crucial point to remember: if #EGLD breaks below this support level, it's a signal to gather around the strategy table. Such a move would mean it’s time to recalibrate our strategies, adapting to the evolving market landscape. 🌴💰

EGLD: parabolic curve in 4hTo complement my previous idea, we can see the possible parabolic curve that EGLD would be forming.
Again, be ready for surprises, the last point of supply (LPS) can happen violently, I would not leverage.

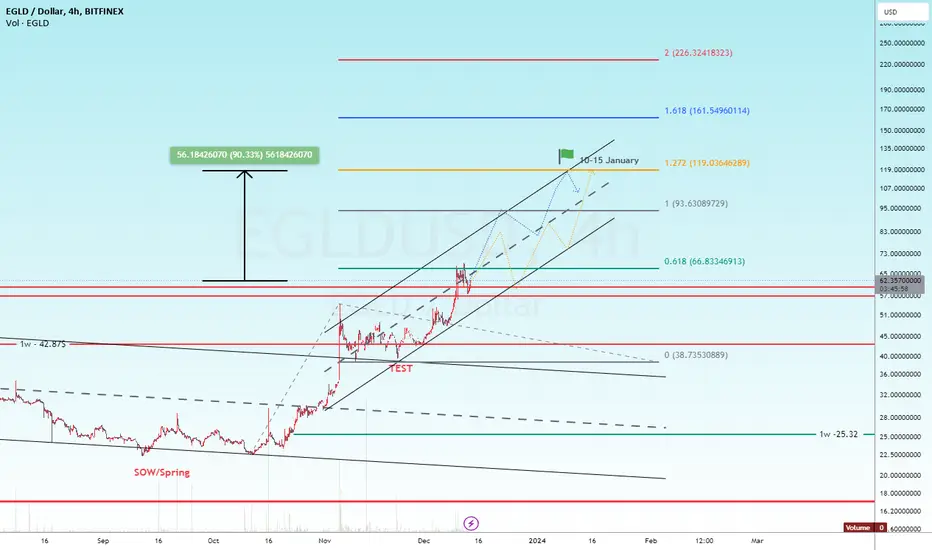
Christmas rally?: 90% up EGLD could very well be doing a parabolic curve in the 4h range. This is another way of seeing it, within an ascending channel, with the corresponding FIB extensions drawed from the lows of October.
This could be a FOMO, or could be not. We could also have some bumps in the way, but Santa is around the corner, I can feel it!
Target: 119$ (+90%)
EGLD A short would be nice from hereOn this pair Egldusdt i expect volatility coming soon.
Marking the trigger points and looking for shorts from here.(Scalp)
Targeting 41-42 area initially (might go way lower if we analyze in HTF).
Trade Type: Risky
Note: Not a financial Advice.

EGLDUSDT LONGTHIS IS NOT A FINANCIAL ADVICE
Conditions:
1.Fibonacci level:✅
2.Bollinger band:✅
3.Momentum:✅
4.Price action:✅
5.Volume:✅
6.1h tf:✅
7.4h tf:✅
8.1d tf:✅
EGLDUSDT Descending Channel!EGLDUSDT Technical Analysis Update
Buy zone : Below $47.30
Stop loss : $39.00
Take Profit 1 : $53.00
Take Profit 2 : $67.00
take Profit 3 : $88.00
Regards
hexa