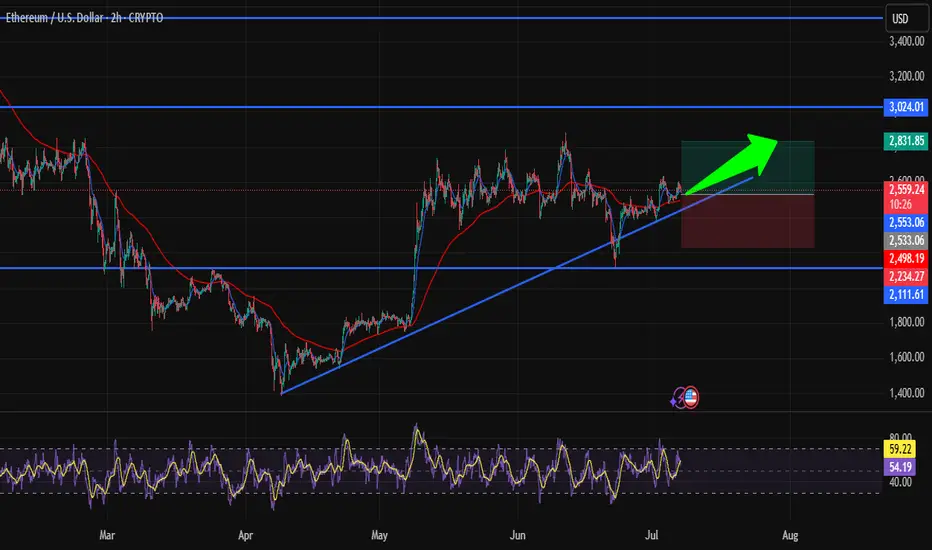
Is ETH Heading to $2800? Strategic Entry in Bullish TrendHi traders! , Analyzing ETH/USD on the 2H timeframe, price is respecting an ascending trendline and showing signs of continuation within the bullish structure:
🔹 Entry: 2555
🔹 Take Profit : 2831
🔹 Stop Loss : 2234
After consolidating above key support and retesting the ascending trendline, ETH is showing potential for a bullish continuation. The recent bounce is forming higher lows, and price remains above the 50 EMA, suggesting buyers are maintaining control.
RSI is currently turning upward from the mid-zone, signaling growing bullish momentum while still avoiding overbought conditions. The trendline has been respected several times, adding confluence to the setup.
If momentum holds, the TP around 2831 lines up with a significant resistance area from previous structure — a logical zone for price to reach in the short term.
⚠️ DISCLAIMER: This is not financial advice. Every trader is responsible for managing their own risk and strategy.
Ehtereum
Ethereum’s 19-Day ETF Inflow Streak: What Really HappenedEthereum’s 19-Day ETF Inflow Streak: What Really Happened to Price, Structure, and Sentiment
Table of Contents
1. Executive Summary
2. ETF Backdrop: How the 19-Day Inflow Wave Took Shape
3. Chronology of Price: Day-by-Day Performance
4. Weekly Chart Anatomy: The “Pre-Tower Top” Signal Explained
5. Intraday Technicals: From $2,450 Low to the $2,620 Hurdle
6. On-Chain & Derivatives Lens: Funding, OI, CEX Balances
7. Fundamental Undercurrents: Dencun Afterglow, L2 Fees, Staking Yields
8. Risks & Catalysts: ETH vs. Macro, vs. BTC Dominance, vs. SEC Noise
9. Playbooks for Traders and Long-Term Allocators
10. Conclusion: A Pause, Not a Peak—If Key Levels Hold
________________________________________
1. Executive Summary
• Ethereum received 19 consecutive days of net inflows into spot-linked exchange-traded products (ETPs) totaling $1.37 billion, the longest positive streak since the 2021 bull-run.
• Over the same period ETH/USD rose 18.4 %, printing a local high at $2,750, but has since pulled back to $2,575 amid broad crypto risk-off and Middle-East tensions.
• The latest weekly candle morphs into a “pre-tower top” pattern—two tall green candles followed by a small-bodied doji—often a harbinger of heavy distribution if confirmed by another red week.
• Short-term structure improved Monday: price pierced a contracting-triangle ceiling at $2,550, reclaimed the 100-hour SMA, and now eyes $2,620 as the gatekeeper to renewed upside.
• Funding rates flipped neutral, exchange reserves hit a 7-year low, and staking deposits outpace withdrawals 1.7 : 1—on-chain signs that the sell-off is more leverage shakeout than top formation.
________________________________________
2. ETF Backdrop: How the 19-Day Inflow Wave Took Shape
2.1. The Players
Unlike Bitcoin’s mammoth U.S. spot ETFs, Ethereum’s inflow streak drew from Europe and Canada, where physically backed ETPs have traded since 2021. The three biggest contributors:
Product Country 19-Day Net Flow AUM Growth
21Shares Ethereum ETP (AETH) Switzerland +$502 m +38 %
CI Galaxy Ethereum ETF (ETHX) Canada +$458 m +29 %
WisdomTree Physical Ethereum EU +$227 m +24 %
Rumors of an SEC approval window “after the U.S. election” sparked pre-positioning; asset managers figured it was cheaper to accumulate now than chase later once liquidity explodes on Wall Street.
2.2. Flow Mechanics
When an ETP issues new shares, it must buy spot ETH or tap an AP that can supply coins—direct demand unmatched by equivalent selling pressure. Over the 19-day window, the net 396 k ETH of creation equaled 57 % of all new issuance from block rewards post-Dencun, creating a measurable supply squeeze.
2.3. Historical Context
The only longer stretch was January–February 2021 (27 days), which culminated in ETH exploding from $1,400 to $2,000. The key difference today: market cap is six times larger, so identical inflows exert a milder percentage impact, explaining why price “only” added ~18 %.
________________________________________
3. Chronology of Price: Day-by-Day Performance
Day Date ETF Net Flow Price Close % Δ vs. Prior Day
1 Mar 18 +$58 m $2,110 —
5 Mar 22 +$73 m $2,265 +7.3 %
10 Mar 27 +$94 m $2,430 +2.4 %
15 Apr 1 +$125 m $2,690 +3.8 %
19 Apr 5 +$81 m $2,750 +0.9 %
Across the stretch, realized volatility rose from 32 % to 46 %, but skew stayed positive, showing call demand outpaced puts until the very end, when geopolitical headlines flipped sentiment.
________________________________________
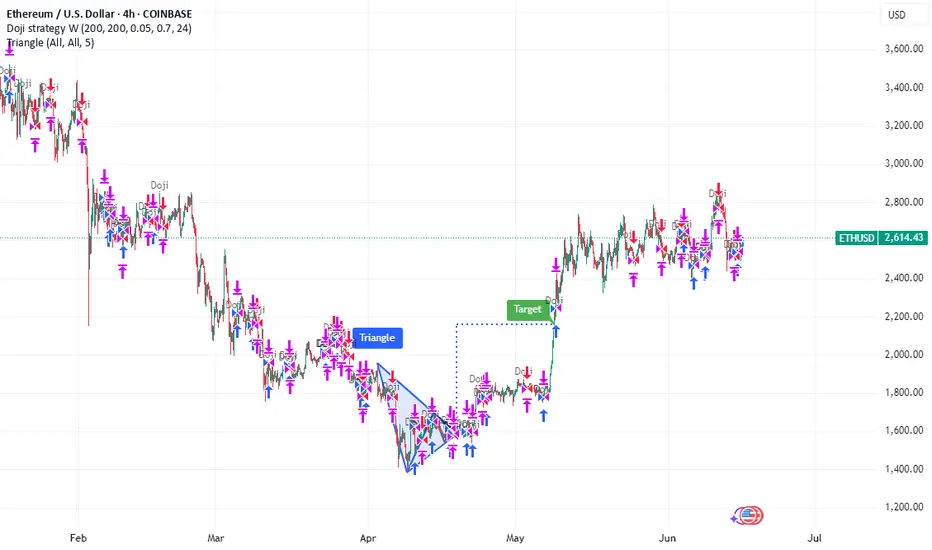
4. Weekly Chart Anatomy: The “Pre-Tower Top” Signal Explained
4.1. What Is a Tower Top?
In candlestick lore, a tower top comprises:
1. A tall green candle (strong breakout)
2. Another tall green candle (exhaustion)
3. A narrow doji or spinning top (equilibrium)
4. A large red candle (breakdown confirmation)
We currently have the first three pieces: the last two weeks of March delivered back-to-back 10 % advances; the first week of April closed as a +0.6 % doji. The pattern is not confirmed until a decisive red week engulfs the doji body (< $2,540).
4.2. Indicators
• RSI (weekly): 59 → ticking down from 68 high; still shy of overbought.
• MACD histogram: Positive but flattening.
• Bollinger bands: Price mid-point of upper band, room for one more expansion.
Conclusion: the candle warns of fatigue, but momentum hasn’t rolled over—yet.
________________________________________
5. Intraday Technicals: From $2,450 Low to the $2,620 Hurdle
5.1. Hourly Chart (Kraken Feed)
• Triangle Breakout: Price sliced through descending trend-line at $2,550, tagging $2,590.
• Moving Averages: ETH trades marginally above the 100-hour SMA ($2,575) but below the 200-hour ($2,610).
• Fibonacci Zones: $2,620 aligns with 0.5 retrace of the $2,750→$2,450 fall—classic reversal pivot.
A clean hourly close >$2,620 opens the door to $2,680 (0.618 Fib) and psychological $2,700. Failure rejects to $2,520 support cluster.
5.2. Order-Book Heat Map
Coinbase Pro data shows 1,300 ETH ask wall at $2,620 and a thinner 890 ETH bid at $2,520. Liquidity skew favors dip-buying, but bulls need market orders >1 k ETH to smash the ask block.
________________________________________
6. On-Chain & Derivatives Lens
6.1. Exchange Reserves
Centralized exchanges now hold 12.9 million ETH, lowest since July 2017. The 19-day ETF harvest accelerated an already extant down-trend of roughly 60 k ETH/week outflows, mostly into staking contracts and L2 bridges.
6.2. Staking Flows
• Beacon deposit contract: +188 k in April’s first week.
• Withdrawal queue: 11 k ETH—tiny relative to deposits.
• Effective deposit APR after Dencun: 3.2 %, still beating U.S. 2-year T-notes post-tax for many investors.
6.3. Perpetual Funding & OI
• Funding normalized to 0.007 %/8 h (≈ 3.2 % APR), down from 9 % at March highs—spec longs flushed.
• Open Interest shed $420 m in the two-day dip—liquidations, not fresh shorts, drove the wash-out.
6.4. Options Skew
• 25-delta risk reversal (1-month): flipped to –4 % (puts pricier than calls) for first time since January—hedging demand but nowhere near panic-level (–12 % in 2022 bear).
________________________________________
7. Fundamental Undercurrents
7.1. Dencun Afterglow & L2 Fees
Proto-danksharding (EIP-4844) slashed L2 data costs by 85 %, pushing average Arbitrum and Optimism transaction fees under $0.02. Cheaper blockspace fuels on-chain activity:
Metric Pre-Dencun Post-Dencun Δ
Daily L2 Txns 2.4 m 4.1 m +71 %
Bridged ETH to L2s 6.8 m 7.9 m +16 %
More usage → more gas burned → structural tailwind to ETH as a fee-burn asset.
7.2. DeFi TVL
Total value locked rebounded to $61 billion, led by EigenLayer and restaking hype. ETH comprises 68 % of TVL collateral—every lending loop pins additional demand.
7.3. Competing Narratives
• Solana season siphoned retail mind-share; SOL/ETH ratio popped 42 % YTD.
• Bitcoin L2s (Stacks, Rootstock) attempt to mirror Ethereum’s smart-contract moat, but dev tooling remains nascent.
•
Net: Ethereum retains developer supremacy (70 % of new GitHub commits among smart-contract chains) and therefore garners institutional comfort.
________________________________________
8. Risks & Catalysts
Factor Bearish Angle Bullish Rebuttal
Macro Sticky U.S. CPI halts Fed cuts → higher real yields weigh on non-yielders ETH staking yield + MEV is real cash-flow; Dencun lowers L2 costs → adoption offset
SEC Spot ETF Delay past Jan 2026 or outright denial kills U.S. inflow dream 19-day streak proves ex-U.S. capital is hungry; approval >0 is all it takes for supply shock
BTC Dominance Halving FOMO may keep Bitcoin’s share >55 %, starve ETH rotation Historical pattern: ETH rips 6-10 weeks post-halving as beta plays catch-up
Tower-Top Pattern Weekly confirmation could spark drop to $2,200 support Pattern fails if bulls recapture $2,750 quickly, turning doji into bullish flag
________________________________________
9. Playbooks for Traders and Long-Term Allocators
9.1. Short-Term Momentum (0–7 days)
• Bias: Range-trade $2,520–$2,620 until breakout.
• Instruments: ETH-perp on Bybit/Deribit, 3× leveraged tokens for reduced funding bleed.
• Trigger: 15-minute candle above $2,620 with ≥ $50 m aggregated CVD buys.
• Stop: $2,560 (triangle retest).
• Target: $2,680 then $2,700.
9.2. Swing (1–8 weeks)
• Bias: Accumulate dips as long as weekly stays >$2,350 (0.382 Fib of Oct→Mar leg).
• Tools: 1-month $2,500-$2,800 call spreads; spot with 25 % collar protection.
• Catalysts: SEC commentary May 23, FOMC June 18.
9.3. Position (6–18 months)
• Bias: Dollar-cost average into staking nodes; carry 4 % ETH on portfolio NAV.
• Thesis: EIP-4844 usage boom + probable U.S. ETF = $4–5 k fair value by 2026.
• Risk Control: Hedge 25 % notional via BTC-perp short if BTC.D >58 %.
________________________________________
10. Conclusion: A Pause, Not a Peak—If Key Levels Hold
The 19-day ETF inflow streak proves that institutional demand for Ethereum exists even without a U.S. spot vehicle. Price responded vigorously but not parabolically, reflecting the asset’s growing market-cap gravity. The nascent “pre-tower-top” weekly candle warns of exhaustion; confirmation, however, requires another bearish week that cracks $2,540 support.
Short-term order-flow shows willing dip buyers, staking metrics scream supply sink, and the macro backdrop—while shaky—fails to dent ETH’s relative value proposition versus fiat yields. Translation: Ethereum is vulnerable to headline-driven squalls but structurally sound.
If bulls recapture $2,620, the path to retest $2,750 and ultimately $3,000 reopens. Lose $2,450 and the tower top will complete, sending ETH toward $2,200 where ETF inflow buyers likely reload. For now, the balance of evidence favors consolidation with an upward skew—tower construction, perhaps, but no wrecking ball yet.
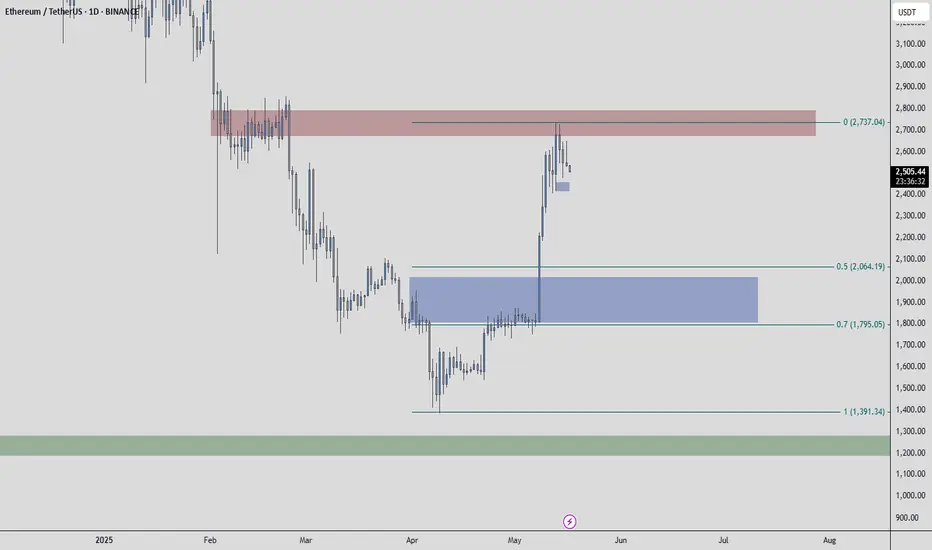
ETH/USDT – First Support in the Blue BoxETH has been slowing down after its latest push, and the first real area to watch is that blue box below price. It’s where buyers will likely step back in, and a clean reaction there could spark a bigger move—especially if ETH/BTC starts to turn higher at the same time.
What you need before pulling the trigger
• A volume surge that outstrips the prior pullback and aligns with a bullish CDV divergence
• A quick break under the blue box on your one- or five-minute chart followed by a fast reclaim, showing order flow flipped to the buy side
• Genuine buying pressure, not just a wick into the zone
“If the levels suddenly break upwards and do not give a downward break in the low time frame, I will not evaluate it. If they break upwards with volume and give a retest, I will look long.”
Jumping in without those confirmations is the easiest way to get shaken out. But if ETH dips into that box, lights up on volume and CDV, and then retests cleanly on the low timeframe, that’s your signal. With ETH/BTC potentially gearing up to rise too, a solid bounce here could turn into something you don’t want to miss.
📌I keep my charts clean and simple because I believe clarity leads to better decisions.
📌My approach is built on years of experience and a solid track record. I don’t claim to know it all but I’m confident in my ability to spot high-probability setups.
📌If you would like to learn how to use the heatmap, cumulative volume delta and volume footprint techniques that I use below to determine very accurate demand regions, you can send me a private message. I help anyone who wants it completely free of charge.
🔑I have a long list of my proven technique below:
🎯 ZENUSDT.P: Patience & Profitability | %230 Reaction from the Sniper Entry
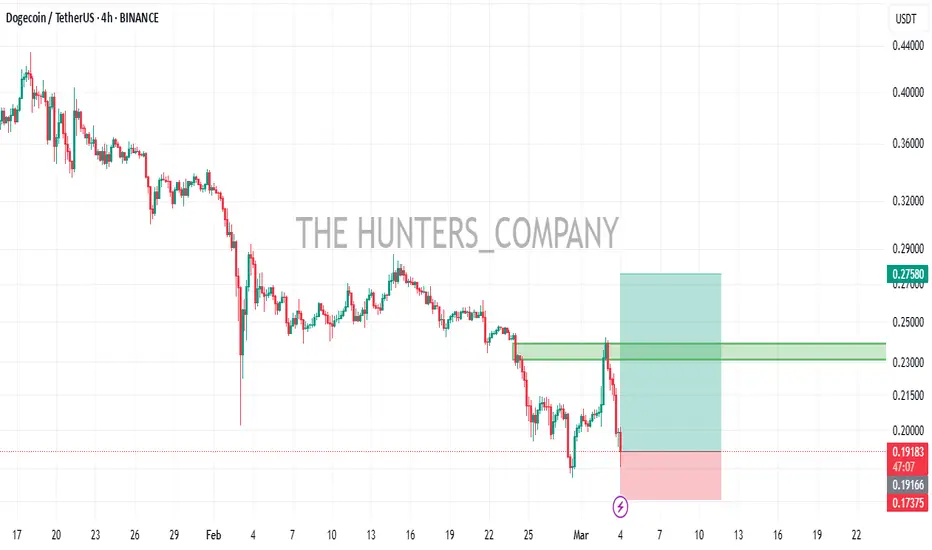
🐶 DOGEUSDT.P: Next Move
🎨 RENDERUSDT.P: Opportunity of the Month
💎 ETHUSDT.P: Where to Retrace
🟢 BNBUSDT.P: Potential Surge
📊 BTC Dominance: Reaction Zone
🌊 WAVESUSDT.P: Demand Zone Potential
🟣 UNIUSDT.P: Long-Term Trade
🔵 XRPUSDT.P: Entry Zones
🔗 LINKUSDT.P: Follow The River
📈 BTCUSDT.P: Two Key Demand Zones
🟩 POLUSDT: Bullish Momentum
🌟 PENDLEUSDT.P: Where Opportunity Meets Precision
🔥 BTCUSDT.P: Liquidation of Highly Leveraged Longs
🌊 SOLUSDT.P: SOL's Dip - Your Opportunity
🐸 1000PEPEUSDT.P: Prime Bounce Zone Unlocked
🚀 ETHUSDT.P: Set to Explode - Don't Miss This Game Changer
🤖 IQUSDT: Smart Plan
⚡️ PONDUSDT: A Trade Not Taken Is Better Than a Losing One
💼 STMXUSDT: 2 Buying Areas
🐢 TURBOUSDT: Buy Zones and Buyer Presence
🌍 ICPUSDT.P: Massive Upside Potential | Check the Trade Update For Seeing Results
🟠 IDEXUSDT: Spot Buy Area | %26 Profit if You Trade with MSB
📌 USUALUSDT: Buyers Are Active + %70 Profit in Total
🌟 FORTHUSDT: Sniper Entry +%26 Reaction
🐳 QKCUSDT: Sniper Entry +%57 Reaction
📊 BTC.D: Retest of Key Area Highly Likely
📊 XNOUSDT %80 Reaction with a Simple Blue Box!
📊 BELUSDT Amazing %120 Reaction!
📊 Simple Red Box, Extraordinary Results
I stopped adding to the list because it's kinda tiring to add 5-10 charts in every move but you can check my profile and see that it goes on..
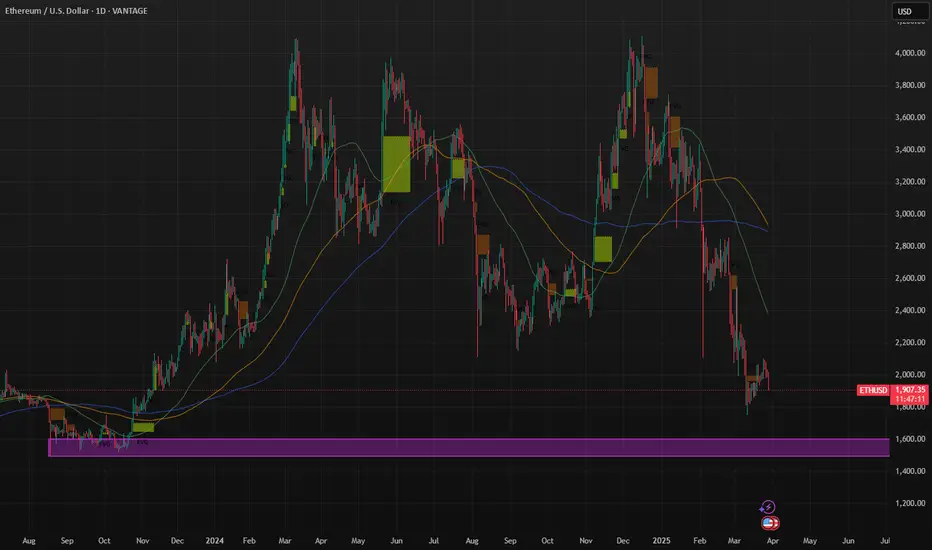
ETH PoV - 1.600$? Ethereum is going through a phase of challenges and opportunities, with its current price approaching the target i've set for a potential purchase of $1600. In recent months, Ethereum has faced a significant price correction, with Ether's value dropping by about 40%, largely due to the growing competition from other blockchains like Solana and Cardano, which are gaining popularity due to their speed and low transaction costs. Additionally, the rise of memecoins and recent developments in the cryptocurrency regulatory landscape have shifted attention away from Ethereum, while other cryptocurrencies, such as Bitcoin, seem to enjoy greater favor among investors. Internally, Ethereum is still facing delays and challenges related to technical updates, as well as some tensions within the developer community, which has made it harder to maintain market leadership. The decision not to acquire Ether for a U.S. cryptocurrency reserve by the Trump administration has also disappointed many investors, fueling outflows from ETFs invested in Ethereum. Despite these difficulties, long-term prospects for Ethereum remain positive. In fact, some analysts suggest that if demand and supply stabilize, and if Ethereum can overcome internal challenges and effectively respond to competition, it could reach new all-time highs, with a target potentially surpassing $5000 in the next 12 months. This scenario is supported by the continued interest in ETFs that invest in Ether, the expansion of its network, and improvements in regulations, which could further incentivize institutional and retail adoption. Ultimately, while there are risks to consider, investing in Ethereum could be highly rewarding in the long term, with the possibility that the cryptocurrency could recover ground and set new value records in the next 12 months. Achieving a $5000 target, however, will depend on Ethereum's ability to innovate, address internal issues, and navigate the evolving regulatory landscape, but if it can maintain its central role in the cryptocurrency ecosystem, it may continue to grow significantly.
DOGE BUYhello friends
According to the pullback we had, we can enter into the transaction with risk and capital management.
*Trade safely with us*
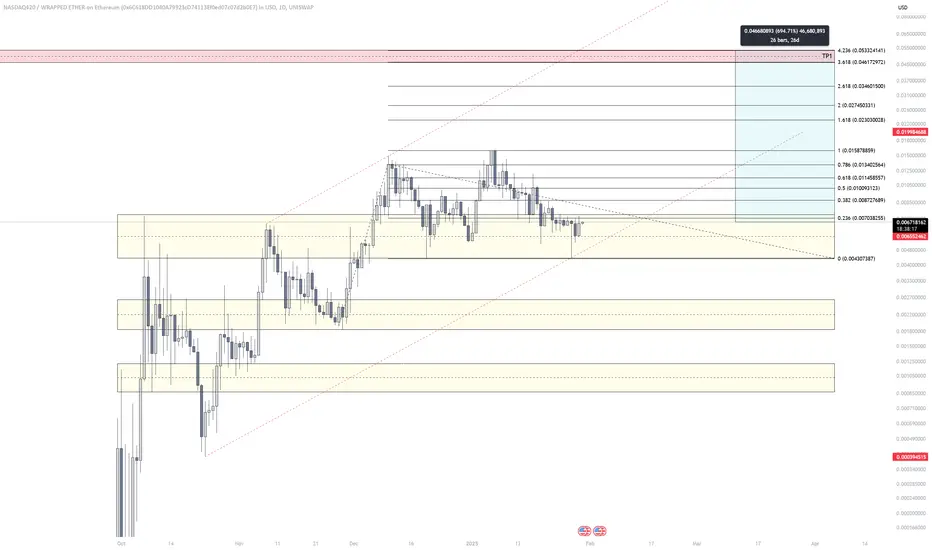
Nasdaq420 Meme ProjectI told myself I would never post a meme coin technical analysis on here, but I am doing it. Since the Trump meme coin project, many meme projects have completely died. Here is a derivatives play spin-off from SPX6900, currently at 1B+ market cap. This project has gone through a lot and is still holding up stronger than most projects out there. I think ETH is going to surprise this market and come in fashionable late reviving projects built on the network.
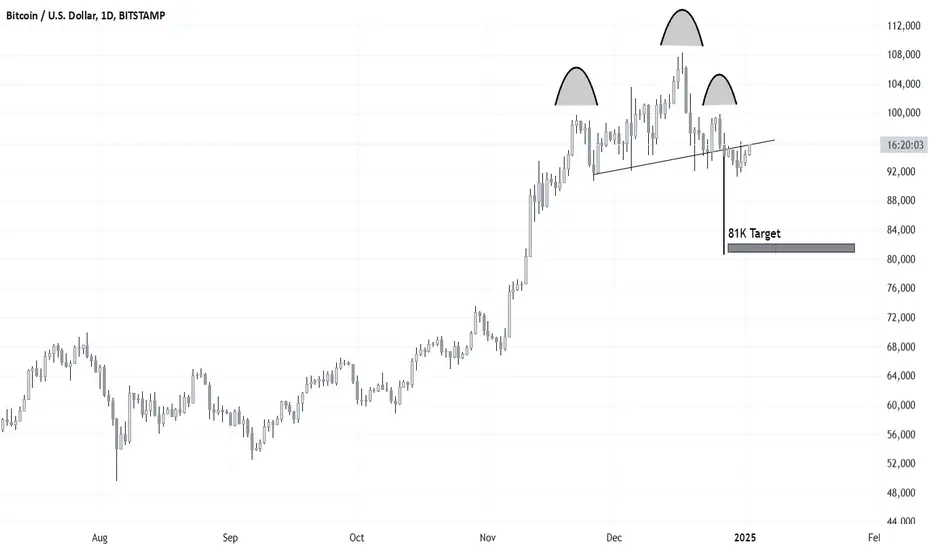
Ethereum Bear flag after confirming double top
Ethereum Bear flag after confirming double top, all signs point down not up.

Bitcoin and Ethereum Trap
I regret to inform you, Crypto enthusiasts, that the upward has already occurred. This is merely a false signal. Image of Ethereum and Bitcoin.
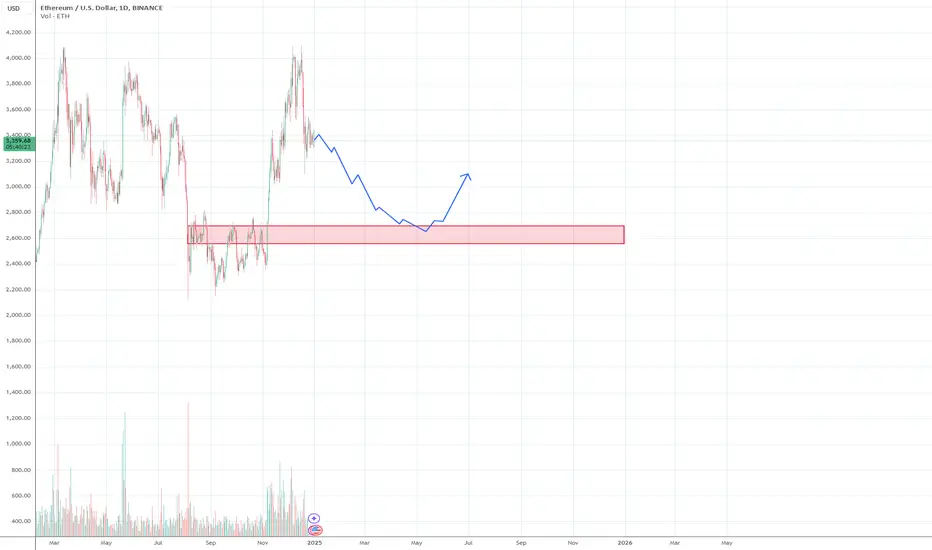
I think Ethereum will see $2,700 again.Should see price retest the marked area (around $2700) probably.
Stop loss $3550
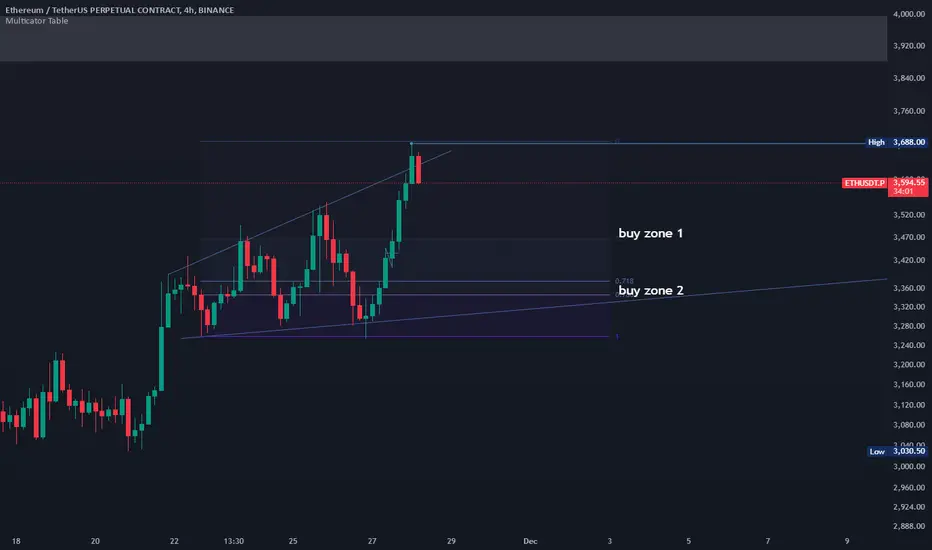
Bullish ETHon other side . ETH is very bullish yesterday. today we can see some profit booking and can grab at Buy zone 1 and buy zone 2 ( with valid conformation ).
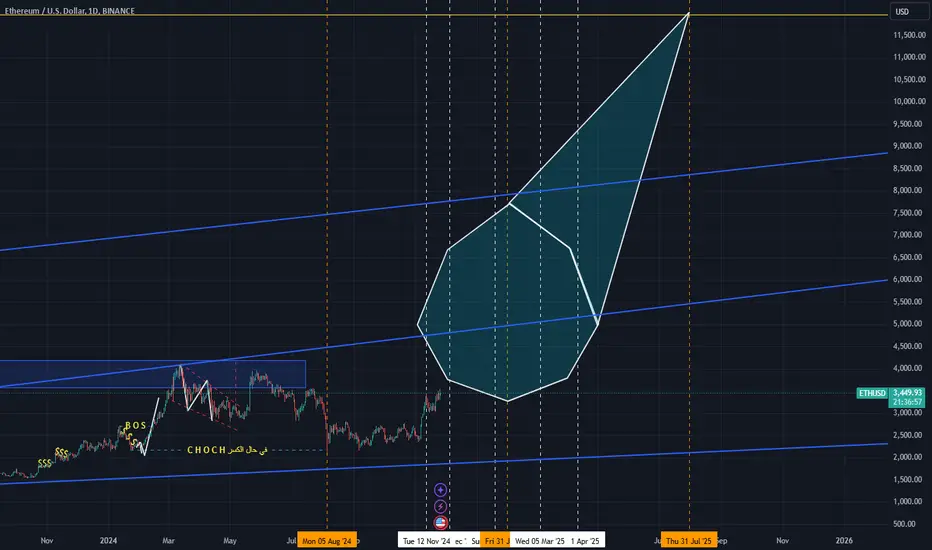
ETH Final destination Right it's insane Goal but it is what it is, the goal is 11k in next 7 month would it be hit?
who knows but someone has to take the risk. and make a move
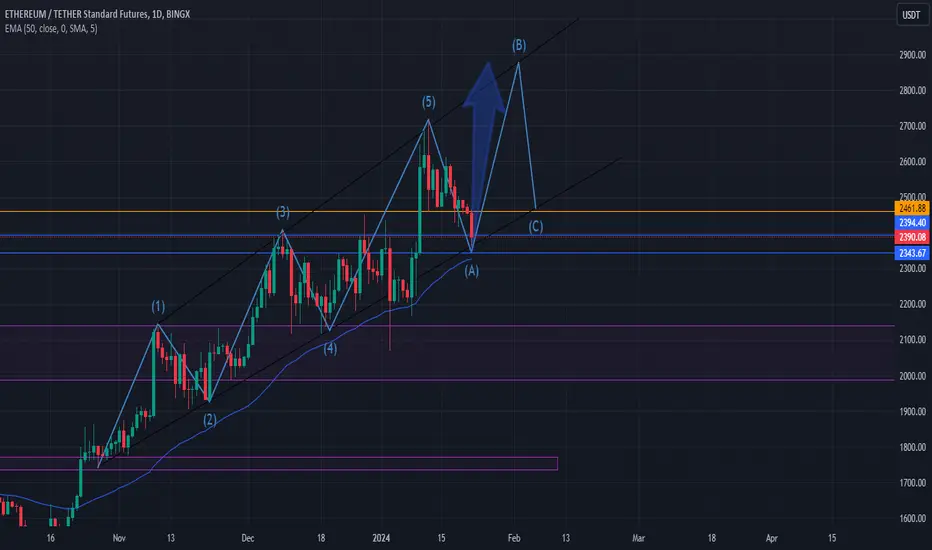
Ethereum on high time frame Hi traders , it's about Ethereum in high timeframe . Here’s a summary of my two scenarios:
### Scenario 1: Bullish Breakout
- **Condition**: If the price reaches $2,900 and pushes strongly through this level.
- **Outcome**: This would indicate a strong bullish trend, potentially leading to new higher highs.
### Scenario 2: Bearish Rejection
- **Condition**: If the price reaches $2,900 but only sweeps liquidity and then closes below this zone on the high timeframe.
- **Outcome**: This could open up opportunities for short positions, signaling a bearish trend.
### Considerations:
- **Confirmation**: Look for confirmation signals such as candlestick patterns, volume spikes, or other technical indicators to validate your scenarios.
- **Risk Management**: Set appropriate stop-loss levels based on your analysis to manage risk effectively.
- **Market Context**: Stay updated on any relevant news or market trends that might impact Ethereum's price action.
This approach will help you make informed trading decisions based on your outlined scenarios. If you have further insights or need more analysis, feel free to ask!

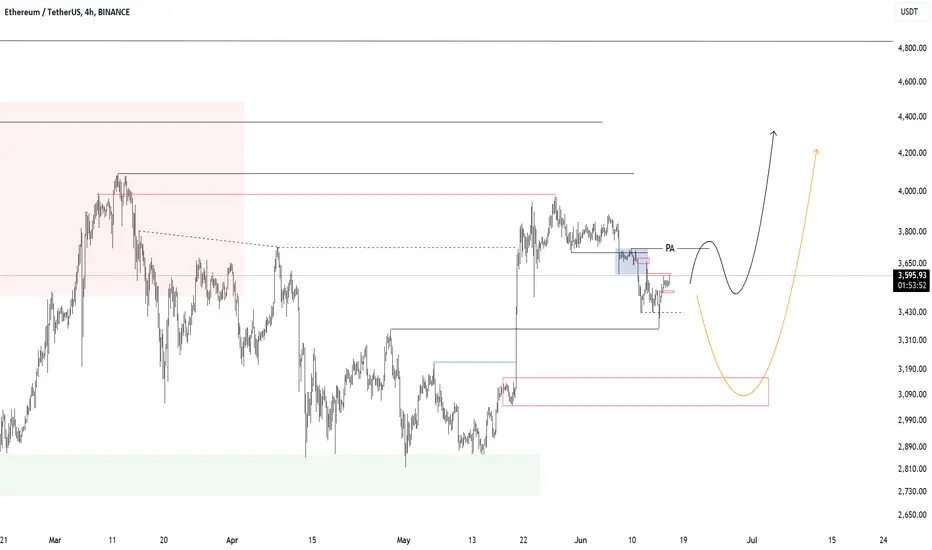
ETHEREUM road to new ATH!Here we have an analysis for Ethereum in 1H time frame. we can consider two scenarios.
Bullish Scenario:
If ETH breaks above the immediate resistance (PA) around $3,700, it could rally towards higher resistance levels at $3,900, $4,000, and potentially up to $4,400.
This is depicted by the black projected path, suggesting a continued uptrend.
Bearish Scenario:
If ETH fails to break the $3,700 resistance and moves below the immediate support of $3,520, it could see further declines.
The orange projected path indicates a potential drop towards $3,360, $3,280, and a significant support level around $3,125.
This scenario suggests a possible deeper correction before any potential recovery.
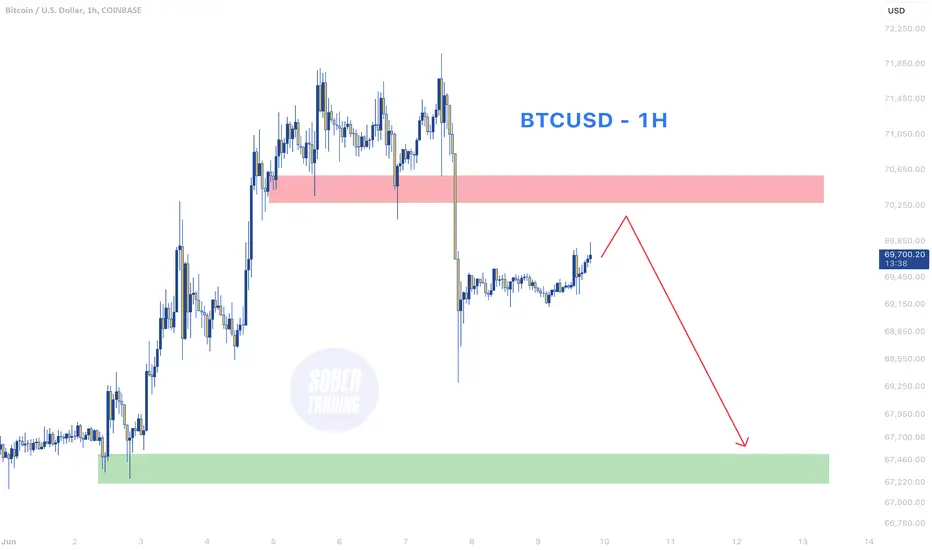
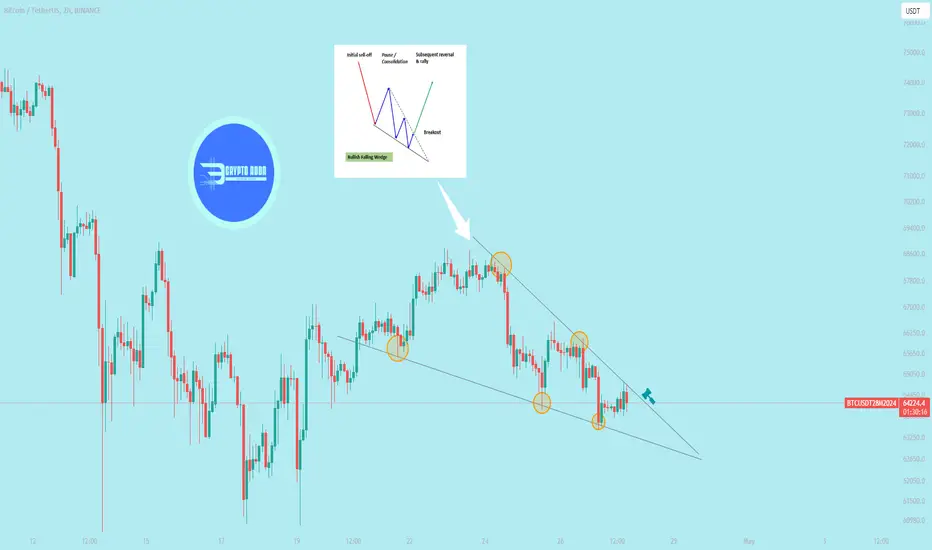
BTCUSD - 1H another fallOn the BTC/USD 1-hour chart, Bitcoin faces resistance around $70,200 and may pull back to hunt stops below the recent low of $68,300. This suggests a potential short-term decline before any further upward movement.
$BTC performed Falling wedge in 2hr TF ** CRYPTOCAP:BTC performed Falling wedge in 2hr TF ** Keep eye on it
Trading a falling wedge breakout involves identifying a chart pattern called a falling wedge and executing trades when the price breaks out of this pattern. Here are the steps you can follow:
1. **Identify the Falling Wedge:**
- Look for a downtrend in the price movement.
- Identify converging trendlines where the upper trendline (resistance) slopes down at a steeper angle than the lower trendline (support).
- The pattern resembles a wedge pointing downwards.
2. **Confirm the Falling Wedge:**
- Confirm the pattern using other technical indicators like volume. Ideally, during the formation of a falling wedge, the trading volume should decrease.
3. **Wait for Breakout:**
- Patiently wait for a breakout to occur. Breakout refers to the point where the price moves above the upper trendline of the falling wedge.
- The breakout should ideally be accompanied by a noticeable increase in trading volume, confirming the strength of the breakout.
4. **Entry Point:**
- Enter a long (buy) position as soon as the price breaks above the upper trendline.
- Some traders prefer to wait for a confirmed close above the upper trendline to reduce the risk of false breakouts.
5. **Stop-Loss Placement:**
- Set a stop-loss order below the lower trendline or a recent swing low. This helps limit potential losses in case the breakout fails and the price moves back into the wedge.
Remember that trading always involves risks, and it's crucial to have a well-thought-out strategy, risk management plan, and the discipline to stick to your plan.
ETH BULLS NEW TARGET $4,300Everyone is building something and they build they will always come resistance.. and value is smiling and knowing resistance is just another way to grow..
ETH reach a resistance and fell sharply, price yesterday filled up the losses and ready to break higher.
The benchmark is seeking to bring to life that which has not yet exist..
Today I will be adding more positions to my existing position on ETH
PA will be flying from $3800 entry point..
1,500 pips in play here, lets watch PA travel to our target area..
Hey, instead of watching, join me on this train.. could be the best trade of your life.
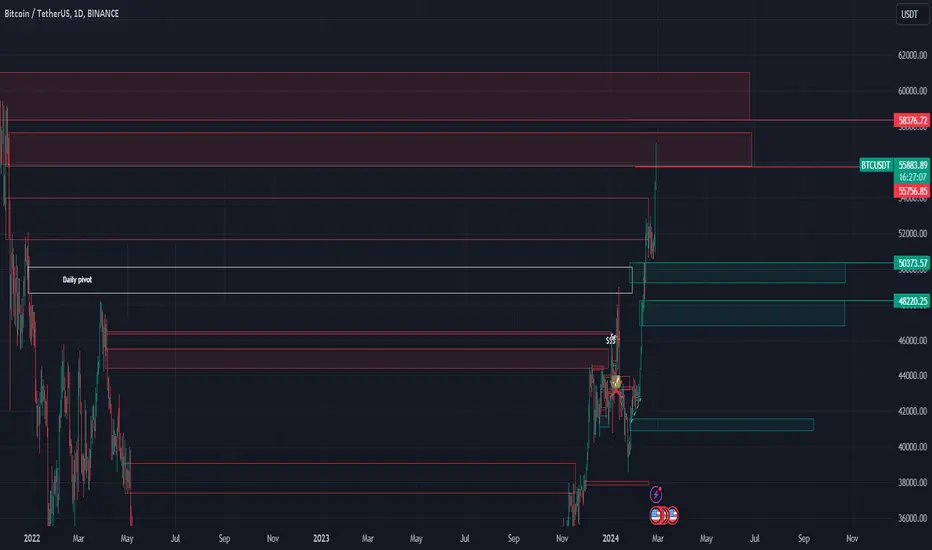
Correction in Bitcoin and a new buying opportunity.Bitcoin reaching the supply zones of 55750 and 58300 could trigger a correction and create a new buying opportunity for Bitcoin. Currently, the demand zones of 50400 and 48300 are of interest to me, which could be suitable for a purchase. It seems that the price, after hitting these two supply zones, may experience significant growth.
Wait for the return of Ethereum!Ethereum after its downtrend. You will see the pullback of Ethereum as shown in the picture. It will be revised up to the range of 2394. EMA50 is also approaching. And then it will return to its resistance of 2700.
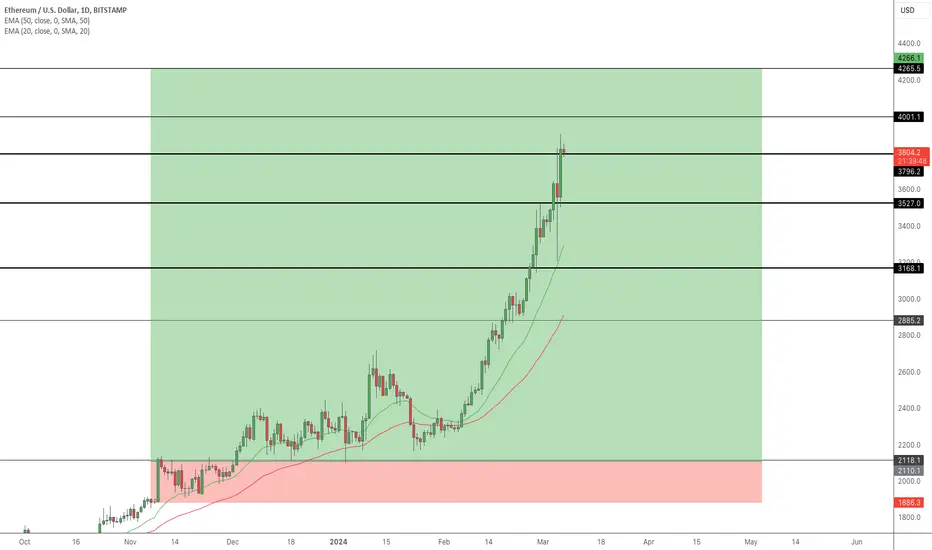
EHTUSDT (Ethereum) ABC Pattern and 70% Potential for Upside🔅The Triple Bottom Formation at $1533 📈
In the world of cryptocurrency, precision matters. Ethereum (ETH), one of the market leaders, recently exhibited a fascinating triple bottom pattern, signaling that buyers defended the $1533 support level - an interesting entry point. This level coincides with the 78.6% Fibonacci support, adding significance to its resilience.
🔅The Long-Term Resistance Breakout
ETH isn't stopping there. It previously shattered a long-term resistance, demonstrating the strength of the bulls. A significant factor in favor of an uptrend, this development marks the beginning of Ethereum's journey towards higher price levels.
🔅ABC Pattern Potential
Furthermore, Ethereum seems to be forming an ABC pattern, often associated with a trend reversal. This pattern adds another layer of evidence to our bullish thesis. As the potential C wave unfolds, it could propel Ethereum further upwards.
🔅Demand Zone
Observe the recent transformation of a supply zone into a demand zone. This area has been a pivot for price action throughout the week, affirming the growing interest from buyers. These zones act as battlegrounds, and Ethereum seems to have gained a strong foothold in the demand zone.
🔅Anticipating a 70% Rally 🚀
Considering the solid foundation provided by the triple bottom, the long-term resistance breakout, the potential ABC pattern, and the resilient demand zone, Ethereum is poised for growth. We anticipate a substantial 70% price increase, setting sights on the 161.8% Fibonacci retracement level at $2620.

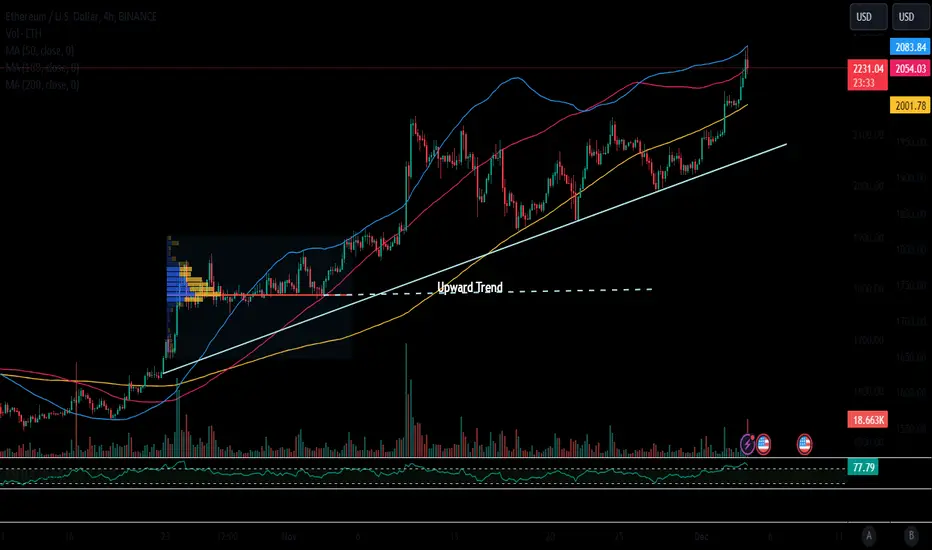
Ethereum (ETH) Slowly Rising
In comparison to BTC, the ETH price is rising more slowly, which suggests the potential for the asset to reach new annual highs. Since December 1, ETH has appreciated by 9%, currently trading near the price level of $2,265.
Buyers are likely to keep pushing the price up this week. Consequently, a rapid increase in growth could occur, potentially triggering a brief altcoin season. This scenario might unfold if Bitcoin's growth stalls and it enters a period of sideways trading.
A correction in Ethereum's chart, akin to Bitcoin, appears unlikely. Current buyer orders are situated within the support zones of $2,224-$2,240 and $2,182-$2,205. Ethereum's price could also reach $2,160. A significant correction may only start if the asset's price firmly drops below $2,000.
Analyzing ETH's Future: A Cautious Approach to Long Positions
While some voices in the market are calling for ETH to reach all-time highs, it is crucial to approach these predictions with a cautious mindset. As traders, we understand the importance of thoroughly analyzing various factors before making any investment decisions. Let's take a moment to consider the current situation and its potential implications.
ETH has undoubtedly been on an impressive upward trend, showcasing remarkable resilience and growth. However, as we approach new price levels, it becomes increasingly important to exercise caution. History has taught us that markets are rarely linear, and corrections are an inherent part of any asset's journey toward new heights.
In light of this, I encourage you to consider adopting a cautious long-term strategy when it comes to ETH. While it is true that the overall sentiment is positive, it is equally important to remain aware of potential bearish signals that may emerge. By taking a measured approach, we can mitigate risks and make well-informed decisions.
To assist you in your trading journey, I recommend keeping a close eye on key indicators such as trading volume, market sentiment, and price action. These factors can provide valuable insights into the market's sentiment and potential shifts in trends. Additionally, it is crucial to stay informed about any upcoming events or news that may impact ETH's performance.
As we navigate this dynamic market, it is essential to remember that successful trading requires discipline, patience, and a constant reassessment of our strategies. By approaching ETH with caution, we can better position ourselves to capitalize on potential opportunities while managing risks effectively.
In conclusion, while some predict ETH's ascent to new all-time highs, I urge you to adopt a cautious approach. Stay vigilant, analyze the market objectively, and be prepared for potential corrections along the way. By doing so, we can make informed decisions and navigate this exciting market with confidence.

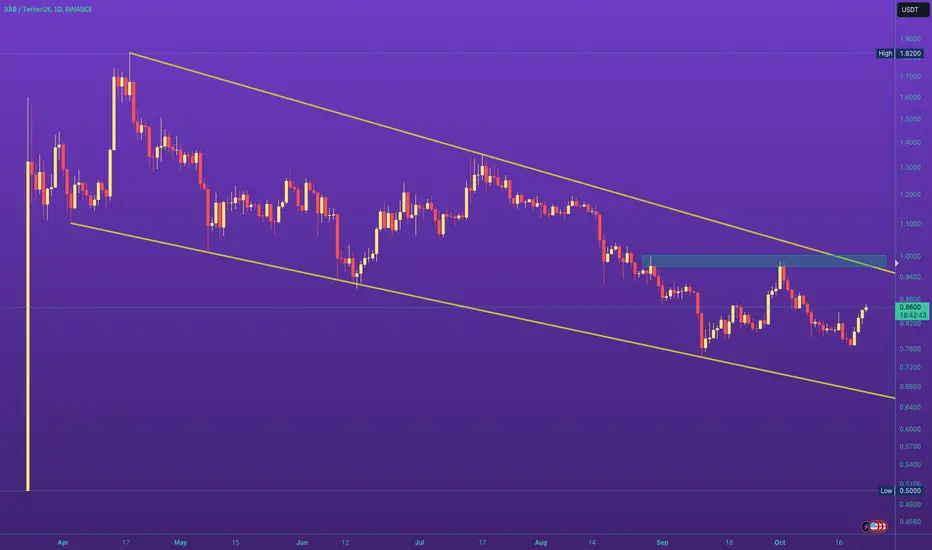
Is it the Bullish Flag?Daily Chart
I spot the Bullish Flag or Falling Wedge on ARB's chart
Now, it's trading at 0.859x and moving up to resistance around $1
If it can break and close above this resistance that is huge profit for next bull cycle.
Wait for next move
$PERP follow Badger The two currencies will find an analysis for them in the last week
And do not forget that most of the currencies that I publish are for speculation and cash collection in August.. As for investment, you will find me talking about stronger projects that will be launched after September
