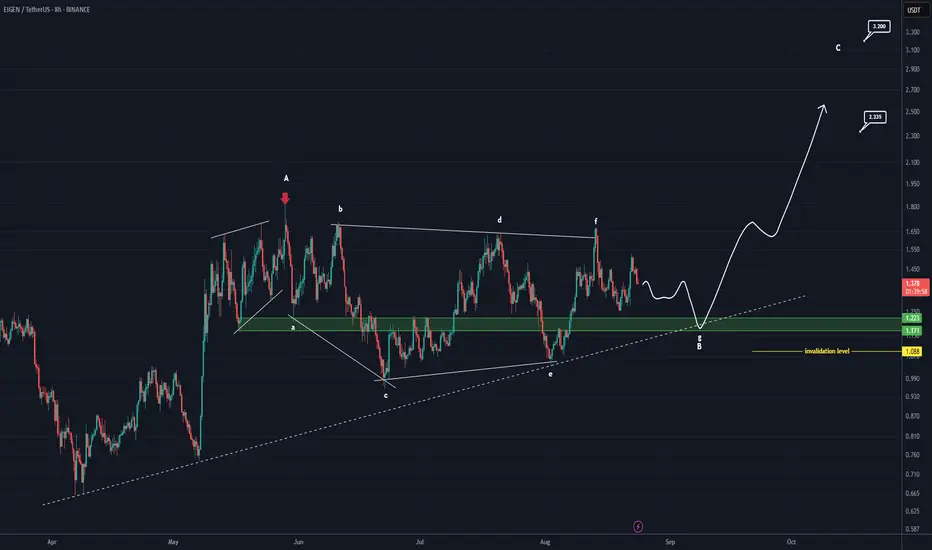
EIGEN Analysis (8H)The price seems to be in the corrective wave B, likely in the final corrective sub-wave of the larger wave B. From the green zone | which is a flip zone overlapping with the trendline | we expect a rejection to the upside, initiating wave C.
We are looking for buying opportunities around the green zone.
The targets are marked on the chart.
A daily candle closing below the invalidation level would nullify this analysis.
For risk management, please don't forget stop loss and capital management
When we reach the first target, save some profit and then change the stop to entry
Comment if you have any questions
Thank You
EIGENBTC
#EIGEN/USDT#EIGEN
The price is moving in a descending channel on the 1-hour frame and is adhering to it well and is heading to break it strongly upwards and retest it
We have a bounce from the lower limit of the descending channel, this support is at a price of 1.56
We have a downtrend on the RSI indicator that is about to break and retest, which supports the rise
We have a trend to stabilize above the moving average 100
Entry price 1.71
First target 1.83
Second target 1.90
Third target 1.98

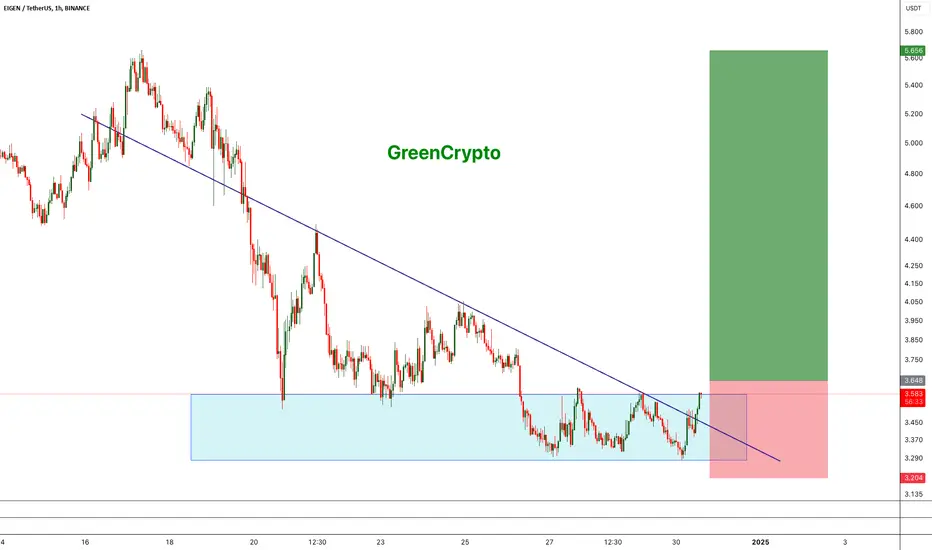
EIGEN - Box is brokenBINANCE:EIGENUSDT (1h CHART) Technical Analysis Update
EIGEN is currently trading at $3.578 and showing overall bullish sentiment sentiment
Price was trading inside the box for couple days and expecting to breakout from the box soon. There is a good potential for long trade here.
Entry level: Candle close above $3.68
Stop Loss Level: $ Below 3.204
TakeProfit 1: $3.875
TakeProfit 2: $ 4.180
TakeProfit 3: $ 4.592
TakeProfit 4: $ 5.035
TakeProfit 5: $ 5.612
Max Leverage: 5x
Position Size: 1% of capital
Remember to set your stop loss.
Follow our TradingView account for more technical analysis updates. | Like, share, and comment your thoughts.
Cheers
GreenCrypto
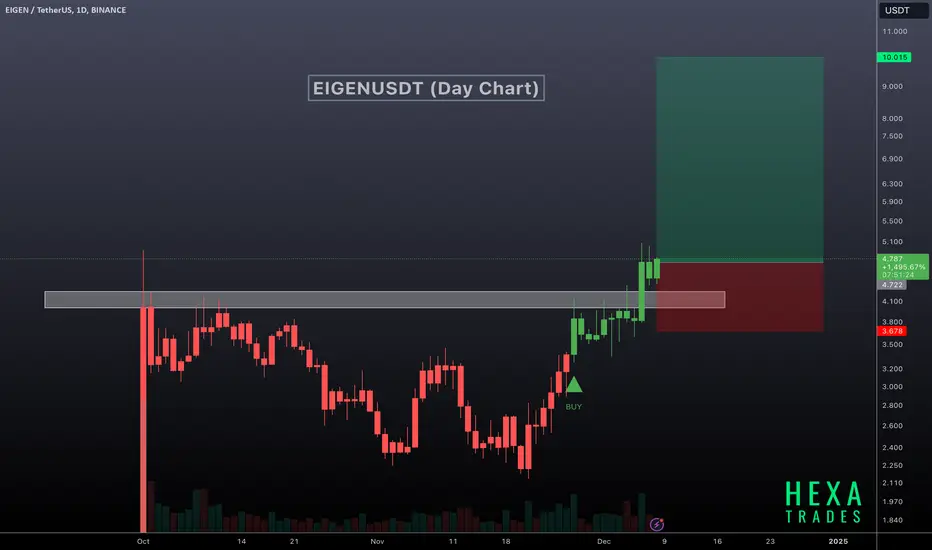
EIGENUSDT New ATH!EIGENUSDT Technical Analysis Update
EGENUSDT price has broken a significant resistance zone after a 65-day downtrend. EIGEN is the second-largest Ethereum staking token by TVL (Total Value Locked), with a current market cap of approximately $1 billion. In the short to mid-term, its market cap could potentially reach $2 billion, and by the end of the bull run, it might grow to $5–10 billion. The price is currently making a new all-time high (ATH).
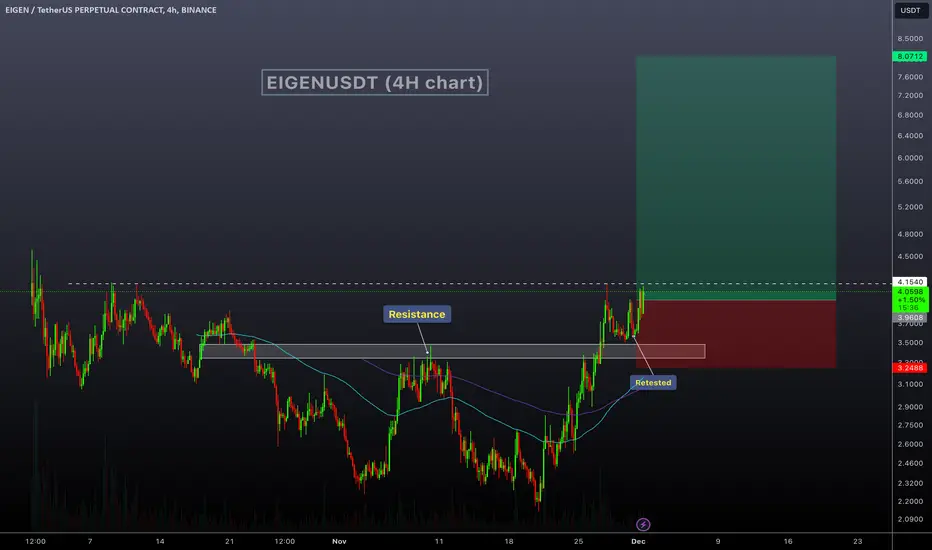
EIGENUSDT Resistance breakoutEIGENUSDT Technical analysis update
The EIGEN/USDT price has broken the neckline resistance on the 4H chart and is now heading toward the next resistance at $4.20. The price is trading above the 100 and 200 EMA, and a break above the $4.20 level could signal a strong bullish move.
Target : 50%-100%
Regards
Hexa