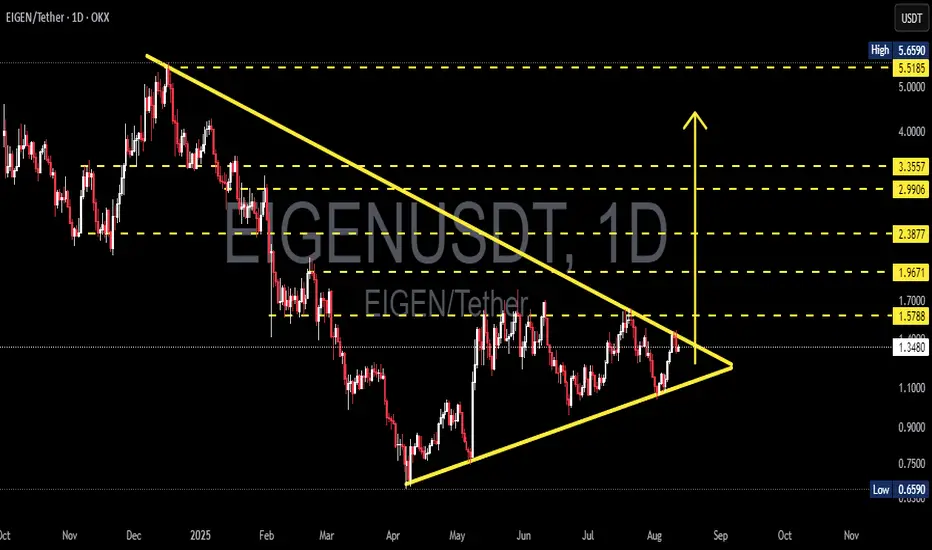
EIGEN/USDT — Symmetrical Triangle: Breakout Imminent?Summary
The daily chart shows a symmetrical triangle pattern (descending resistance from Dec–Aug and ascending support from April). Price is currently around 1.36 USDT, squeezing into the narrow apex zone — this suggests high volatility is likely once a breakout occurs. Statistically, this pattern is neutral, but the formation of higher lows since April gives a slight bullish bias. However, given the prior strong downtrend, we must not ignore the potential for a continuation to the downside.
---
Technical Pattern Details
Pattern: Symmetrical triangle / contracting triangle — two converging trendlines: lower highs vs higher lows.
Meaning: Consolidation between buyers & sellers, representing accumulation/distribution before a sharp move.
Probability: Neutral — the breakout direction defines the medium-term bias. With the prior downtrend, continuation is possible, but persistent higher lows suggest ongoing demand.
Timing: Apex likely reached in Sept; breakouts often occur before or at the apex.
---
Key Levels (from chart)
Current price: 1.3604 USDT
Resistance levels: 1.5788, 1.9671, 2.3877, 2.9906, 3.3557, and major high at 5.52–5.66 USDT.
Key support: ascending trendline & historical low at 0.6590 USDT.
---
Bullish Scenario (Confirmation & Targets)
Confirmation:
1. Daily candle closes above the triangle resistance (~1.58–1.65 USDT, depending on precision).
2. Breakout volume is higher than average.
3. Retest holds as support after breakout.
Targets after bullish breakout:
TP1: 1.5788
TP2: 1.9671
TP3: 2.3877 → 2.9906 → 3.3557 (if strong momentum)
Example aggressive setup:
Entry: 1.62 USDT
Stop-loss: 1.30 USDT
Risk per unit = 0.32 USDT
TP1 (1.97) → ~1.09R
TP2 (2.38) → ~2.37R
---
Bearish Scenario (Confirmation & Targets)
Confirmation:
1. Strong rejection at triangle resistance, followed by daily close below ascending support.
2. Increased volume on breakdown.
3. Failed retest of broken support.
Targets after bearish breakdown:
TP1: Local support zones (~1.10–0.90).
TP2: Historical low 0.6590 USDT.
Example short setup:
Entry: 1.30 USDT
Stop-loss: 1.60 USDT
Target: 0.659 USDT → ~2.14R
---
Trading & Risk Management Notes
1. Wait for confirmation — avoid early intraday breakouts.
2. Retest entries for conservative trades.
3. Stop-loss placement beyond structural levels.
4. Risk per trade: 1–3% of total capital.
5. Partial scale-in if breakout shows strong momentum.
6. Beware of fakeouts — common in tightening triangles.
---
Confirmation Checklist
Daily close outside trendline.
Breakout volume above accumulation average.
RSI/Stoch supports breakout direction.
Multi-timeframe alignment (e.g., 4H, 12H).
Liquidity/spread checks on exchange.
---
Risk Notes
Triangles after a downtrend can be continuation patterns — don’t pre-bias without confirmation.
Use horizontal resistance levels for realistic profit-taking instead of overly optimistic measured moves.
Watch for correlated market moves (BTC/ETH).
---
EIGEN/USDT (1D) forming a symmetrical triangle — volatility spike likely as breakout nears. Wait for daily close + volume above 1.58–1.65 for bullish targets (1.97 → 2.38 → 2.99), or breakdown below ascending support for bearish targets (down to 0.659). Manage risk and watch for retests.
#EIGEN #EIGENUSDT #CryptoTA #SymmetricalTriangle #BreakoutSetup #SupportResistance #TechnicalAnalysis #CryptoTrading #AltcoinAnalysis #RiskManagement
Eigenstateanalytics
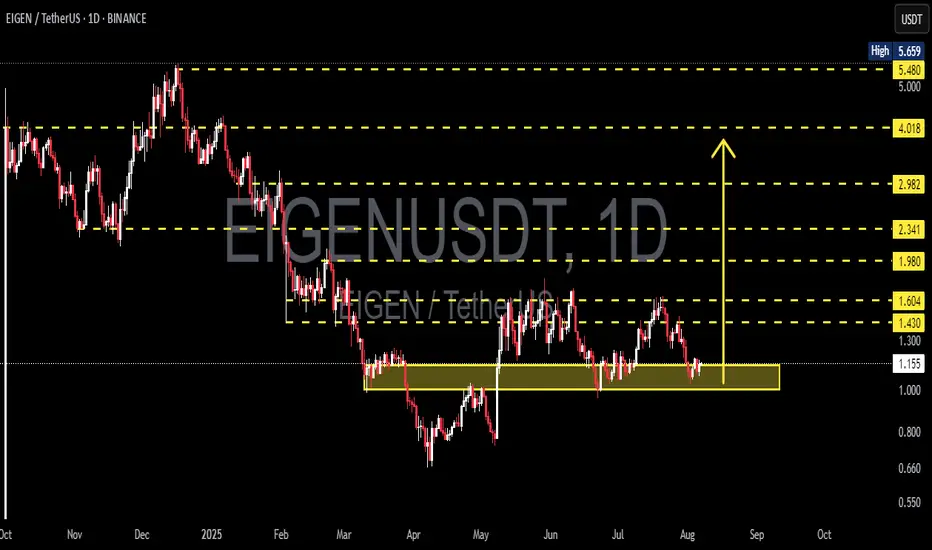
EIGEN/USDT TestingDemand Zone – Rebound or Breakdown Ahead?🧠 Technical Analysis:
🔸 Market Structure:
The price is currently sitting around 1.15 USDT, right above a key demand zone (highlighted in yellow) that has been tested multiple times since March 2025.
This area between 1.00 – 1.20 USDT acts as a major support zone.
🔸 Key Resistance Levels:
1.430 USDT → short-term resistance
1.604 USDT → significant resistance (previous support turned resistance)
Higher resistance targets: 1.980, 2.341, 2.982, 4.018, and 5.480 USDT
🔸 Key Support Levels:
1.154 USDT → current price level
Main demand zone: 1.00 – 1.20 USDT
If broken, the next major support lies around 0.80 USDT
---
📈 Bullish Scenario:
If the 1.00 – 1.20 USDT demand zone holds and the price prints a higher low, a bullish reversal is possible.
Short-term target: 1.43 and 1.60 USDT
If 1.60 is broken with strong momentum, the next targets are: 1.98 – 2.34 USDT
Bullish confirmation will be stronger if the price breaks and closes above 1.60 USDT on the daily chart
✅ Bullish Confirmation:
Bullish engulfing candle near support
Rising volume on upward moves
Breaking above previous lower highs
---
📉 Bearish Scenario:
If the price breaks down below the 1.00 – 1.15 USDT support zone, downside targets shift toward 0.80 – 0.66 USDT
A descending triangle pattern may be forming if the price continues making lower highs while testing the same support
⚠️ Bearish Confirmation:
Strong bearish candle closing below support
High sell volume
New lower low after a failed bounce
---
🔺 Pattern Analysis:
The price has been forming a range-bound pattern between 1.00 – 1.60 USDT
A potential double bottom could form if this support holds and price bounces up again
Otherwise, it may evolve into a descending triangle, signaling bearish pressure
---
🔖 Conclusion:
EIGEN is at a critical support zone that could define its next major move. A strong reaction here could signal a bullish reversal, while a breakdown could open the door to deeper declines. This is a key level to watch.
#EIGEN #EIGENUSDT #CryptoAnalysis #Altcoin #TechnicalAnalysis #SupportResistance #BullishScenario #BearishScenario #CryptoTrading #ChartAnalysis
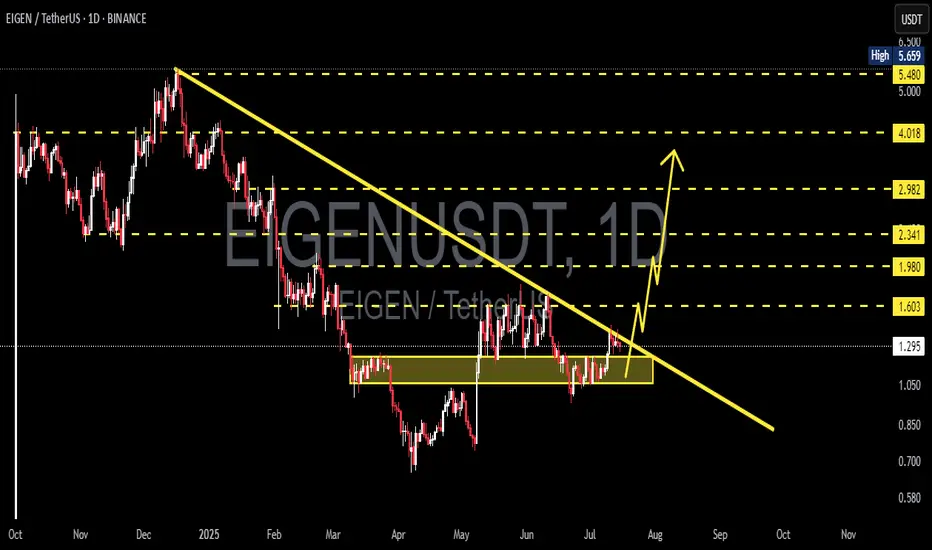
EIGEN/USDT Breakout Countdown: Descending Triangle Retest
EIGEN/USDT is currently at a critical technical juncture. After months of downward pressure, the pair is now showing signs of a major bullish breakout from a descending triangle pattern, which is often a strong reversal signal. Are we about to witness an explosive upside move? Let’s dive into the setup.
🧠 Key Technical Structure
📌 Pattern: Descending Triangle (Bullish Reversal Potential)
Formed since December 2024
Strong horizontal support between $1.05–$1.28 (yellow box), tested multiple times
Series of lower highs forming a descending trendline, now being challenged by price action
This structure hints at heavy accumulation beneath resistance
📌 Volume: Gradually increasing near breakout zone — a sign of accumulation by smart money
📌 Breakout Confirmation: A daily close above $1.30 with strong volume will validate the breakout, potentially triggering a powerful move.
🟢 Bullish Scenario (Confirmed Breakout)
If EIGEN breaks and successfully retests the descending trendline, a major rally could follow, with these targets in sight:
🎯 Upside Price Targets:
1. $1.60 – Minor resistance and previous support flip
2. $1.98 – Previous distribution zone
3. $2.34 – Horizontal resistance from past structure
4. $2.98 – Mid-Fibonacci extension target
5. $4.01 – Full height target from triangle breakout
6. $5.48–$5.65 – Long-term target from historical resistance
✅ This structure aligns with a classic impulsive wave pattern following a major technical breakout.
🔴 Bearish Scenario (Failed Breakout / Fakeout)
Not all breakouts are successful. Here's what to watch out for:
🔻 If price fails to hold above $1.28, and breaks below $1.05, the structure turns bearish:
Opens the door for a trend continuation downward
Next supports lie at $0.90–$0.80, and possibly $0.65–$0.60
Indicates that sellers are still in control and accumulation has failed
🚫 This would invalidate the bullish setup and signal caution for long positions.
📌 Suggested Trading Plan
Entry Strategy:
Conservative: Wait for a confirmed breakout and successful retest above $1.30
Aggressive: Enter on intraday breakout with strong volume above trendline
Stop Loss: Below triangle support (~$1.02–$1.05)
Take Profits (TP): Scale out at $1.60 / $1.98 / $2.34 / $2.98 / $4.01 / $5.48
💬 Conclusion
EIGEN is on the verge of a major technical move. A clean breakout from the descending triangle could mark the transition from bearish consolidation to bullish expansion — a structure often seen before explosive rallies in altcoins.
Always manage risk wisely, stay alert for retests, and never chase entries without confirmation. This is a setup worth watching closely in the coming days!
#EIGEN #EIGENUSDT #CryptoBreakout #DescendingTriangle #AltcoinSeason #BullishSetup #ChartPattern #BreakoutAlert #SmartMoneyMoves #CryptoTechnicalAnalysis
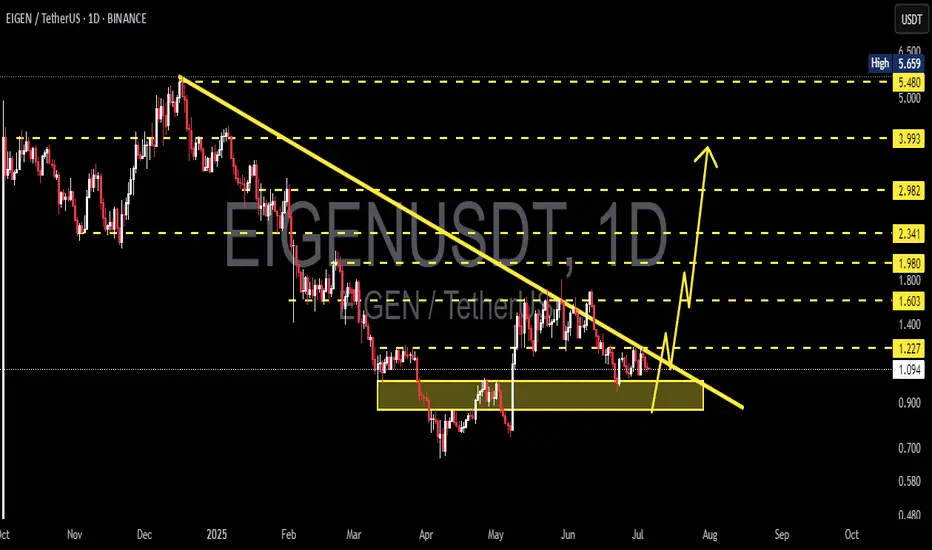
EIGEN/USDT — Ready to Explode from Accumulation?🔍 Detailed Technical Analysis (1D Timeframe):
After months of bearish pressure, $EIGEN is now showing early signs of a trend reversal. The chart is painting a compelling picture of a breakout setup backed by a strong accumulation base and a long-term descending trendline.
🟨 Solid Accumulation Zone:
Price has been consolidating tightly within the $0.90 – $1.10 range, forming a clear accumulation zone. This zone has acted as a reliable support area multiple times, rejecting bearish attempts and indicating smart money accumulation.
This type of sideways base is often the foundation for explosive upside moves.
📉 Descending Trendline Breakout Setup:
A clear descending resistance line has been holding since the highs in December 2024.
Price is now approaching a critical breakout point. A confirmed breakout above this trendline could mark the beginning of a new bullish trend.
📈 Bullish Scenario (Momentum Breakout):
If price breaks out above the descending trendline and clears the key resistance at $1.227, the path toward higher targets opens up quickly:
Bullish Target Levels Description
🎯 $1.603 Minor psychological resistance
🎯 $1.980 Structural resistance
🎯 $2.341 Fibonacci confluence & supply zone
🎯 $2.982 Medium-term target
🎯 $3.993 Breakout continuation level
🎯 $5.480 – $5.659 Previous all-time high (ATH) region
📌 Note: For a valid breakout, look for a strong daily candle close above $1.227, ideally with high volume to confirm momentum.
🔻 Bearish Scenario (Rejection Play):
If price gets rejected at the trendline and fails to break $1.227:
A pullback to the $1.00 – $0.90 accumulation zone is likely.
If that support fails, price may drop toward:
🔻 $0.85
🔻 $0.78
🔻 $0.68 (key psychological & historical volume zone)
📊 Conclusion: Make or Break Moment Ahead
EIGEN is at a critical decision point. A successful breakout could kick off a major bullish phase, while a failure may extend the sideways or bearish action.
With a strong base formed and pressure building near the trendline, this setup deserves a spot on every trader’s radar.
#EIGENUSDT #CryptoBreakout #AltcoinSetup #TechnicalAnalysis #BullishScenario #BearishScenario #AccumulationZone #PriceAction #CryptoTrading #CryptoAnalysis