EURJPY - WEEKLY ROUNDUPSo unlucky with this entry this week - wicked out by 6 pips! Now flying to TP for 6%.
EJ
EJ 55 pips Sells Breakdown 06/10/2020The first time price broke below support which was required for sells, resistance was formed but we never got the final confirmation required to execute on sells. Price then broke back into the range before we took an entry.
As we had already formed resistance, I was happy to go down to the 5m timeframe to confirm sells. The next 5m candle broke back below support signalling a fakeout, this meant there was a high probability price would drop to the next support.
My confirmation to enter sells was when the next 5m candle broke below the previous candle. Stops were above the previous 5m candle and the targets were 124.200 and then if we broke below that support, we expected price to push down to 123.885. Both of our targets were smashed.
When we broke below the first support, we moved our stops into profit following market structure to make the trade risk and stress free.

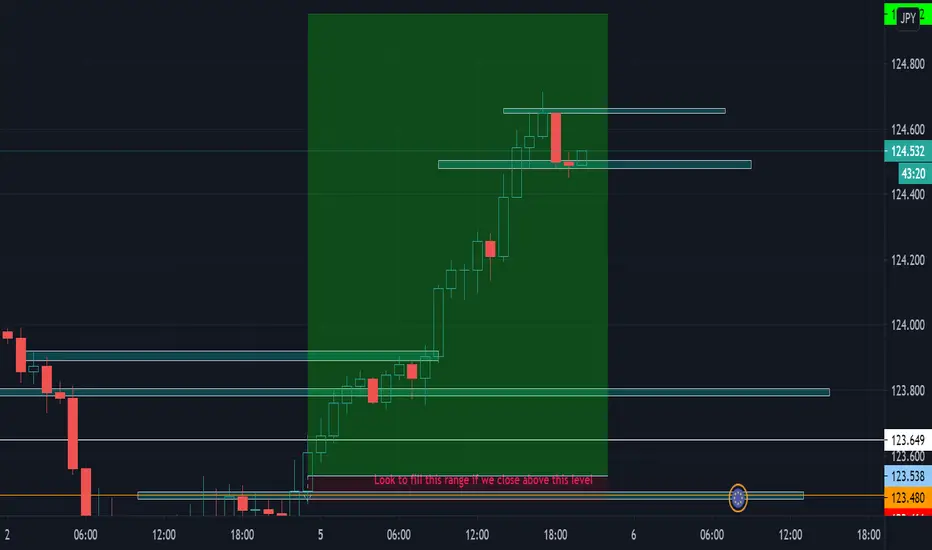
EJ Analysis 04/10/2020 -- UpdateI had already highlighted that for buys to be valid, price needed to break resistance and form a support.
Price did exactly this and as support was formed, I looked for confirmations to enter buys. When the bullish 15m candle broke the high of the previous 15m candle which was our formation of support, I entered the trade.
My stops were below the current 30m candle and I secured profits and left stops at BE when the zone highlighted as a potential barrier for price to break through was tapped.
I left half of my position open and closed 90% of that at the 100 pip mark, with my final runner eventually getting stopped out at 98 pips profit.
This is an example of trailing stop loss, every so often I moved my SL further into profit following market structure.
The risk reward on this trade was 18.36 and price moved beautifully with no bumps along the way.
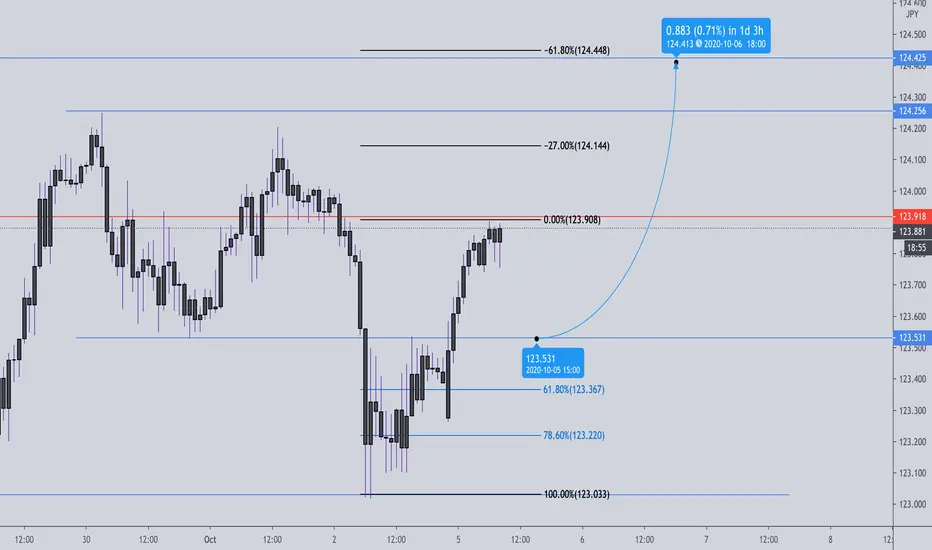
EUR/JPY TO 124.425Fib 50.00% retest , which correlates with daily support. -61.8% fib roughly correlates with swing point.
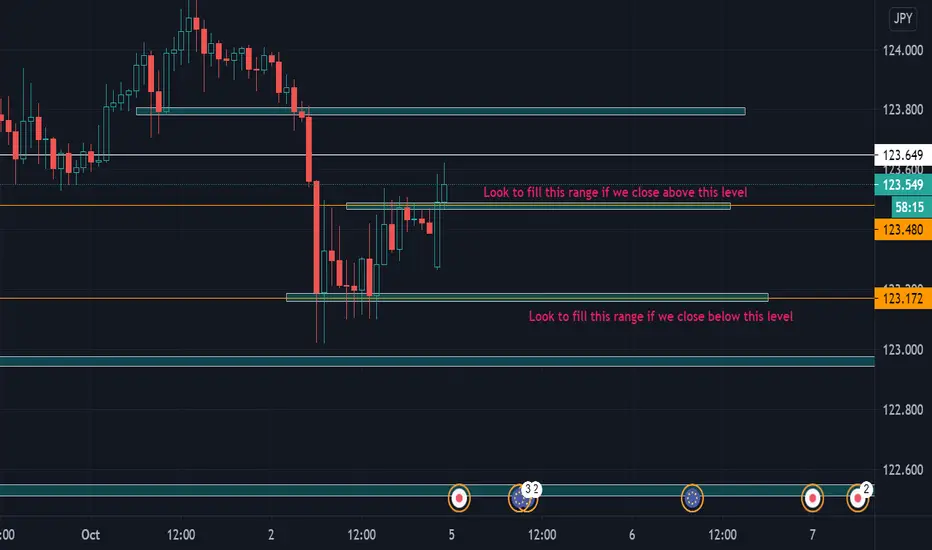
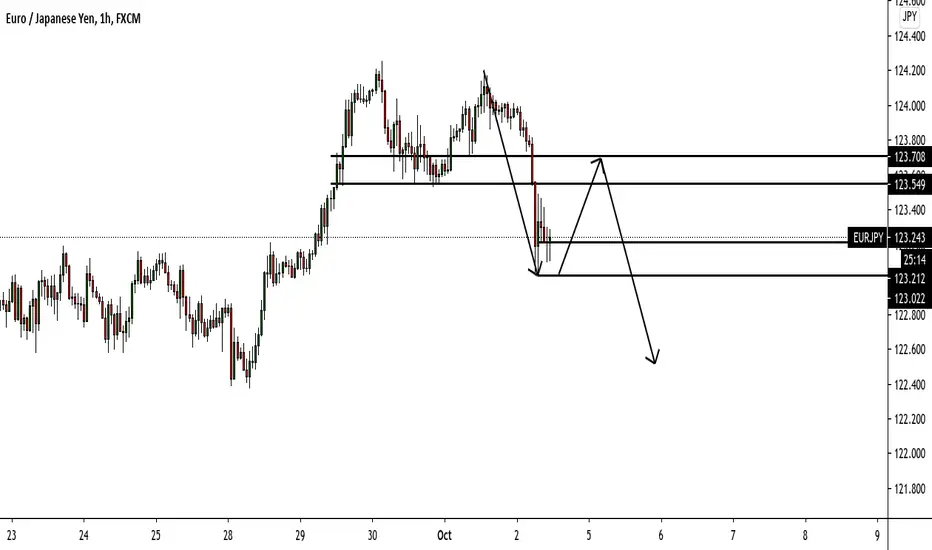
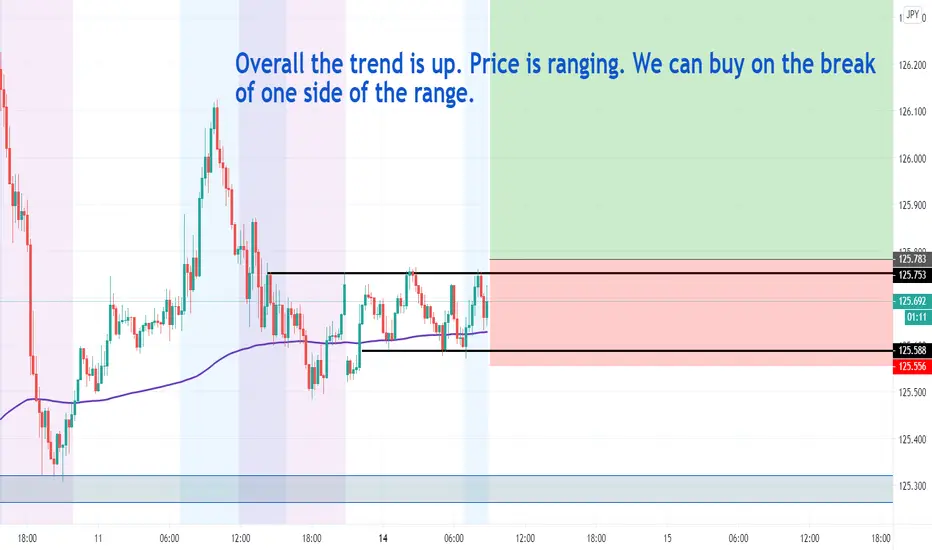
EJ Analysis 04/10/2020We are currently trading in a 30 pip range.
1) If we close above 123.475, look for support to form on lower timeframes before executing buys to fill the range up to 123.800, I have highlighted a potential barrier.
2) If we close below 123.175, we can look to target the next support down at 122.950, and if Asian volume pushed price down maybe even target 122.550. For sells to be valid we need a break of 123.175, and resistance to form on lower timeframes
Buys are looking good now however.
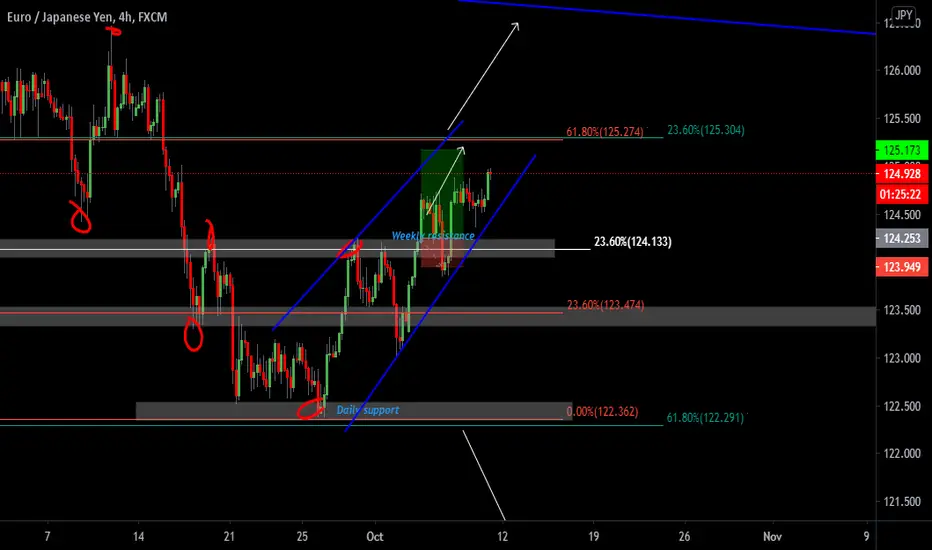
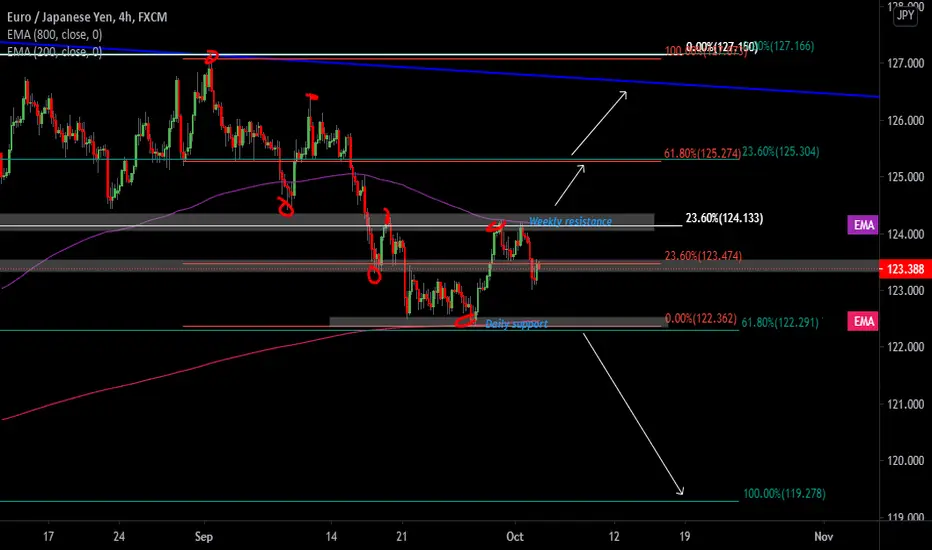
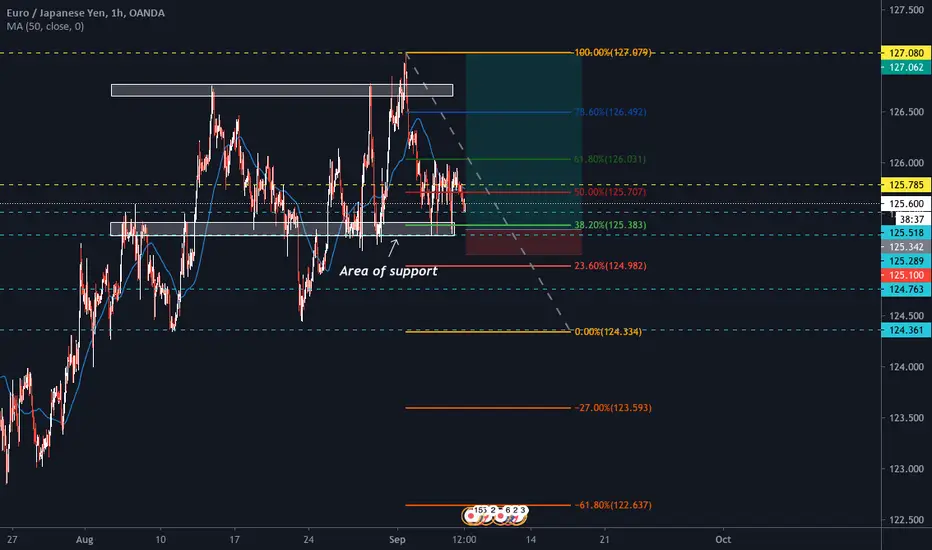
EURJPY WEEKLY OUTLOOKTECHNICAL POINTS:
Weekly Fib (white)
Daily Fib (blue)
4hr Fib (orange)
Weekly descending trendline
Weekly resistance
Daily support
4hr Double Top
4hr 200EMA
4hr 800EMA
4hr LL's LH's structure (red circles)
Buy Confirmations:
Close above 124.400, which would break the descending structure and close above the weekly 23.6% fib, 4hr 200ema and weekly resistance.
Sell Confirmations:
Close below 122.250, which would be below the daily support, 4hr 800EMA and daily 61.8% fib level. Clear traffic to target.
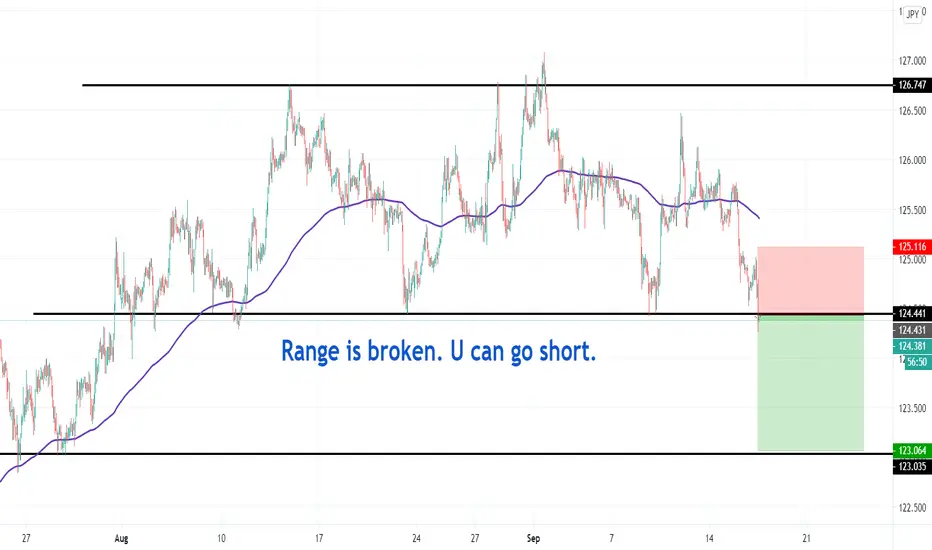
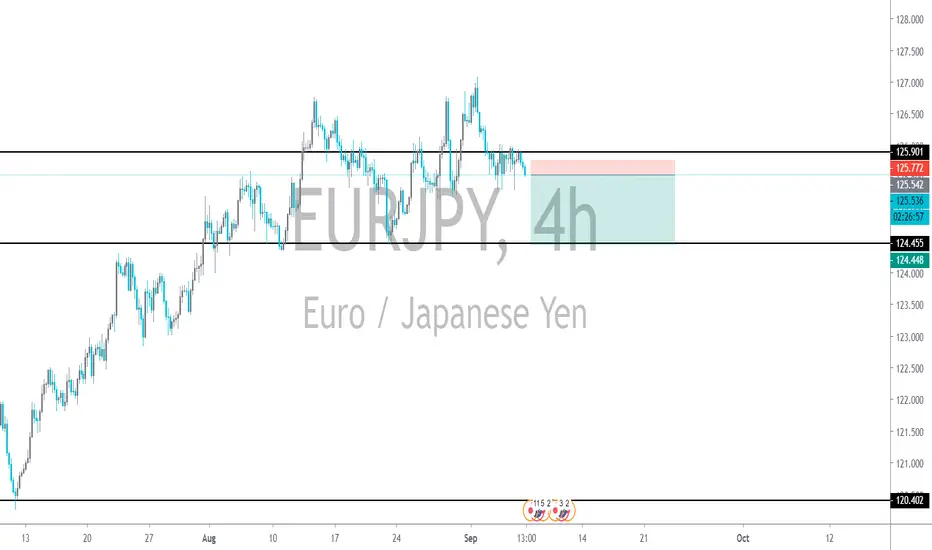
eurjpy shortej is looking short due to double top and break of structure. Waiting on pullback to go short.
EJ SHORTSWas in some nice profits, coming for a reaction and back down we go baby.. Lets see how we play out, holding over weekend.

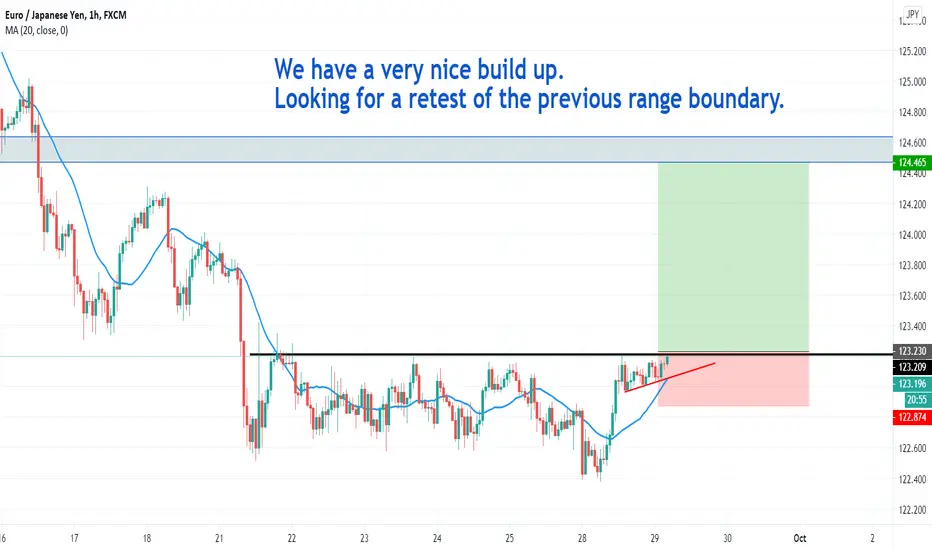
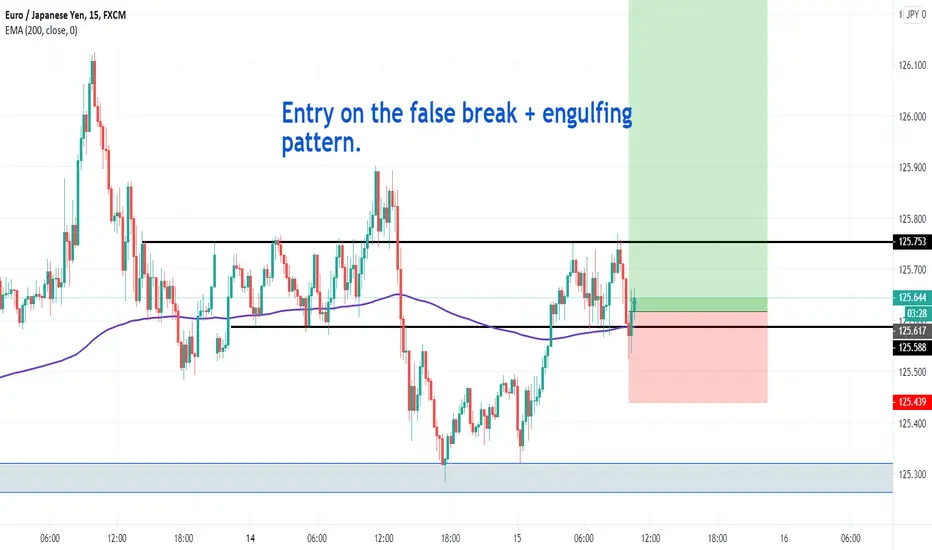
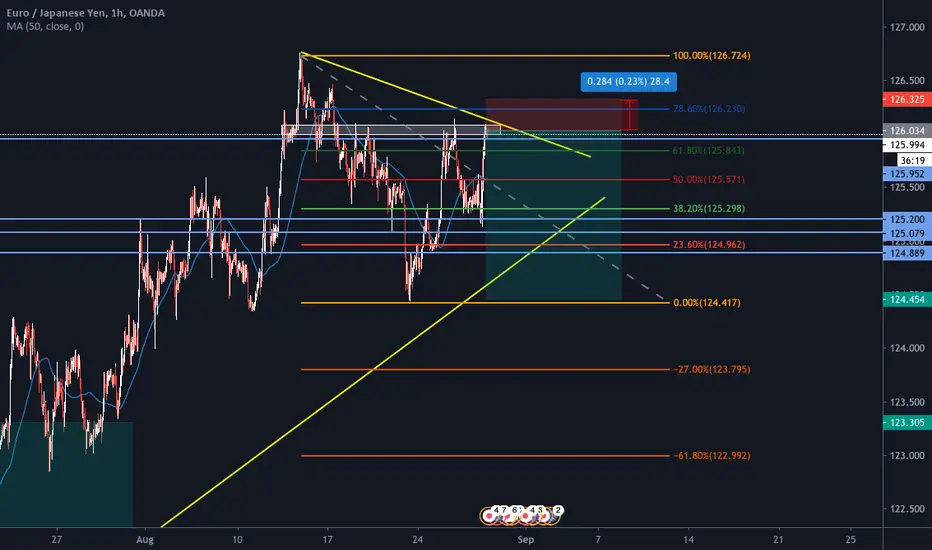
EJ Analysis 29/09/2020We are currently trading in a 15 pip range. If we break resistance, and form support on lower timeframes, buys could be valid up to the next form of resistance as there is a 15 pip range to target, however I have highlighted a zone we need to watch with caution as it is a previous rejection area. This is why I would prefer sells, we have a much cleaner 18 pip range to fill with no barriers. So if we close below support, and form resistance on lower timeframes, sells would be a solid option.

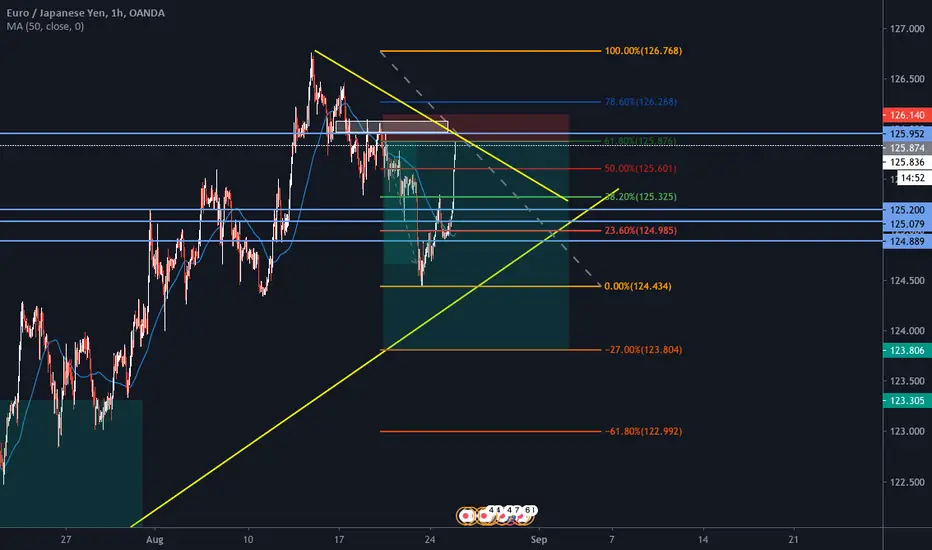
EJ Analysis 28/09/2020 -- UpdateThis analysis played out perfectly, Price broke resistance and created a support on the 15m timeframe, when the 15m candle broke the high of the previous candle after creating support, we executed buys with our stops below the current 15m candle and out 3 take profit points highlighted on the chart from before, all three TPs were smashed and price ended up rejecting off our final target, making this a perfect trade.

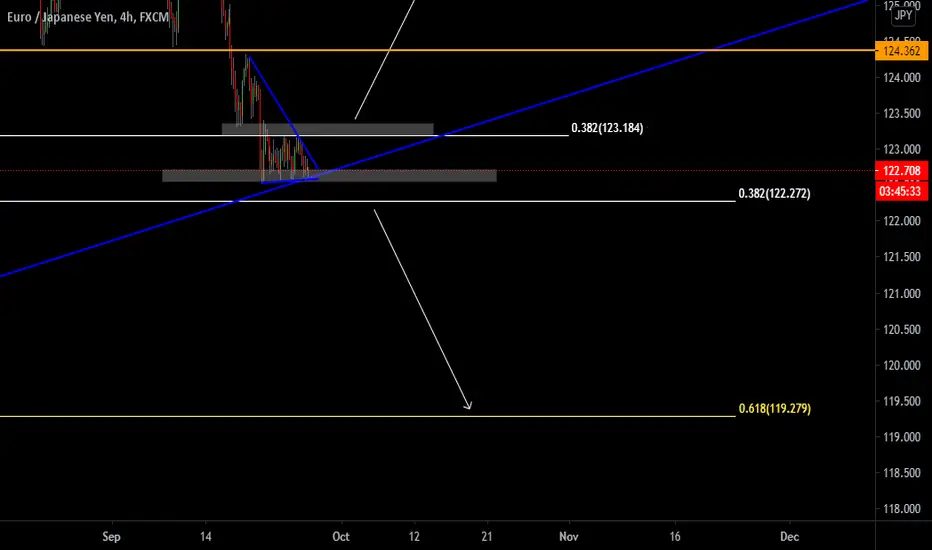
EURJPY WEEKLY OUTLOOKTECHNICAL:
Daily ascending trendline
4hr falling wedge
daily support
4hr resistance
Weekly fib
Daily fib
Buys:
Break of wedge
Break of 4hr resistance
Break of 38.2% daily fib
Sells:
Break of daily support
Break of daily ascending trendline
Break of weekly 38.2% fib
EUR/JPY +240 pips from Short Entry Posted 9/11
Holding, with 50% profit taken. Return on this trade has been +6.8% so far.
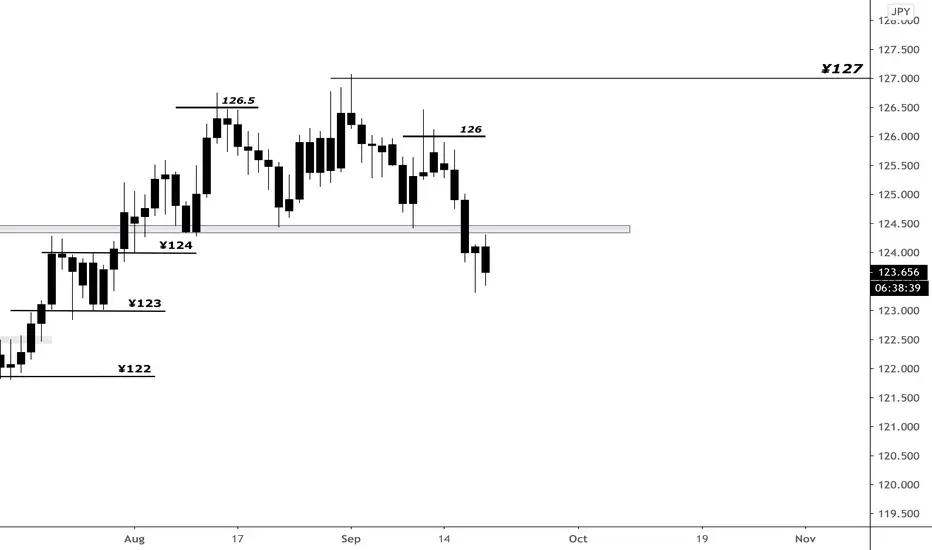
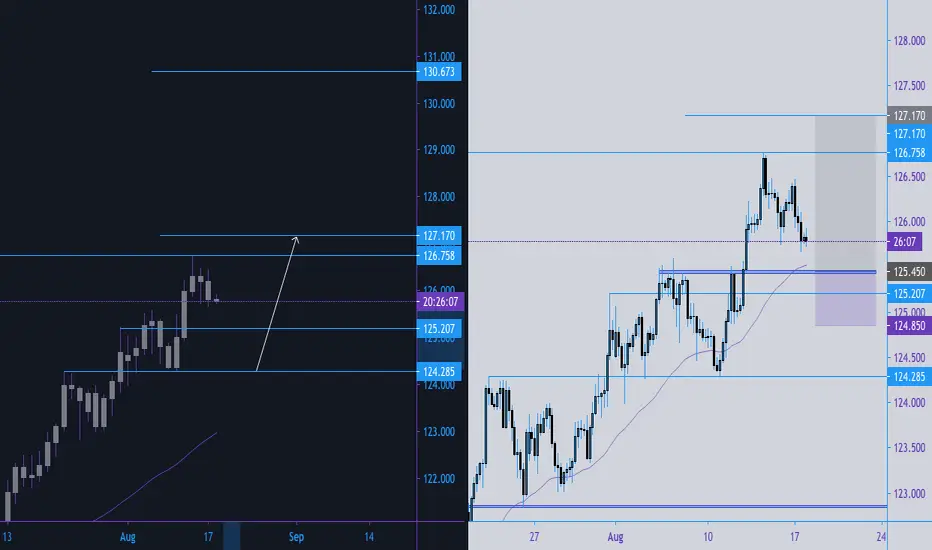
EJ Looking at a possible head & shoulder play out on the daily which would throw this down into 124.30 for the base/neckline , checking 4 hour & 15 min for longs into 127 if this H&S isn't going to play out. We shall see
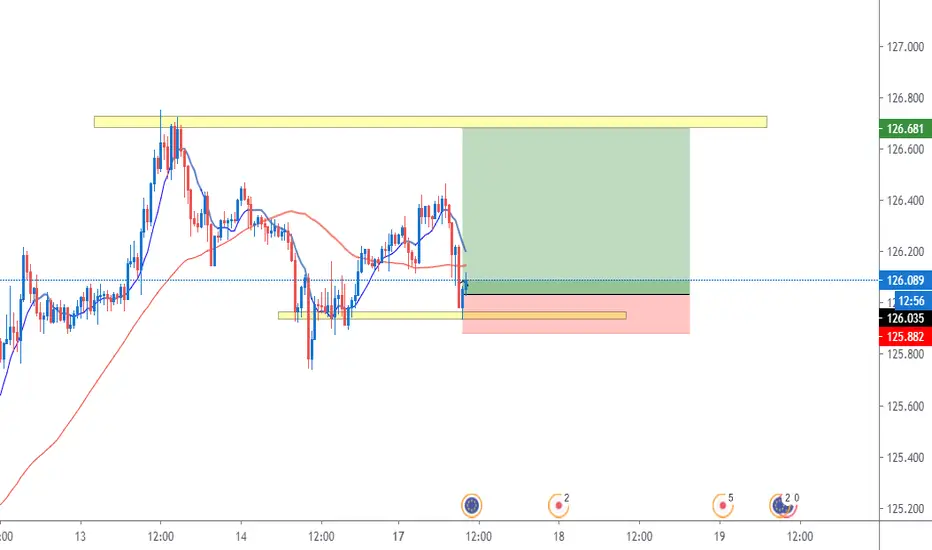
EJ possible longtnice uptrend on EJ looks too good to miss out on. i want price to come back and test the trend line and support again so our entry is good, this also correlates with the 0.5 fibonacci level. all of these confluences together if we see nice rejections should give us a nice edge over the market. this mixed with good risk management and your most of the way there to becoming profitable
